
Key Insights
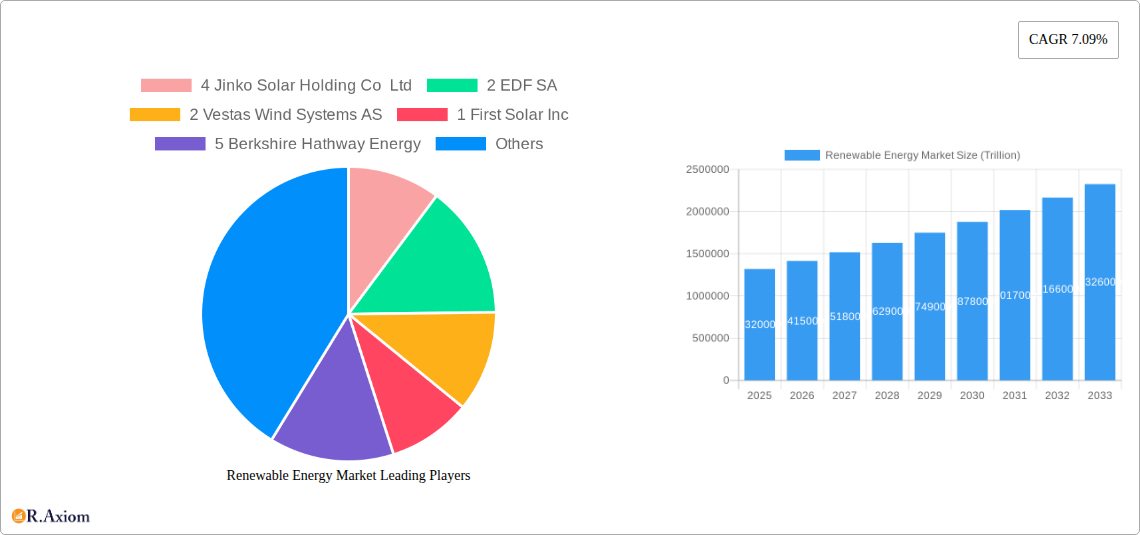
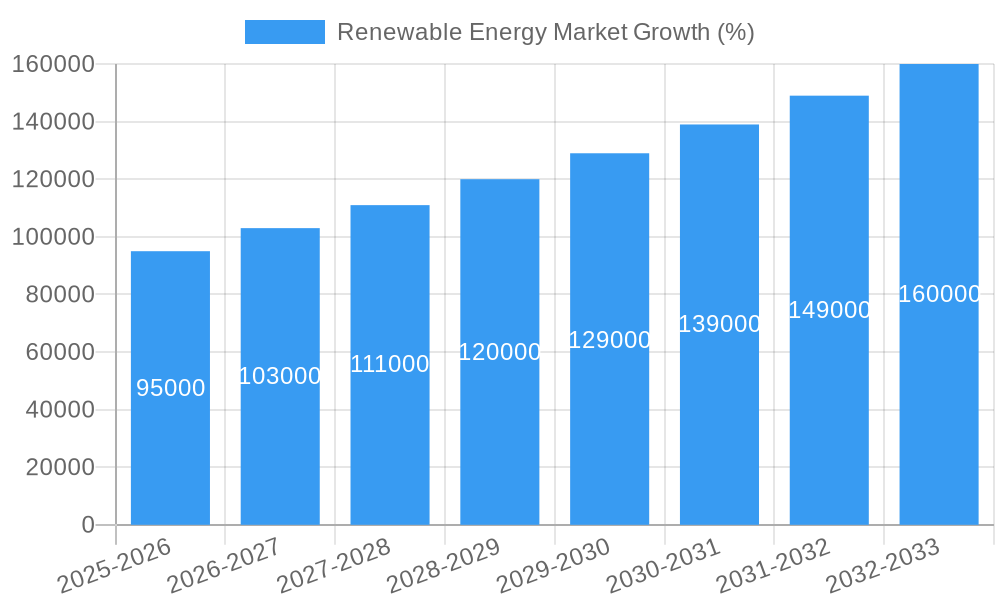
The renewable energy market is experiencing robust growth, projected to reach a market size of $1.32 trillion in 2025, exhibiting a Compound Annual Growth Rate (CAGR) of 7.09%. This expansion is driven by several key factors. Increasing concerns about climate change and the urgent need to reduce carbon emissions are compelling governments and businesses to invest heavily in renewable energy sources. Furthermore, technological advancements have significantly reduced the cost of renewable energy technologies, making them increasingly competitive with traditional fossil fuels. Government policies, including subsidies, tax incentives, and renewable portfolio standards, are also playing a crucial role in accelerating market growth. The rising demand for energy globally, coupled with the depletion of fossil fuel reserves, further fuels the adoption of renewable energy solutions. Specific growth drivers include the expansion of grid infrastructure to accommodate intermittent renewable sources like solar and wind, and the increasing integration of energy storage solutions to mitigate intermittency challenges. While challenges remain, such as land use requirements for large-scale projects and the intermittency of certain renewable energy sources, ongoing innovation and supportive policy frameworks are likely to continue driving substantial market expansion.
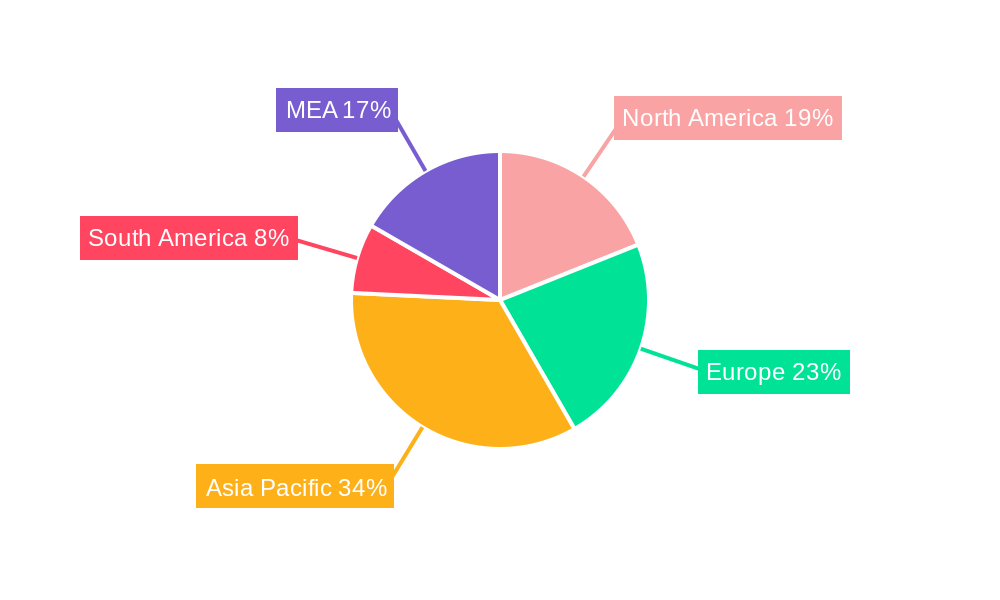
The renewable energy market is geographically diverse, with North America, Europe, and Asia-Pacific representing major regions. China, the United States, and several European nations are leading the charge in renewable energy adoption, driven by significant investments in solar, wind, and other renewable energy technologies. However, emerging markets in regions like South America, the Middle East, and Africa are also witnessing increased activity, presenting significant growth opportunities. The market is segmented across various technologies, including solar, wind, hydro, bioenergy, and geothermal. Solar and wind energy are currently the dominant segments, benefiting from technological advancements and cost reductions. However, other renewable energy technologies are also witnessing growth, particularly hydro and bioenergy, driven by their established presence and suitability for specific geographic locations. The competitive landscape is characterized by a mix of established energy companies, specialized renewable energy developers, and equipment suppliers. The consolidation and mergers and acquisitions within the industry further indicate the market's maturity and ongoing development. The forecast period from 2025 to 2033 promises continued expansion, underpinned by a global push towards cleaner energy and the increasing economic viability of renewable energy solutions.
Renewable Energy Market: A Trillion-Dollar Opportunity - Comprehensive Market Report 2019-2033
This comprehensive report provides an in-depth analysis of the global renewable energy market, projecting a market value exceeding several trillion USD by 2033. The study covers the period 2019-2033, with 2025 as the base and estimated year. It offers crucial insights for investors, industry stakeholders, and policymakers navigating the rapidly evolving landscape of clean energy.
Renewable Energy Market Market Concentration & Innovation
The renewable energy market demonstrates a dynamic interplay between established players and emerging innovators. Market concentration is moderate, with several large companies holding significant shares, while numerous smaller players contribute to innovation and competition. The market is characterized by ongoing mergers and acquisitions (M&A), with deal values in the billions of USD reflecting consolidation and expansion strategies.
Key Metrics & Trends:
- Market Share: Top 6 companies hold approximately xx% of the market share (2025 estimate).
- M&A Activity: Significant M&A activity observed in the past 5 years, with total deal value exceeding xx trillion USD.
- Innovation Drivers: Technological advancements (e.g., improved efficiency of solar panels, larger wind turbine capacities), supportive government policies (e.g., subsidies, tax incentives), and increasing consumer demand for sustainable energy sources are key drivers of innovation.
- Regulatory Frameworks: Varying regulatory landscapes across different countries influence market growth and investment decisions. Standardization efforts and regulatory clarity are needed to accelerate market expansion.
- Product Substitutes: Fossil fuels remain the primary substitute, but their competitiveness is diminishing due to decreasing renewable energy costs and increasing environmental concerns.
- End-User Trends: A growing preference for renewable energy sources among both residential and commercial consumers is evident. Large corporations are increasingly adopting renewable energy to meet sustainability goals and reduce carbon footprints.
Renewable Energy Market Industry Trends & Insights
The renewable energy market exhibits strong growth potential, driven by several key factors. The sector is experiencing rapid technological advancements, leading to increased efficiency and cost reductions. This, coupled with supportive government policies and increasing environmental awareness, fuels market expansion. The compound annual growth rate (CAGR) for the forecast period (2025-2033) is projected to be xx%, with market penetration steadily rising.
Specific market trends include:
- Technological Disruptions: Significant breakthroughs in solar, wind, and other renewable energy technologies are continuously enhancing efficiency and reducing costs.
- Consumer Preferences: Growing consumer preference for clean energy is driving demand, influencing purchasing decisions, and creating new market segments.
- Competitive Dynamics: Intense competition among renewable energy companies is fostering innovation and driving down prices, benefiting consumers.
- Market Growth Drivers: The transition to a low-carbon economy, coupled with escalating energy prices and increasing environmental regulations, is creating a highly favorable environment for renewable energy adoption.
Dominant Markets & Segments in Renewable Energy Market
The renewable energy market is characterized by regional variations in dominance. While the exact ranking fluctuates yearly, Asia, particularly China, is currently the leading market, driven by significant investments in solar and wind power infrastructure. Europe and North America also represent substantial markets. Within the renewable energy segments, solar and wind power are the dominant types, owing to technological advancements, cost-effectiveness, and wider applications.
Key Drivers:
- Solar: Decreasing costs of solar panels, technological advancements, and supportive government policies.
- Wind: Improved turbine designs, favorable wind resources in specific regions, and increasing grid integration capabilities.
- Hydro: Existing infrastructure in some regions, stable energy generation, but limited expansion potential due to environmental concerns.
- Bioenergy: Growing demand for sustainable biomass resources and potential for carbon capture and storage.
- Other Types (Geothermal, Tidal, etc.): Technological advancements and potential for niche applications but limited market penetration.
Dominance Analysis: China's dominance in the solar market stems from its massive manufacturing capacity, robust government support, and extensive deployment of solar farms. Europe's strength in wind power is attributed to its advanced technology, supportive policy landscape, and offshore wind farm development.
Renewable Energy Market Product Developments
Recent product innovations focus on enhanced efficiency, durability, and cost-effectiveness. For example, advancements in solar panel technology have led to higher energy conversion rates and improved performance in various weather conditions. Similarly, improvements in wind turbine designs have resulted in larger capacity factors and reduced maintenance requirements. These technological trends are driving increased market adoption and competitiveness across different segments.
Report Scope & Segmentation Analysis
This report segments the renewable energy market by type: Solar, Wind, Hydro, Bioenergy, and Other Types (Geothermal, Tidal, etc.). Each segment is analyzed in detail, providing insights into market size, growth projections, competitive dynamics, and key drivers. Growth projections vary significantly across segments; solar and wind are expected to lead in growth, while other renewable energy sources have more limited penetration but show potential for niche applications and future growth. The competitive landscape varies depending on the segment, with different technologies and business models influencing market dynamics.
Key Drivers of Renewable Energy Market Growth
The renewable energy market's growth is propelled by a convergence of technological, economic, and regulatory factors. Technological advancements have significantly reduced the cost of renewable energy technologies, making them competitive with conventional energy sources. Governments worldwide are implementing supportive policies, including subsidies, tax incentives, and renewable portfolio standards, to encourage renewable energy adoption. Furthermore, increasing concerns about climate change and air pollution are driving demand for cleaner energy sources. The falling prices of solar and wind power have been pivotal to its market expansion.
Challenges in the Renewable Energy Market Sector
Despite significant growth potential, the renewable energy market faces several challenges. Intermittency of renewable energy sources (solar and wind) poses significant hurdles for grid stability and energy security. Supply chain disruptions and resource availability can impact production and deployment of renewable energy technologies. Furthermore, regulatory uncertainties and inconsistent policy frameworks across different regions can create investment risks and hinder market expansion. These challenges, especially intermittency, could decrease overall efficiency and production by approximately xx% in the coming years.
Emerging Opportunities in Renewable Energy Market
The renewable energy market presents numerous opportunities for growth and innovation. The increasing adoption of energy storage technologies is mitigating the intermittency issue of renewable energy sources. The development of smart grids and advanced energy management systems enhances grid integration and optimizes renewable energy utilization. Emerging markets, particularly in developing economies, offer substantial growth potential for renewable energy deployment. Additionally, the increasing integration of renewable energy into various sectors (e.g., transportation, industry) is opening new market avenues.
Leading Players in the Renewable Energy Market Market
- Jinko Solar Holding Co Ltd
- EDF SA
- Vestas Wind Systems AS
- First Solar Inc
- Berkshire Hathaway Energy
- Orsted AS
- Canadian Solar Inc
- Duke Energy Corporation
- Acciona Energia SA
- NextEra Energy Inc
- General Electric Company
- Siemens Gamesa Renewable Energy SA *List Not Exhaustive
Key Developments in Renewable Energy Market Industry
- April 2023: ArcelorMittal Brazil and Casa dos Ventos formed a joint venture to develop the 554 MW Babilonia wind power project in Bahia, Brazil, representing a USD 800 million investment. This highlights the growing involvement of industrial companies in renewable energy projects.
- January 2023: Cepsa announced three new solar power projects in Castilla-La Mancha, Spain, totaling 400 MW and representing a USD 305 million investment. This demonstrates continued investment in solar energy in Europe.
- May 2022: NJR Clean Energy Ventures (CEV) commenced construction of an 8.9-MW floating solar installation in New Jersey, USA, marking a significant milestone in floating solar technology adoption.
Strategic Outlook for Renewable Energy Market Market
The renewable energy market is poised for continued robust growth, driven by several factors. Falling costs, technological advancements, supportive government policies, and increasing environmental awareness are expected to propel market expansion. Emerging markets and the integration of renewable energy into various sectors represent significant growth opportunities. The sector's future success hinges on addressing challenges related to grid integration, intermittency, and supply chain resilience. Continued innovation and strategic investments are essential for realizing the full potential of renewable energy in achieving a sustainable energy future.
Renewable Energy Market Segmentation
-
1. Type
- 1.1. Solar
- 1.2. Wind
- 1.3. Hydro
- 1.4. Bioenergy
- 1.5. Other Types (Geothermal, Tidal, etc.)
Renewable Energy Market Segmentation By Geography
-
1. North America
- 1.1. United States of America
- 1.2. Canada
- 1.3. Rest of the North America
-
2. Europe
- 2.1. United Kingdom
- 2.2. Germany
- 2.3. France
- 2.4. Spain
- 2.5. NORDIC
- 2.6. Turkey
- 2.7. Russia
- 2.8. Rest of the Europe
-
3. Asia Pacific
- 3.1. China
- 3.2. India
- 3.3. Japan
- 3.4. Malaysia
- 3.5. Thailand
- 3.6. Indonesia
- 3.7. Vietnam
- 3.8. Rest of Asia Pacific
-
4. Middle East and Africa
- 4.1. United Arab Emirates
- 4.2. Saudi Arabia
- 4.3. Egypt
- 4.4. Nigeria
- 4.5. South Africa
- 4.6. Qatar
- 4.7. Rest of the Middle East and Africa
-
5. South America
- 5.1. Brazil
- 5.2. Argentina
- 5.3. Colombia
- 5.4. Rest of the South America
Renewable Energy Market REPORT HIGHLIGHTS
| Aspects | Details |
|---|---|
| Study Period | 2019-2033 |
| Base Year | 2024 |
| Estimated Year | 2025 |
| Forecast Period | 2025-2033 |
| Historical Period | 2019-2024 |
| Growth Rate | CAGR of 7.09% from 2019-2033 |
| Segmentation |
|
Table of Contents
- 1. Introduction
- 1.1. Research Scope
- 1.2. Market Segmentation
- 1.3. Research Methodology
- 1.4. Definitions and Assumptions
- 2. Executive Summary
- 2.1. Introduction
- 3. Market Dynamics
- 3.1. Introduction
- 3.2. Market Drivers
- 3.2.1. 4.; Favorable Government Policies for Renewable Energy4.; The Declining Price of Solar Panels and Wind Turbine Installations4.; Increasing Investments in Hydropower and Pumped Storage Hydropower Projects4.; Growing Emphasis on Geothermal Energy
- 3.3. Market Restrains
- 3.3.1. 4.; Increasing Penetration of Natural Gas for Power Generation
- 3.4. Market Trends
- 3.4.1. Hydropower Segment is Expected to Dominate the Market during the Forecast Period
- 4. Market Factor Analysis
- 4.1. Porters Five Forces
- 4.2. Supply/Value Chain
- 4.3. PESTEL analysis
- 4.4. Market Entropy
- 4.5. Patent/Trademark Analysis
- 5. Global Renewable Energy Market Analysis, Insights and Forecast, 2019-2031
- 5.1. Market Analysis, Insights and Forecast - by Type
- 5.1.1. Solar
- 5.1.2. Wind
- 5.1.3. Hydro
- 5.1.4. Bioenergy
- 5.1.5. Other Types (Geothermal, Tidal, etc.)
- 5.2. Market Analysis, Insights and Forecast - by Region
- 5.2.1. North America
- 5.2.2. Europe
- 5.2.3. Asia Pacific
- 5.2.4. Middle East and Africa
- 5.2.5. South America
- 5.1. Market Analysis, Insights and Forecast - by Type
- 6. North America Renewable Energy Market Analysis, Insights and Forecast, 2019-2031
- 6.1. Market Analysis, Insights and Forecast - by Type
- 6.1.1. Solar
- 6.1.2. Wind
- 6.1.3. Hydro
- 6.1.4. Bioenergy
- 6.1.5. Other Types (Geothermal, Tidal, etc.)
- 6.1. Market Analysis, Insights and Forecast - by Type
- 7. Europe Renewable Energy Market Analysis, Insights and Forecast, 2019-2031
- 7.1. Market Analysis, Insights and Forecast - by Type
- 7.1.1. Solar
- 7.1.2. Wind
- 7.1.3. Hydro
- 7.1.4. Bioenergy
- 7.1.5. Other Types (Geothermal, Tidal, etc.)
- 7.1. Market Analysis, Insights and Forecast - by Type
- 8. Asia Pacific Renewable Energy Market Analysis, Insights and Forecast, 2019-2031
- 8.1. Market Analysis, Insights and Forecast - by Type
- 8.1.1. Solar
- 8.1.2. Wind
- 8.1.3. Hydro
- 8.1.4. Bioenergy
- 8.1.5. Other Types (Geothermal, Tidal, etc.)
- 8.1. Market Analysis, Insights and Forecast - by Type
- 9. Middle East and Africa Renewable Energy Market Analysis, Insights and Forecast, 2019-2031
- 9.1. Market Analysis, Insights and Forecast - by Type
- 9.1.1. Solar
- 9.1.2. Wind
- 9.1.3. Hydro
- 9.1.4. Bioenergy
- 9.1.5. Other Types (Geothermal, Tidal, etc.)
- 9.1. Market Analysis, Insights and Forecast - by Type
- 10. South America Renewable Energy Market Analysis, Insights and Forecast, 2019-2031
- 10.1. Market Analysis, Insights and Forecast - by Type
- 10.1.1. Solar
- 10.1.2. Wind
- 10.1.3. Hydro
- 10.1.4. Bioenergy
- 10.1.5. Other Types (Geothermal, Tidal, etc.)
- 10.1. Market Analysis, Insights and Forecast - by Type
- 11. North America Renewable Energy Market Analysis, Insights and Forecast, 2019-2031
- 11.1. Market Analysis, Insights and Forecast - By Country/Sub-region
- 11.1.1 United States
- 11.1.2 Canada
- 11.1.3 Mexico
- 12. Europe Renewable Energy Market Analysis, Insights and Forecast, 2019-2031
- 12.1. Market Analysis, Insights and Forecast - By Country/Sub-region
- 12.1.1 Germany
- 12.1.2 United Kingdom
- 12.1.3 France
- 12.1.4 Spain
- 12.1.5 Italy
- 12.1.6 Spain
- 12.1.7 Belgium
- 12.1.8 Netherland
- 12.1.9 Nordics
- 12.1.10 Rest of Europe
- 13. Asia Pacific Renewable Energy Market Analysis, Insights and Forecast, 2019-2031
- 13.1. Market Analysis, Insights and Forecast - By Country/Sub-region
- 13.1.1 China
- 13.1.2 Japan
- 13.1.3 India
- 13.1.4 South Korea
- 13.1.5 Southeast Asia
- 13.1.6 Australia
- 13.1.7 Indonesia
- 13.1.8 Phillipes
- 13.1.9 Singapore
- 13.1.10 Thailandc
- 13.1.11 Rest of Asia Pacific
- 14. South America Renewable Energy Market Analysis, Insights and Forecast, 2019-2031
- 14.1. Market Analysis, Insights and Forecast - By Country/Sub-region
- 14.1.1 Brazil
- 14.1.2 Argentina
- 14.1.3 Peru
- 14.1.4 Chile
- 14.1.5 Colombia
- 14.1.6 Ecuador
- 14.1.7 Venezuela
- 14.1.8 Rest of South America
- 15. North America Renewable Energy Market Analysis, Insights and Forecast, 2019-2031
- 15.1. Market Analysis, Insights and Forecast - By Country/Sub-region
- 15.1.1 United States
- 15.1.2 Canada
- 15.1.3 Mexico
- 16. MEA Renewable Energy Market Analysis, Insights and Forecast, 2019-2031
- 16.1. Market Analysis, Insights and Forecast - By Country/Sub-region
- 16.1.1 United Arab Emirates
- 16.1.2 Saudi Arabia
- 16.1.3 South Africa
- 16.1.4 Rest of Middle East and Africa
- 17. Competitive Analysis
- 17.1. Global Market Share Analysis 2024
- 17.2. Company Profiles
- 17.2.1 4 Jinko Solar Holding Co Ltd
- 17.2.1.1. Overview
- 17.2.1.2. Products
- 17.2.1.3. SWOT Analysis
- 17.2.1.4. Recent Developments
- 17.2.1.5. Financials (Based on Availability)
- 17.2.2 2 EDF SA
- 17.2.2.1. Overview
- 17.2.2.2. Products
- 17.2.2.3. SWOT Analysis
- 17.2.2.4. Recent Developments
- 17.2.2.5. Financials (Based on Availability)
- 17.2.3 2 Vestas Wind Systems AS
- 17.2.3.1. Overview
- 17.2.3.2. Products
- 17.2.3.3. SWOT Analysis
- 17.2.3.4. Recent Developments
- 17.2.3.5. Financials (Based on Availability)
- 17.2.4 1 First Solar Inc
- 17.2.4.1. Overview
- 17.2.4.2. Products
- 17.2.4.3. SWOT Analysis
- 17.2.4.4. Recent Developments
- 17.2.4.5. Financials (Based on Availability)
- 17.2.5 5 Berkshire Hathway Energy
- 17.2.5.1. Overview
- 17.2.5.2. Products
- 17.2.5.3. SWOT Analysis
- 17.2.5.4. Recent Developments
- 17.2.5.5. Financials (Based on Availability)
- 17.2.6 Equipment Suppliers
- 17.2.6.1. Overview
- 17.2.6.2. Products
- 17.2.6.3. SWOT Analysis
- 17.2.6.4. Recent Developments
- 17.2.6.5. Financials (Based on Availability)
- 17.2.7 1 Orsted AS
- 17.2.7.1. Overview
- 17.2.7.2. Products
- 17.2.7.3. SWOT Analysis
- 17.2.7.4. Recent Developments
- 17.2.7.5. Financials (Based on Availability)
- 17.2.8 EPC Developers/Operators/Owners
- 17.2.8.1. Overview
- 17.2.8.2. Products
- 17.2.8.3. SWOT Analysis
- 17.2.8.4. Recent Developments
- 17.2.8.5. Financials (Based on Availability)
- 17.2.9 3 Canadian Solar Inc
- 17.2.9.1. Overview
- 17.2.9.2. Products
- 17.2.9.3. SWOT Analysis
- 17.2.9.4. Recent Developments
- 17.2.9.5. Financials (Based on Availability)
- 17.2.10 4 Duke Energy Corporation
- 17.2.10.1. Overview
- 17.2.10.2. Products
- 17.2.10.3. SWOT Analysis
- 17.2.10.4. Recent Developments
- 17.2.10.5. Financials (Based on Availability)
- 17.2.11 6 Acciona Energia SA
- 17.2.11.1. Overview
- 17.2.11.2. Products
- 17.2.11.3. SWOT Analysis
- 17.2.11.4. Recent Developments
- 17.2.11.5. Financials (Based on Availability)
- 17.2.12 3 NextEra Energy Inc
- 17.2.12.1. Overview
- 17.2.12.2. Products
- 17.2.12.3. SWOT Analysis
- 17.2.12.4. Recent Developments
- 17.2.12.5. Financials (Based on Availability)
- 17.2.13 5 General Electric Company
- 17.2.13.1. Overview
- 17.2.13.2. Products
- 17.2.13.3. SWOT Analysis
- 17.2.13.4. Recent Developments
- 17.2.13.5. Financials (Based on Availability)
- 17.2.14 6 Siemens Gamesa Renewable Energy SA*List Not Exhaustive 6 4 Market Ranking/Share (%) Analysi
- 17.2.14.1. Overview
- 17.2.14.2. Products
- 17.2.14.3. SWOT Analysis
- 17.2.14.4. Recent Developments
- 17.2.14.5. Financials (Based on Availability)
- 17.2.1 4 Jinko Solar Holding Co Ltd
List of Figures
- Figure 1: Global Renewable Energy Market Revenue Breakdown (Trillion, %) by Region 2024 & 2032
- Figure 2: Global Renewable Energy Market Volume Breakdown (TW, %) by Region 2024 & 2032
- Figure 3: North America Renewable Energy Market Revenue (Trillion), by Country 2024 & 2032
- Figure 4: North America Renewable Energy Market Volume (TW), by Country 2024 & 2032
- Figure 5: North America Renewable Energy Market Revenue Share (%), by Country 2024 & 2032
- Figure 6: North America Renewable Energy Market Volume Share (%), by Country 2024 & 2032
- Figure 7: Europe Renewable Energy Market Revenue (Trillion), by Country 2024 & 2032
- Figure 8: Europe Renewable Energy Market Volume (TW), by Country 2024 & 2032
- Figure 9: Europe Renewable Energy Market Revenue Share (%), by Country 2024 & 2032
- Figure 10: Europe Renewable Energy Market Volume Share (%), by Country 2024 & 2032
- Figure 11: Asia Pacific Renewable Energy Market Revenue (Trillion), by Country 2024 & 2032
- Figure 12: Asia Pacific Renewable Energy Market Volume (TW), by Country 2024 & 2032
- Figure 13: Asia Pacific Renewable Energy Market Revenue Share (%), by Country 2024 & 2032
- Figure 14: Asia Pacific Renewable Energy Market Volume Share (%), by Country 2024 & 2032
- Figure 15: South America Renewable Energy Market Revenue (Trillion), by Country 2024 & 2032
- Figure 16: South America Renewable Energy Market Volume (TW), by Country 2024 & 2032
- Figure 17: South America Renewable Energy Market Revenue Share (%), by Country 2024 & 2032
- Figure 18: South America Renewable Energy Market Volume Share (%), by Country 2024 & 2032
- Figure 19: North America Renewable Energy Market Revenue (Trillion), by Country 2024 & 2032
- Figure 20: North America Renewable Energy Market Volume (TW), by Country 2024 & 2032
- Figure 21: North America Renewable Energy Market Revenue Share (%), by Country 2024 & 2032
- Figure 22: North America Renewable Energy Market Volume Share (%), by Country 2024 & 2032
- Figure 23: MEA Renewable Energy Market Revenue (Trillion), by Country 2024 & 2032
- Figure 24: MEA Renewable Energy Market Volume (TW), by Country 2024 & 2032
- Figure 25: MEA Renewable Energy Market Revenue Share (%), by Country 2024 & 2032
- Figure 26: MEA Renewable Energy Market Volume Share (%), by Country 2024 & 2032
- Figure 27: North America Renewable Energy Market Revenue (Trillion), by Type 2024 & 2032
- Figure 28: North America Renewable Energy Market Volume (TW), by Type 2024 & 2032
- Figure 29: North America Renewable Energy Market Revenue Share (%), by Type 2024 & 2032
- Figure 30: North America Renewable Energy Market Volume Share (%), by Type 2024 & 2032
- Figure 31: North America Renewable Energy Market Revenue (Trillion), by Country 2024 & 2032
- Figure 32: North America Renewable Energy Market Volume (TW), by Country 2024 & 2032
- Figure 33: North America Renewable Energy Market Revenue Share (%), by Country 2024 & 2032
- Figure 34: North America Renewable Energy Market Volume Share (%), by Country 2024 & 2032
- Figure 35: Europe Renewable Energy Market Revenue (Trillion), by Type 2024 & 2032
- Figure 36: Europe Renewable Energy Market Volume (TW), by Type 2024 & 2032
- Figure 37: Europe Renewable Energy Market Revenue Share (%), by Type 2024 & 2032
- Figure 38: Europe Renewable Energy Market Volume Share (%), by Type 2024 & 2032
- Figure 39: Europe Renewable Energy Market Revenue (Trillion), by Country 2024 & 2032
- Figure 40: Europe Renewable Energy Market Volume (TW), by Country 2024 & 2032
- Figure 41: Europe Renewable Energy Market Revenue Share (%), by Country 2024 & 2032
- Figure 42: Europe Renewable Energy Market Volume Share (%), by Country 2024 & 2032
- Figure 43: Asia Pacific Renewable Energy Market Revenue (Trillion), by Type 2024 & 2032
- Figure 44: Asia Pacific Renewable Energy Market Volume (TW), by Type 2024 & 2032
- Figure 45: Asia Pacific Renewable Energy Market Revenue Share (%), by Type 2024 & 2032
- Figure 46: Asia Pacific Renewable Energy Market Volume Share (%), by Type 2024 & 2032
- Figure 47: Asia Pacific Renewable Energy Market Revenue (Trillion), by Country 2024 & 2032
- Figure 48: Asia Pacific Renewable Energy Market Volume (TW), by Country 2024 & 2032
- Figure 49: Asia Pacific Renewable Energy Market Revenue Share (%), by Country 2024 & 2032
- Figure 50: Asia Pacific Renewable Energy Market Volume Share (%), by Country 2024 & 2032
- Figure 51: Middle East and Africa Renewable Energy Market Revenue (Trillion), by Type 2024 & 2032
- Figure 52: Middle East and Africa Renewable Energy Market Volume (TW), by Type 2024 & 2032
- Figure 53: Middle East and Africa Renewable Energy Market Revenue Share (%), by Type 2024 & 2032
- Figure 54: Middle East and Africa Renewable Energy Market Volume Share (%), by Type 2024 & 2032
- Figure 55: Middle East and Africa Renewable Energy Market Revenue (Trillion), by Country 2024 & 2032
- Figure 56: Middle East and Africa Renewable Energy Market Volume (TW), by Country 2024 & 2032
- Figure 57: Middle East and Africa Renewable Energy Market Revenue Share (%), by Country 2024 & 2032
- Figure 58: Middle East and Africa Renewable Energy Market Volume Share (%), by Country 2024 & 2032
- Figure 59: South America Renewable Energy Market Revenue (Trillion), by Type 2024 & 2032
- Figure 60: South America Renewable Energy Market Volume (TW), by Type 2024 & 2032
- Figure 61: South America Renewable Energy Market Revenue Share (%), by Type 2024 & 2032
- Figure 62: South America Renewable Energy Market Volume Share (%), by Type 2024 & 2032
- Figure 63: South America Renewable Energy Market Revenue (Trillion), by Country 2024 & 2032
- Figure 64: South America Renewable Energy Market Volume (TW), by Country 2024 & 2032
- Figure 65: South America Renewable Energy Market Revenue Share (%), by Country 2024 & 2032
- Figure 66: South America Renewable Energy Market Volume Share (%), by Country 2024 & 2032
List of Tables
- Table 1: Global Renewable Energy Market Revenue Trillion Forecast, by Region 2019 & 2032
- Table 2: Global Renewable Energy Market Volume TW Forecast, by Region 2019 & 2032
- Table 3: Global Renewable Energy Market Revenue Trillion Forecast, by Type 2019 & 2032
- Table 4: Global Renewable Energy Market Volume TW Forecast, by Type 2019 & 2032
- Table 5: Global Renewable Energy Market Revenue Trillion Forecast, by Region 2019 & 2032
- Table 6: Global Renewable Energy Market Volume TW Forecast, by Region 2019 & 2032
- Table 7: Global Renewable Energy Market Revenue Trillion Forecast, by Country 2019 & 2032
- Table 8: Global Renewable Energy Market Volume TW Forecast, by Country 2019 & 2032
- Table 9: United States Renewable Energy Market Revenue (Trillion) Forecast, by Application 2019 & 2032
- Table 10: United States Renewable Energy Market Volume (TW) Forecast, by Application 2019 & 2032
- Table 11: Canada Renewable Energy Market Revenue (Trillion) Forecast, by Application 2019 & 2032
- Table 12: Canada Renewable Energy Market Volume (TW) Forecast, by Application 2019 & 2032
- Table 13: Mexico Renewable Energy Market Revenue (Trillion) Forecast, by Application 2019 & 2032
- Table 14: Mexico Renewable Energy Market Volume (TW) Forecast, by Application 2019 & 2032
- Table 15: Global Renewable Energy Market Revenue Trillion Forecast, by Country 2019 & 2032
- Table 16: Global Renewable Energy Market Volume TW Forecast, by Country 2019 & 2032
- Table 17: Germany Renewable Energy Market Revenue (Trillion) Forecast, by Application 2019 & 2032
- Table 18: Germany Renewable Energy Market Volume (TW) Forecast, by Application 2019 & 2032
- Table 19: United Kingdom Renewable Energy Market Revenue (Trillion) Forecast, by Application 2019 & 2032
- Table 20: United Kingdom Renewable Energy Market Volume (TW) Forecast, by Application 2019 & 2032
- Table 21: France Renewable Energy Market Revenue (Trillion) Forecast, by Application 2019 & 2032
- Table 22: France Renewable Energy Market Volume (TW) Forecast, by Application 2019 & 2032
- Table 23: Spain Renewable Energy Market Revenue (Trillion) Forecast, by Application 2019 & 2032
- Table 24: Spain Renewable Energy Market Volume (TW) Forecast, by Application 2019 & 2032
- Table 25: Italy Renewable Energy Market Revenue (Trillion) Forecast, by Application 2019 & 2032
- Table 26: Italy Renewable Energy Market Volume (TW) Forecast, by Application 2019 & 2032
- Table 27: Spain Renewable Energy Market Revenue (Trillion) Forecast, by Application 2019 & 2032
- Table 28: Spain Renewable Energy Market Volume (TW) Forecast, by Application 2019 & 2032
- Table 29: Belgium Renewable Energy Market Revenue (Trillion) Forecast, by Application 2019 & 2032
- Table 30: Belgium Renewable Energy Market Volume (TW) Forecast, by Application 2019 & 2032
- Table 31: Netherland Renewable Energy Market Revenue (Trillion) Forecast, by Application 2019 & 2032
- Table 32: Netherland Renewable Energy Market Volume (TW) Forecast, by Application 2019 & 2032
- Table 33: Nordics Renewable Energy Market Revenue (Trillion) Forecast, by Application 2019 & 2032
- Table 34: Nordics Renewable Energy Market Volume (TW) Forecast, by Application 2019 & 2032
- Table 35: Rest of Europe Renewable Energy Market Revenue (Trillion) Forecast, by Application 2019 & 2032
- Table 36: Rest of Europe Renewable Energy Market Volume (TW) Forecast, by Application 2019 & 2032
- Table 37: Global Renewable Energy Market Revenue Trillion Forecast, by Country 2019 & 2032
- Table 38: Global Renewable Energy Market Volume TW Forecast, by Country 2019 & 2032
- Table 39: China Renewable Energy Market Revenue (Trillion) Forecast, by Application 2019 & 2032
- Table 40: China Renewable Energy Market Volume (TW) Forecast, by Application 2019 & 2032
- Table 41: Japan Renewable Energy Market Revenue (Trillion) Forecast, by Application 2019 & 2032
- Table 42: Japan Renewable Energy Market Volume (TW) Forecast, by Application 2019 & 2032
- Table 43: India Renewable Energy Market Revenue (Trillion) Forecast, by Application 2019 & 2032
- Table 44: India Renewable Energy Market Volume (TW) Forecast, by Application 2019 & 2032
- Table 45: South Korea Renewable Energy Market Revenue (Trillion) Forecast, by Application 2019 & 2032
- Table 46: South Korea Renewable Energy Market Volume (TW) Forecast, by Application 2019 & 2032
- Table 47: Southeast Asia Renewable Energy Market Revenue (Trillion) Forecast, by Application 2019 & 2032
- Table 48: Southeast Asia Renewable Energy Market Volume (TW) Forecast, by Application 2019 & 2032
- Table 49: Australia Renewable Energy Market Revenue (Trillion) Forecast, by Application 2019 & 2032
- Table 50: Australia Renewable Energy Market Volume (TW) Forecast, by Application 2019 & 2032
- Table 51: Indonesia Renewable Energy Market Revenue (Trillion) Forecast, by Application 2019 & 2032
- Table 52: Indonesia Renewable Energy Market Volume (TW) Forecast, by Application 2019 & 2032
- Table 53: Phillipes Renewable Energy Market Revenue (Trillion) Forecast, by Application 2019 & 2032
- Table 54: Phillipes Renewable Energy Market Volume (TW) Forecast, by Application 2019 & 2032
- Table 55: Singapore Renewable Energy Market Revenue (Trillion) Forecast, by Application 2019 & 2032
- Table 56: Singapore Renewable Energy Market Volume (TW) Forecast, by Application 2019 & 2032
- Table 57: Thailandc Renewable Energy Market Revenue (Trillion) Forecast, by Application 2019 & 2032
- Table 58: Thailandc Renewable Energy Market Volume (TW) Forecast, by Application 2019 & 2032
- Table 59: Rest of Asia Pacific Renewable Energy Market Revenue (Trillion) Forecast, by Application 2019 & 2032
- Table 60: Rest of Asia Pacific Renewable Energy Market Volume (TW) Forecast, by Application 2019 & 2032
- Table 61: Global Renewable Energy Market Revenue Trillion Forecast, by Country 2019 & 2032
- Table 62: Global Renewable Energy Market Volume TW Forecast, by Country 2019 & 2032
- Table 63: Brazil Renewable Energy Market Revenue (Trillion) Forecast, by Application 2019 & 2032
- Table 64: Brazil Renewable Energy Market Volume (TW) Forecast, by Application 2019 & 2032
- Table 65: Argentina Renewable Energy Market Revenue (Trillion) Forecast, by Application 2019 & 2032
- Table 66: Argentina Renewable Energy Market Volume (TW) Forecast, by Application 2019 & 2032
- Table 67: Peru Renewable Energy Market Revenue (Trillion) Forecast, by Application 2019 & 2032
- Table 68: Peru Renewable Energy Market Volume (TW) Forecast, by Application 2019 & 2032
- Table 69: Chile Renewable Energy Market Revenue (Trillion) Forecast, by Application 2019 & 2032
- Table 70: Chile Renewable Energy Market Volume (TW) Forecast, by Application 2019 & 2032
- Table 71: Colombia Renewable Energy Market Revenue (Trillion) Forecast, by Application 2019 & 2032
- Table 72: Colombia Renewable Energy Market Volume (TW) Forecast, by Application 2019 & 2032
- Table 73: Ecuador Renewable Energy Market Revenue (Trillion) Forecast, by Application 2019 & 2032
- Table 74: Ecuador Renewable Energy Market Volume (TW) Forecast, by Application 2019 & 2032
- Table 75: Venezuela Renewable Energy Market Revenue (Trillion) Forecast, by Application 2019 & 2032
- Table 76: Venezuela Renewable Energy Market Volume (TW) Forecast, by Application 2019 & 2032
- Table 77: Rest of South America Renewable Energy Market Revenue (Trillion) Forecast, by Application 2019 & 2032
- Table 78: Rest of South America Renewable Energy Market Volume (TW) Forecast, by Application 2019 & 2032
- Table 79: Global Renewable Energy Market Revenue Trillion Forecast, by Country 2019 & 2032
- Table 80: Global Renewable Energy Market Volume TW Forecast, by Country 2019 & 2032
- Table 81: United States Renewable Energy Market Revenue (Trillion) Forecast, by Application 2019 & 2032
- Table 82: United States Renewable Energy Market Volume (TW) Forecast, by Application 2019 & 2032
- Table 83: Canada Renewable Energy Market Revenue (Trillion) Forecast, by Application 2019 & 2032
- Table 84: Canada Renewable Energy Market Volume (TW) Forecast, by Application 2019 & 2032
- Table 85: Mexico Renewable Energy Market Revenue (Trillion) Forecast, by Application 2019 & 2032
- Table 86: Mexico Renewable Energy Market Volume (TW) Forecast, by Application 2019 & 2032
- Table 87: Global Renewable Energy Market Revenue Trillion Forecast, by Country 2019 & 2032
- Table 88: Global Renewable Energy Market Volume TW Forecast, by Country 2019 & 2032
- Table 89: United Arab Emirates Renewable Energy Market Revenue (Trillion) Forecast, by Application 2019 & 2032
- Table 90: United Arab Emirates Renewable Energy Market Volume (TW) Forecast, by Application 2019 & 2032
- Table 91: Saudi Arabia Renewable Energy Market Revenue (Trillion) Forecast, by Application 2019 & 2032
- Table 92: Saudi Arabia Renewable Energy Market Volume (TW) Forecast, by Application 2019 & 2032
- Table 93: South Africa Renewable Energy Market Revenue (Trillion) Forecast, by Application 2019 & 2032
- Table 94: South Africa Renewable Energy Market Volume (TW) Forecast, by Application 2019 & 2032
- Table 95: Rest of Middle East and Africa Renewable Energy Market Revenue (Trillion) Forecast, by Application 2019 & 2032
- Table 96: Rest of Middle East and Africa Renewable Energy Market Volume (TW) Forecast, by Application 2019 & 2032
- Table 97: Global Renewable Energy Market Revenue Trillion Forecast, by Type 2019 & 2032
- Table 98: Global Renewable Energy Market Volume TW Forecast, by Type 2019 & 2032
- Table 99: Global Renewable Energy Market Revenue Trillion Forecast, by Country 2019 & 2032
- Table 100: Global Renewable Energy Market Volume TW Forecast, by Country 2019 & 2032
- Table 101: United States of America Renewable Energy Market Revenue (Trillion) Forecast, by Application 2019 & 2032
- Table 102: United States of America Renewable Energy Market Volume (TW) Forecast, by Application 2019 & 2032
- Table 103: Canada Renewable Energy Market Revenue (Trillion) Forecast, by Application 2019 & 2032
- Table 104: Canada Renewable Energy Market Volume (TW) Forecast, by Application 2019 & 2032
- Table 105: Rest of the North America Renewable Energy Market Revenue (Trillion) Forecast, by Application 2019 & 2032
- Table 106: Rest of the North America Renewable Energy Market Volume (TW) Forecast, by Application 2019 & 2032
- Table 107: Global Renewable Energy Market Revenue Trillion Forecast, by Type 2019 & 2032
- Table 108: Global Renewable Energy Market Volume TW Forecast, by Type 2019 & 2032
- Table 109: Global Renewable Energy Market Revenue Trillion Forecast, by Country 2019 & 2032
- Table 110: Global Renewable Energy Market Volume TW Forecast, by Country 2019 & 2032
- Table 111: United Kingdom Renewable Energy Market Revenue (Trillion) Forecast, by Application 2019 & 2032
- Table 112: United Kingdom Renewable Energy Market Volume (TW) Forecast, by Application 2019 & 2032
- Table 113: Germany Renewable Energy Market Revenue (Trillion) Forecast, by Application 2019 & 2032
- Table 114: Germany Renewable Energy Market Volume (TW) Forecast, by Application 2019 & 2032
- Table 115: France Renewable Energy Market Revenue (Trillion) Forecast, by Application 2019 & 2032
- Table 116: France Renewable Energy Market Volume (TW) Forecast, by Application 2019 & 2032
- Table 117: Spain Renewable Energy Market Revenue (Trillion) Forecast, by Application 2019 & 2032
- Table 118: Spain Renewable Energy Market Volume (TW) Forecast, by Application 2019 & 2032
- Table 119: NORDIC Renewable Energy Market Revenue (Trillion) Forecast, by Application 2019 & 2032
- Table 120: NORDIC Renewable Energy Market Volume (TW) Forecast, by Application 2019 & 2032
- Table 121: Turkey Renewable Energy Market Revenue (Trillion) Forecast, by Application 2019 & 2032
- Table 122: Turkey Renewable Energy Market Volume (TW) Forecast, by Application 2019 & 2032
- Table 123: Russia Renewable Energy Market Revenue (Trillion) Forecast, by Application 2019 & 2032
- Table 124: Russia Renewable Energy Market Volume (TW) Forecast, by Application 2019 & 2032
- Table 125: Rest of the Europe Renewable Energy Market Revenue (Trillion) Forecast, by Application 2019 & 2032
- Table 126: Rest of the Europe Renewable Energy Market Volume (TW) Forecast, by Application 2019 & 2032
- Table 127: Global Renewable Energy Market Revenue Trillion Forecast, by Type 2019 & 2032
- Table 128: Global Renewable Energy Market Volume TW Forecast, by Type 2019 & 2032
- Table 129: Global Renewable Energy Market Revenue Trillion Forecast, by Country 2019 & 2032
- Table 130: Global Renewable Energy Market Volume TW Forecast, by Country 2019 & 2032
- Table 131: China Renewable Energy Market Revenue (Trillion) Forecast, by Application 2019 & 2032
- Table 132: China Renewable Energy Market Volume (TW) Forecast, by Application 2019 & 2032
- Table 133: India Renewable Energy Market Revenue (Trillion) Forecast, by Application 2019 & 2032
- Table 134: India Renewable Energy Market Volume (TW) Forecast, by Application 2019 & 2032
- Table 135: Japan Renewable Energy Market Revenue (Trillion) Forecast, by Application 2019 & 2032
- Table 136: Japan Renewable Energy Market Volume (TW) Forecast, by Application 2019 & 2032
- Table 137: Malaysia Renewable Energy Market Revenue (Trillion) Forecast, by Application 2019 & 2032
- Table 138: Malaysia Renewable Energy Market Volume (TW) Forecast, by Application 2019 & 2032
- Table 139: Thailand Renewable Energy Market Revenue (Trillion) Forecast, by Application 2019 & 2032
- Table 140: Thailand Renewable Energy Market Volume (TW) Forecast, by Application 2019 & 2032
- Table 141: Indonesia Renewable Energy Market Revenue (Trillion) Forecast, by Application 2019 & 2032
- Table 142: Indonesia Renewable Energy Market Volume (TW) Forecast, by Application 2019 & 2032
- Table 143: Vietnam Renewable Energy Market Revenue (Trillion) Forecast, by Application 2019 & 2032
- Table 144: Vietnam Renewable Energy Market Volume (TW) Forecast, by Application 2019 & 2032
- Table 145: Rest of Asia Pacific Renewable Energy Market Revenue (Trillion) Forecast, by Application 2019 & 2032
- Table 146: Rest of Asia Pacific Renewable Energy Market Volume (TW) Forecast, by Application 2019 & 2032
- Table 147: Global Renewable Energy Market Revenue Trillion Forecast, by Type 2019 & 2032
- Table 148: Global Renewable Energy Market Volume TW Forecast, by Type 2019 & 2032
- Table 149: Global Renewable Energy Market Revenue Trillion Forecast, by Country 2019 & 2032
- Table 150: Global Renewable Energy Market Volume TW Forecast, by Country 2019 & 2032
- Table 151: United Arab Emirates Renewable Energy Market Revenue (Trillion) Forecast, by Application 2019 & 2032
- Table 152: United Arab Emirates Renewable Energy Market Volume (TW) Forecast, by Application 2019 & 2032
- Table 153: Saudi Arabia Renewable Energy Market Revenue (Trillion) Forecast, by Application 2019 & 2032
- Table 154: Saudi Arabia Renewable Energy Market Volume (TW) Forecast, by Application 2019 & 2032
- Table 155: Egypt Renewable Energy Market Revenue (Trillion) Forecast, by Application 2019 & 2032
- Table 156: Egypt Renewable Energy Market Volume (TW) Forecast, by Application 2019 & 2032
- Table 157: Nigeria Renewable Energy Market Revenue (Trillion) Forecast, by Application 2019 & 2032
- Table 158: Nigeria Renewable Energy Market Volume (TW) Forecast, by Application 2019 & 2032
- Table 159: South Africa Renewable Energy Market Revenue (Trillion) Forecast, by Application 2019 & 2032
- Table 160: South Africa Renewable Energy Market Volume (TW) Forecast, by Application 2019 & 2032
- Table 161: Qatar Renewable Energy Market Revenue (Trillion) Forecast, by Application 2019 & 2032
- Table 162: Qatar Renewable Energy Market Volume (TW) Forecast, by Application 2019 & 2032
- Table 163: Rest of the Middle East and Africa Renewable Energy Market Revenue (Trillion) Forecast, by Application 2019 & 2032
- Table 164: Rest of the Middle East and Africa Renewable Energy Market Volume (TW) Forecast, by Application 2019 & 2032
- Table 165: Global Renewable Energy Market Revenue Trillion Forecast, by Type 2019 & 2032
- Table 166: Global Renewable Energy Market Volume TW Forecast, by Type 2019 & 2032
- Table 167: Global Renewable Energy Market Revenue Trillion Forecast, by Country 2019 & 2032
- Table 168: Global Renewable Energy Market Volume TW Forecast, by Country 2019 & 2032
- Table 169: Brazil Renewable Energy Market Revenue (Trillion) Forecast, by Application 2019 & 2032
- Table 170: Brazil Renewable Energy Market Volume (TW) Forecast, by Application 2019 & 2032
- Table 171: Argentina Renewable Energy Market Revenue (Trillion) Forecast, by Application 2019 & 2032
- Table 172: Argentina Renewable Energy Market Volume (TW) Forecast, by Application 2019 & 2032
- Table 173: Colombia Renewable Energy Market Revenue (Trillion) Forecast, by Application 2019 & 2032
- Table 174: Colombia Renewable Energy Market Volume (TW) Forecast, by Application 2019 & 2032
- Table 175: Rest of the South America Renewable Energy Market Revenue (Trillion) Forecast, by Application 2019 & 2032
- Table 176: Rest of the South America Renewable Energy Market Volume (TW) Forecast, by Application 2019 & 2032
Frequently Asked Questions
1. What is the projected Compound Annual Growth Rate (CAGR) of the Renewable Energy Market?
The projected CAGR is approximately 7.09%.
2. Which companies are prominent players in the Renewable Energy Market?
Key companies in the market include 4 Jinko Solar Holding Co Ltd, 2 EDF SA, 2 Vestas Wind Systems AS, 1 First Solar Inc, 5 Berkshire Hathway Energy, Equipment Suppliers, 1 Orsted AS, EPC Developers/Operators/Owners, 3 Canadian Solar Inc, 4 Duke Energy Corporation, 6 Acciona Energia SA, 3 NextEra Energy Inc, 5 General Electric Company, 6 Siemens Gamesa Renewable Energy SA*List Not Exhaustive 6 4 Market Ranking/Share (%) Analysi.
3. What are the main segments of the Renewable Energy Market?
The market segments include Type.
4. Can you provide details about the market size?
The market size is estimated to be USD 1.32 Trillion as of 2022.
5. What are some drivers contributing to market growth?
4.; Favorable Government Policies for Renewable Energy4.; The Declining Price of Solar Panels and Wind Turbine Installations4.; Increasing Investments in Hydropower and Pumped Storage Hydropower Projects4.; Growing Emphasis on Geothermal Energy.
6. What are the notable trends driving market growth?
Hydropower Segment is Expected to Dominate the Market during the Forecast Period.
7. Are there any restraints impacting market growth?
4.; Increasing Penetration of Natural Gas for Power Generation.
8. Can you provide examples of recent developments in the market?
April 2023: ArcelorMittal announced that the company's Brazilian entity, ArcelorMittal Brazil, formed a joint venture with the Brazilian renewable energy company Casa dos Ventos to develop the 554 MW Babilonia wind power project. The project is expected to be developed at a cost of USD 800 million and will be located in the central region of Bahia, northeast Brazil. ArcelorMittal is anticipated to hold a 55% share in the joint venture, and the remaining share will be held by Casa dos Ventos.
9. What pricing options are available for accessing the report?
Pricing options include single-user, multi-user, and enterprise licenses priced at USD 4750, USD 5250, and USD 8750 respectively.
10. Is the market size provided in terms of value or volume?
The market size is provided in terms of value, measured in Trillion and volume, measured in TW.
11. Are there any specific market keywords associated with the report?
Yes, the market keyword associated with the report is "Renewable Energy Market," which aids in identifying and referencing the specific market segment covered.
12. How do I determine which pricing option suits my needs best?
The pricing options vary based on user requirements and access needs. Individual users may opt for single-user licenses, while businesses requiring broader access may choose multi-user or enterprise licenses for cost-effective access to the report.
13. Are there any additional resources or data provided in the Renewable Energy Market report?
While the report offers comprehensive insights, it's advisable to review the specific contents or supplementary materials provided to ascertain if additional resources or data are available.
14. How can I stay updated on further developments or reports in the Renewable Energy Market?
To stay informed about further developments, trends, and reports in the Renewable Energy Market, consider subscribing to industry newsletters, following relevant companies and organizations, or regularly checking reputable industry news sources and publications.
Methodology
Step 1 - Identification of Relevant Samples Size from Population Database


Step 2 - Approaches for Defining Global Market Size (Value, Volume* & Price*)

Note*: In applicable scenarios
Step 3 - Data Sources
Primary Research
- Web Analytics
- Survey Reports
- Research Institute
- Latest Research Reports
- Opinion Leaders
Secondary Research
- Annual Reports
- White Paper
- Latest Press Release
- Industry Association
- Paid Database
- Investor Presentations

Step 4 - Data Triangulation
Involves using different sources of information in order to increase the validity of a study
These sources are likely to be stakeholders in a program - participants, other researchers, program staff, other community members, and so on.
Then we put all data in single framework & apply various statistical tools to find out the dynamic on the market.
During the analysis stage, feedback from the stakeholder groups would be compared to determine areas of agreement as well as areas of divergence


