
Key Insights
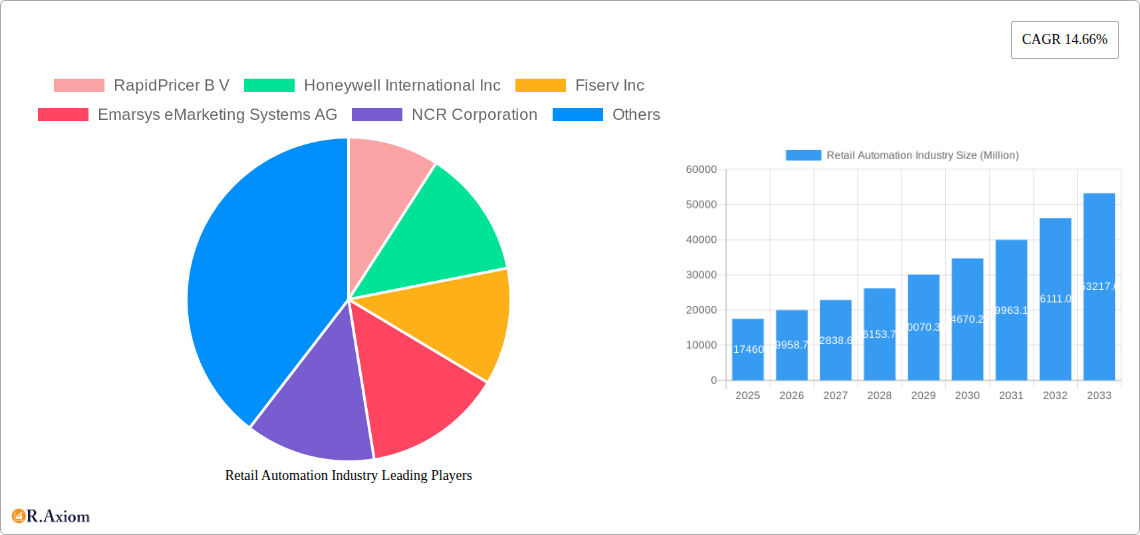
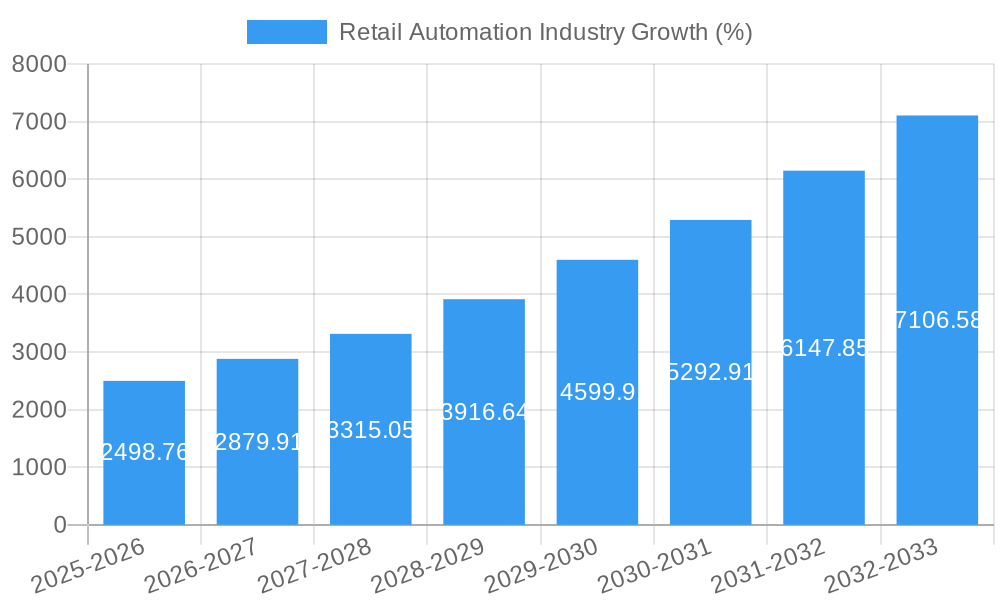
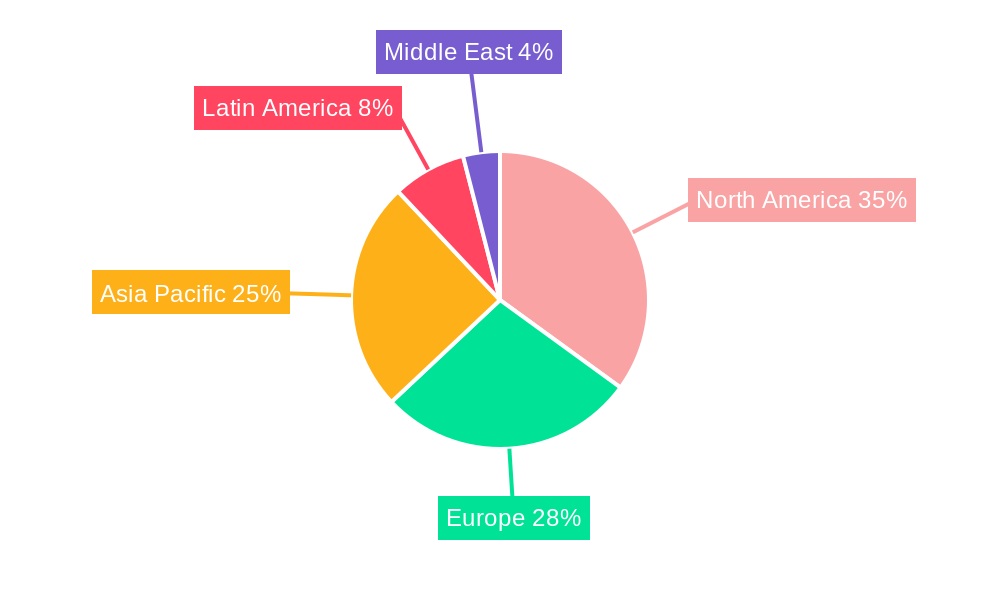
The retail automation market, valued at $17.46 billion in 2025, is experiencing robust growth, projected to expand at a Compound Annual Growth Rate (CAGR) of 14.66% from 2025 to 2033. This expansion is driven by several key factors. The increasing need for efficiency and cost reduction within retail operations is a primary driver, pushing businesses to adopt automation technologies like self-checkout kiosks, inventory management systems, and automated warehousing solutions. Furthermore, the rise of e-commerce and omnichannel strategies necessitates efficient order fulfillment and delivery processes, further fueling demand for retail automation solutions. Growing consumer expectations for faster checkout experiences and personalized services also contribute to this market's growth. The market segmentation reveals significant opportunities across various retail types. Grocery stores are leading adoption, followed by general merchandise and hospitality sectors. Software solutions are gaining traction alongside hardware, reflecting the shift towards integrated and data-driven automation strategies. Key players like RapidPricer, Honeywell, Fiserv, and NCR are actively shaping the market through innovative product offerings and strategic partnerships. Geographic distribution indicates strong growth potential across North America, Europe, and the Asia-Pacific region, driven by varying levels of technological adoption and economic development.
The competitive landscape is characterized by a blend of established technology providers and specialized retail automation companies. Continuous innovation in areas like artificial intelligence (AI), machine learning (ML), and the Internet of Things (IoT) are expected to drive further market expansion. Challenges remain, including high initial investment costs associated with implementing automation technologies and the need for robust integration with existing retail systems. However, the long-term benefits of improved efficiency, reduced labor costs, enhanced customer experience, and better data-driven decision-making are expected to outweigh these challenges, solidifying the continued growth of the retail automation market in the coming years. Further analysis suggests that the increasing focus on supply chain optimization and last-mile delivery solutions will significantly influence market trends in the coming decade.
Retail Automation Industry: A Comprehensive Market Report (2019-2033)
This in-depth report provides a comprehensive analysis of the Retail Automation industry, covering market size, segmentation, key players, growth drivers, challenges, and future opportunities. The study period spans from 2019 to 2033, with 2025 serving as the base and estimated year. The report leverages extensive data analysis and industry insights to deliver actionable intelligence for stakeholders across the value chain. The global market is projected to reach xx Million by 2033.
Retail Automation Industry Market Concentration & Innovation
The Retail Automation industry exhibits a moderately concentrated market structure, with several dominant players holding significant market share. While precise market share figures for each company require further research, Honeywell International Inc, Fiserv Inc, NCR Corporation, and Diebold Nixdorf Incorporated are recognized as major players, each commanding a substantial portion of the market based on revenue and global presence. Smaller companies, such as RapidPricer B V, Emarsys eMarketing Systems AG, Datalogic S p A, Fujitsu Limited, ECR Software Corporation, and Posiflex Technology Inc, contribute to the competitive landscape with specialized solutions and niche market penetration.
- Innovation Drivers: Advancements in AI, IoT, cloud computing, and big data analytics are key drivers. The integration of these technologies is leading to intelligent automation systems that enhance efficiency and customer experience.
- Regulatory Frameworks: Data privacy regulations (GDPR, CCPA) are influencing the design and implementation of retail automation solutions, necessitating robust data security measures.
- Product Substitutes: While fully integrated automation solutions are unique, the potential for modular, individual automation solutions to replace specific aspects of a legacy system poses a competitive challenge.
- End-User Trends: Retailers are increasingly adopting omnichannel strategies, driving demand for integrated automation solutions that streamline operations across physical and digital channels.
- M&A Activities: The industry has witnessed several M&A deals in recent years, with deal values ranging from xx Million to xx Million. These activities often aim to expand product portfolios, enhance technological capabilities, and broaden market reach. Further research is required for specific numbers.
Retail Automation Industry Industry Trends & Insights
The Retail Automation industry is experiencing robust growth, driven by several factors. The global market is projected to register a CAGR of xx% during the forecast period (2025-2033). This growth is primarily fueled by the increasing need for operational efficiency, enhanced customer experience, and data-driven decision-making within the retail sector. Technological disruptions, such as the rise of AI-powered solutions and the expansion of cloud-based platforms, are significantly shaping the industry's trajectory. Retailers are increasingly adopting solutions that offer real-time insights into customer behavior, inventory management, and supply chain optimization. Market penetration of retail automation solutions is steadily increasing across various retail segments, with higher adoption rates observed in developed economies compared to developing ones. This growth is partially hindered by the high initial investment costs associated with implementing comprehensive automation systems. The competitive landscape is dynamic, with established players and emerging startups vying for market share. Strategic partnerships and technological innovations play crucial roles in shaping the competitive dynamics.
Dominant Markets & Segments in Retail Automation Industry
The grocery segment (supermarkets, hypermarkets, convenience stores) is currently the dominant end-user segment in the retail automation market due to the high volume of transactions and the need for efficient inventory management and supply chain optimization. The general merchandise segment is also a significant contributor. The hospitality sector, while smaller, shows strong growth potential driven by the need to enhance operational efficiency and guest experience in hotels and restaurants. The Hardware segment dominates the "By Type" classification due to the significant investment in point-of-sale (POS) systems, inventory tracking devices, and other physical infrastructure. However, the Software segment is exhibiting rapid growth fueled by the increased adoption of cloud-based solutions and AI-powered analytics.
Key Drivers for Dominant Segments:
- Grocery: High transaction volumes, stringent inventory management requirements, and increasing demand for personalized customer experiences.
- General Merchandise: Diverse product categories demanding efficient inventory control and omnichannel integration.
- Hospitality: Focus on enhancing operational efficiency, improving guest experience, and optimizing resource allocation.
- Hardware: Fundamental requirement for physical infrastructure to support automation systems.
- Software: Growing demand for cloud-based, data-driven solutions, AI, and machine learning capabilities.
Geographic Dominance: North America and Europe currently represent the largest regional markets, driven by high technology adoption and strong retail infrastructure. However, Asia-Pacific is poised for significant growth due to increasing e-commerce adoption and investments in retail automation.
Retail Automation Industry Product Developments
Recent product innovations focus on integrating AI, machine learning, and IoT technologies to create more intelligent and efficient automation solutions. These systems offer real-time insights, predictive analytics, and improved customer engagement capabilities. This improves operational efficiency, reduces costs, and enhances the overall customer shopping experience. The competitive advantage lies in the ability to offer seamless integration across various retail operations, providing a comprehensive solution rather than individual components.
Report Scope & Segmentation Analysis
This report segments the retail automation market by type (hardware and software) and end-user (grocery, general merchandise, and hospitality).
By Type: The hardware segment includes POS systems, self-checkout kiosks, inventory management systems, and other related equipment. The software segment includes inventory management software, customer relationship management (CRM) systems, supply chain management (SCM) software, and analytics platforms. The hardware market size is projected at xx Million in 2025, while software is projected at xx Million.
By End-User: The Grocery segment is the largest, followed by General Merchandise and Hospitality. Each segment has unique requirements and growth trajectories. The report offers granular analyses of each segment's competitive dynamics and projected growth.
Key Drivers of Retail Automation Industry Growth
Technological advancements such as AI, machine learning, and IoT are significant growth drivers. Economic factors, including the need for improved operational efficiency and reduced labor costs, also fuel demand. Furthermore, increasing consumer expectations for personalized experiences and seamless omnichannel shopping are pushing retailers to adopt automation solutions. Government initiatives promoting digital transformation in the retail sector further stimulate growth.
Challenges in the Retail Automation Industry Sector
High initial investment costs and the complexity of implementation can be significant barriers to entry. Supply chain disruptions can impact the availability of essential hardware and software components. Furthermore, intense competition among vendors and the need to continuously adapt to evolving technological advancements pose ongoing challenges. The overall impact of these challenges is a slower-than-projected adoption rate in some market segments. Security concerns are increasingly important as more systems use sensitive customer data.
Emerging Opportunities in Retail Automation Industry
The integration of AI and machine learning to provide predictive analytics, hyper-personalization, and improved customer service represents a significant opportunity. Expansion into emerging markets with growing retail sectors presents considerable potential for growth. The development of modular and scalable automation solutions that cater to the specific needs of different retailers offers another pathway.
Leading Players in the Retail Automation Industry Market
- RapidPricer B V
- Honeywell International Inc
- Fiserv Inc
- Emarsys eMarketing Systems AG
- NCR Corporation
- Datalogic S p A
- Fujitsu Limited
- Diebold Nixdorf Incorporated
- ECR Software Corporation
- Posiflex Technology Inc
Key Developments in Retail Automation Industry Industry
- October 2022: Focal Systems partners with Piggly Wiggly Midwest for a trial of its FocalOS, aiming to enhance customer experience through digital automation across various business aspects. This signals growing interest in comprehensive platform solutions.
- February 2022: RetailNext Inc. expands its free traffic system upgrades, addressing the industry's need for affordable modernization of outdated hardware. This highlights the significant cost implications of hardware upgrades.
Strategic Outlook for Retail Automation Industry Market
The Retail Automation industry is poised for sustained growth, driven by continuous technological innovation and increasing adoption across various retail segments. The integration of AI and machine learning will create sophisticated solutions offering predictive capabilities and personalized experiences. The expansion into emerging markets and the development of flexible, modular systems will further fuel market expansion. The ability to effectively manage data security and privacy will be critical for sustained growth and consumer trust.
Retail Automation Industry Segmentation
-
1. Type
-
1.1. Hardware
- 1.1.1. POS System
- 1.1.2. Self -checkout System
- 1.1.3. RFID and Barcode Scanners
- 1.1.4. Other Hardware Types
- 1.2. Software
-
1.1. Hardware
-
2. End-User
- 2.1. Grocery
- 2.2. General
- 2.3. Hospital
Retail Automation Industry Segmentation By Geography
-
1. North America
- 1.1. United States
- 1.2. Canada
-
2. Europe
- 2.1. United Kingdom
- 2.2. Germany
- 2.3. France
-
3. Asia
- 3.1. China
- 3.2. Japan
- 3.3. India
- 4. Australia and New Zealand
- 5. Latin America
- 6. Middle East and Africa
Retail Automation Industry REPORT HIGHLIGHTS
| Aspects | Details |
|---|---|
| Study Period | 2019-2033 |
| Base Year | 2024 |
| Estimated Year | 2025 |
| Forecast Period | 2025-2033 |
| Historical Period | 2019-2024 |
| Growth Rate | CAGR of 14.66% from 2019-2033 |
| Segmentation |
|
Table of Contents
- 1. Introduction
- 1.1. Research Scope
- 1.2. Market Segmentation
- 1.3. Research Methodology
- 1.4. Definitions and Assumptions
- 2. Executive Summary
- 2.1. Introduction
- 3. Market Dynamics
- 3.1. Introduction
- 3.2. Market Drivers
- 3.2.1. Rising Demand for Quality and Fast Service; Growth and Competition among Retail Industry and E -commerce
- 3.3. Market Restrains
- 3.3.1. Slow Adoption of Automated Machine Learning Tools
- 3.4. Market Trends
- 3.4.1. Growth and Competition among Retail Industry and E -commerce
- 4. Market Factor Analysis
- 4.1. Porters Five Forces
- 4.2. Supply/Value Chain
- 4.3. PESTEL analysis
- 4.4. Market Entropy
- 4.5. Patent/Trademark Analysis
- 5. Global Retail Automation Industry Analysis, Insights and Forecast, 2019-2031
- 5.1. Market Analysis, Insights and Forecast - by Type
- 5.1.1. Hardware
- 5.1.1.1. POS System
- 5.1.1.2. Self -checkout System
- 5.1.1.3. RFID and Barcode Scanners
- 5.1.1.4. Other Hardware Types
- 5.1.2. Software
- 5.1.1. Hardware
- 5.2. Market Analysis, Insights and Forecast - by End-User
- 5.2.1. Grocery
- 5.2.2. General
- 5.2.3. Hospital
- 5.3. Market Analysis, Insights and Forecast - by Region
- 5.3.1. North America
- 5.3.2. Europe
- 5.3.3. Asia
- 5.3.4. Australia and New Zealand
- 5.3.5. Latin America
- 5.3.6. Middle East and Africa
- 5.1. Market Analysis, Insights and Forecast - by Type
- 6. North America Retail Automation Industry Analysis, Insights and Forecast, 2019-2031
- 6.1. Market Analysis, Insights and Forecast - by Type
- 6.1.1. Hardware
- 6.1.1.1. POS System
- 6.1.1.2. Self -checkout System
- 6.1.1.3. RFID and Barcode Scanners
- 6.1.1.4. Other Hardware Types
- 6.1.2. Software
- 6.1.1. Hardware
- 6.2. Market Analysis, Insights and Forecast - by End-User
- 6.2.1. Grocery
- 6.2.2. General
- 6.2.3. Hospital
- 6.1. Market Analysis, Insights and Forecast - by Type
- 7. Europe Retail Automation Industry Analysis, Insights and Forecast, 2019-2031
- 7.1. Market Analysis, Insights and Forecast - by Type
- 7.1.1. Hardware
- 7.1.1.1. POS System
- 7.1.1.2. Self -checkout System
- 7.1.1.3. RFID and Barcode Scanners
- 7.1.1.4. Other Hardware Types
- 7.1.2. Software
- 7.1.1. Hardware
- 7.2. Market Analysis, Insights and Forecast - by End-User
- 7.2.1. Grocery
- 7.2.2. General
- 7.2.3. Hospital
- 7.1. Market Analysis, Insights and Forecast - by Type
- 8. Asia Retail Automation Industry Analysis, Insights and Forecast, 2019-2031
- 8.1. Market Analysis, Insights and Forecast - by Type
- 8.1.1. Hardware
- 8.1.1.1. POS System
- 8.1.1.2. Self -checkout System
- 8.1.1.3. RFID and Barcode Scanners
- 8.1.1.4. Other Hardware Types
- 8.1.2. Software
- 8.1.1. Hardware
- 8.2. Market Analysis, Insights and Forecast - by End-User
- 8.2.1. Grocery
- 8.2.2. General
- 8.2.3. Hospital
- 8.1. Market Analysis, Insights and Forecast - by Type
- 9. Australia and New Zealand Retail Automation Industry Analysis, Insights and Forecast, 2019-2031
- 9.1. Market Analysis, Insights and Forecast - by Type
- 9.1.1. Hardware
- 9.1.1.1. POS System
- 9.1.1.2. Self -checkout System
- 9.1.1.3. RFID and Barcode Scanners
- 9.1.1.4. Other Hardware Types
- 9.1.2. Software
- 9.1.1. Hardware
- 9.2. Market Analysis, Insights and Forecast - by End-User
- 9.2.1. Grocery
- 9.2.2. General
- 9.2.3. Hospital
- 9.1. Market Analysis, Insights and Forecast - by Type
- 10. Latin America Retail Automation Industry Analysis, Insights and Forecast, 2019-2031
- 10.1. Market Analysis, Insights and Forecast - by Type
- 10.1.1. Hardware
- 10.1.1.1. POS System
- 10.1.1.2. Self -checkout System
- 10.1.1.3. RFID and Barcode Scanners
- 10.1.1.4. Other Hardware Types
- 10.1.2. Software
- 10.1.1. Hardware
- 10.2. Market Analysis, Insights and Forecast - by End-User
- 10.2.1. Grocery
- 10.2.2. General
- 10.2.3. Hospital
- 10.1. Market Analysis, Insights and Forecast - by Type
- 11. Middle East and Africa Retail Automation Industry Analysis, Insights and Forecast, 2019-2031
- 11.1. Market Analysis, Insights and Forecast - by Type
- 11.1.1. Hardware
- 11.1.1.1. POS System
- 11.1.1.2. Self -checkout System
- 11.1.1.3. RFID and Barcode Scanners
- 11.1.1.4. Other Hardware Types
- 11.1.2. Software
- 11.1.1. Hardware
- 11.2. Market Analysis, Insights and Forecast - by End-User
- 11.2.1. Grocery
- 11.2.2. General
- 11.2.3. Hospital
- 11.1. Market Analysis, Insights and Forecast - by Type
- 12. North America Retail Automation Industry Analysis, Insights and Forecast, 2019-2031
- 12.1. Market Analysis, Insights and Forecast - By Country/Sub-region
- 12.1.1 United States
- 12.1.2 Canada
- 13. Europe Retail Automation Industry Analysis, Insights and Forecast, 2019-2031
- 13.1. Market Analysis, Insights and Forecast - By Country/Sub-region
- 13.1.1 United Kingdom
- 13.1.2 Germany
- 13.1.3 France
- 13.1.4 Rest of Europe
- 14. Asia Pacific Retail Automation Industry Analysis, Insights and Forecast, 2019-2031
- 14.1. Market Analysis, Insights and Forecast - By Country/Sub-region
- 14.1.1 China
- 14.1.2 Japan
- 14.1.3 India
- 14.1.4 Rest of Asia Pacific
- 15. Latin America Retail Automation Industry Analysis, Insights and Forecast, 2019-2031
- 15.1. Market Analysis, Insights and Forecast - By Country/Sub-region
- 15.1.1.
- 16. Middle East Retail Automation Industry Analysis, Insights and Forecast, 2019-2031
- 16.1. Market Analysis, Insights and Forecast - By Country/Sub-region
- 16.1.1.
- 17. Competitive Analysis
- 17.1. Global Market Share Analysis 2024
- 17.2. Company Profiles
- 17.2.1 RapidPricer B V
- 17.2.1.1. Overview
- 17.2.1.2. Products
- 17.2.1.3. SWOT Analysis
- 17.2.1.4. Recent Developments
- 17.2.1.5. Financials (Based on Availability)
- 17.2.2 Honeywell International Inc
- 17.2.2.1. Overview
- 17.2.2.2. Products
- 17.2.2.3. SWOT Analysis
- 17.2.2.4. Recent Developments
- 17.2.2.5. Financials (Based on Availability)
- 17.2.3 Fiserv Inc
- 17.2.3.1. Overview
- 17.2.3.2. Products
- 17.2.3.3. SWOT Analysis
- 17.2.3.4. Recent Developments
- 17.2.3.5. Financials (Based on Availability)
- 17.2.4 Emarsys eMarketing Systems AG
- 17.2.4.1. Overview
- 17.2.4.2. Products
- 17.2.4.3. SWOT Analysis
- 17.2.4.4. Recent Developments
- 17.2.4.5. Financials (Based on Availability)
- 17.2.5 NCR Corporation
- 17.2.5.1. Overview
- 17.2.5.2. Products
- 17.2.5.3. SWOT Analysis
- 17.2.5.4. Recent Developments
- 17.2.5.5. Financials (Based on Availability)
- 17.2.6 Datalogic S p A
- 17.2.6.1. Overview
- 17.2.6.2. Products
- 17.2.6.3. SWOT Analysis
- 17.2.6.4. Recent Developments
- 17.2.6.5. Financials (Based on Availability)
- 17.2.7 Fujitsu Limited
- 17.2.7.1. Overview
- 17.2.7.2. Products
- 17.2.7.3. SWOT Analysis
- 17.2.7.4. Recent Developments
- 17.2.7.5. Financials (Based on Availability)
- 17.2.8 Diebold Nixdorf Incorporated
- 17.2.8.1. Overview
- 17.2.8.2. Products
- 17.2.8.3. SWOT Analysis
- 17.2.8.4. Recent Developments
- 17.2.8.5. Financials (Based on Availability)
- 17.2.9 ECR Software Corporation
- 17.2.9.1. Overview
- 17.2.9.2. Products
- 17.2.9.3. SWOT Analysis
- 17.2.9.4. Recent Developments
- 17.2.9.5. Financials (Based on Availability)
- 17.2.10 Posiflex Technology Inc
- 17.2.10.1. Overview
- 17.2.10.2. Products
- 17.2.10.3. SWOT Analysis
- 17.2.10.4. Recent Developments
- 17.2.10.5. Financials (Based on Availability)
- 17.2.1 RapidPricer B V
List of Figures
- Figure 1: Global Retail Automation Industry Revenue Breakdown (Million, %) by Region 2024 & 2032
- Figure 2: North America Retail Automation Industry Revenue (Million), by Country 2024 & 2032
- Figure 3: North America Retail Automation Industry Revenue Share (%), by Country 2024 & 2032
- Figure 4: Europe Retail Automation Industry Revenue (Million), by Country 2024 & 2032
- Figure 5: Europe Retail Automation Industry Revenue Share (%), by Country 2024 & 2032
- Figure 6: Asia Pacific Retail Automation Industry Revenue (Million), by Country 2024 & 2032
- Figure 7: Asia Pacific Retail Automation Industry Revenue Share (%), by Country 2024 & 2032
- Figure 8: Latin America Retail Automation Industry Revenue (Million), by Country 2024 & 2032
- Figure 9: Latin America Retail Automation Industry Revenue Share (%), by Country 2024 & 2032
- Figure 10: Middle East Retail Automation Industry Revenue (Million), by Country 2024 & 2032
- Figure 11: Middle East Retail Automation Industry Revenue Share (%), by Country 2024 & 2032
- Figure 12: North America Retail Automation Industry Revenue (Million), by Type 2024 & 2032
- Figure 13: North America Retail Automation Industry Revenue Share (%), by Type 2024 & 2032
- Figure 14: North America Retail Automation Industry Revenue (Million), by End-User 2024 & 2032
- Figure 15: North America Retail Automation Industry Revenue Share (%), by End-User 2024 & 2032
- Figure 16: North America Retail Automation Industry Revenue (Million), by Country 2024 & 2032
- Figure 17: North America Retail Automation Industry Revenue Share (%), by Country 2024 & 2032
- Figure 18: Europe Retail Automation Industry Revenue (Million), by Type 2024 & 2032
- Figure 19: Europe Retail Automation Industry Revenue Share (%), by Type 2024 & 2032
- Figure 20: Europe Retail Automation Industry Revenue (Million), by End-User 2024 & 2032
- Figure 21: Europe Retail Automation Industry Revenue Share (%), by End-User 2024 & 2032
- Figure 22: Europe Retail Automation Industry Revenue (Million), by Country 2024 & 2032
- Figure 23: Europe Retail Automation Industry Revenue Share (%), by Country 2024 & 2032
- Figure 24: Asia Retail Automation Industry Revenue (Million), by Type 2024 & 2032
- Figure 25: Asia Retail Automation Industry Revenue Share (%), by Type 2024 & 2032
- Figure 26: Asia Retail Automation Industry Revenue (Million), by End-User 2024 & 2032
- Figure 27: Asia Retail Automation Industry Revenue Share (%), by End-User 2024 & 2032
- Figure 28: Asia Retail Automation Industry Revenue (Million), by Country 2024 & 2032
- Figure 29: Asia Retail Automation Industry Revenue Share (%), by Country 2024 & 2032
- Figure 30: Australia and New Zealand Retail Automation Industry Revenue (Million), by Type 2024 & 2032
- Figure 31: Australia and New Zealand Retail Automation Industry Revenue Share (%), by Type 2024 & 2032
- Figure 32: Australia and New Zealand Retail Automation Industry Revenue (Million), by End-User 2024 & 2032
- Figure 33: Australia and New Zealand Retail Automation Industry Revenue Share (%), by End-User 2024 & 2032
- Figure 34: Australia and New Zealand Retail Automation Industry Revenue (Million), by Country 2024 & 2032
- Figure 35: Australia and New Zealand Retail Automation Industry Revenue Share (%), by Country 2024 & 2032
- Figure 36: Latin America Retail Automation Industry Revenue (Million), by Type 2024 & 2032
- Figure 37: Latin America Retail Automation Industry Revenue Share (%), by Type 2024 & 2032
- Figure 38: Latin America Retail Automation Industry Revenue (Million), by End-User 2024 & 2032
- Figure 39: Latin America Retail Automation Industry Revenue Share (%), by End-User 2024 & 2032
- Figure 40: Latin America Retail Automation Industry Revenue (Million), by Country 2024 & 2032
- Figure 41: Latin America Retail Automation Industry Revenue Share (%), by Country 2024 & 2032
- Figure 42: Middle East and Africa Retail Automation Industry Revenue (Million), by Type 2024 & 2032
- Figure 43: Middle East and Africa Retail Automation Industry Revenue Share (%), by Type 2024 & 2032
- Figure 44: Middle East and Africa Retail Automation Industry Revenue (Million), by End-User 2024 & 2032
- Figure 45: Middle East and Africa Retail Automation Industry Revenue Share (%), by End-User 2024 & 2032
- Figure 46: Middle East and Africa Retail Automation Industry Revenue (Million), by Country 2024 & 2032
- Figure 47: Middle East and Africa Retail Automation Industry Revenue Share (%), by Country 2024 & 2032
List of Tables
- Table 1: Global Retail Automation Industry Revenue Million Forecast, by Region 2019 & 2032
- Table 2: Global Retail Automation Industry Revenue Million Forecast, by Type 2019 & 2032
- Table 3: Global Retail Automation Industry Revenue Million Forecast, by End-User 2019 & 2032
- Table 4: Global Retail Automation Industry Revenue Million Forecast, by Region 2019 & 2032
- Table 5: Global Retail Automation Industry Revenue Million Forecast, by Country 2019 & 2032
- Table 6: United States Retail Automation Industry Revenue (Million) Forecast, by Application 2019 & 2032
- Table 7: Canada Retail Automation Industry Revenue (Million) Forecast, by Application 2019 & 2032
- Table 8: Global Retail Automation Industry Revenue Million Forecast, by Country 2019 & 2032
- Table 9: United Kingdom Retail Automation Industry Revenue (Million) Forecast, by Application 2019 & 2032
- Table 10: Germany Retail Automation Industry Revenue (Million) Forecast, by Application 2019 & 2032
- Table 11: France Retail Automation Industry Revenue (Million) Forecast, by Application 2019 & 2032
- Table 12: Rest of Europe Retail Automation Industry Revenue (Million) Forecast, by Application 2019 & 2032
- Table 13: Global Retail Automation Industry Revenue Million Forecast, by Country 2019 & 2032
- Table 14: China Retail Automation Industry Revenue (Million) Forecast, by Application 2019 & 2032
- Table 15: Japan Retail Automation Industry Revenue (Million) Forecast, by Application 2019 & 2032
- Table 16: India Retail Automation Industry Revenue (Million) Forecast, by Application 2019 & 2032
- Table 17: Rest of Asia Pacific Retail Automation Industry Revenue (Million) Forecast, by Application 2019 & 2032
- Table 18: Global Retail Automation Industry Revenue Million Forecast, by Country 2019 & 2032
- Table 19: Retail Automation Industry Revenue (Million) Forecast, by Application 2019 & 2032
- Table 20: Global Retail Automation Industry Revenue Million Forecast, by Country 2019 & 2032
- Table 21: Retail Automation Industry Revenue (Million) Forecast, by Application 2019 & 2032
- Table 22: Global Retail Automation Industry Revenue Million Forecast, by Type 2019 & 2032
- Table 23: Global Retail Automation Industry Revenue Million Forecast, by End-User 2019 & 2032
- Table 24: Global Retail Automation Industry Revenue Million Forecast, by Country 2019 & 2032
- Table 25: United States Retail Automation Industry Revenue (Million) Forecast, by Application 2019 & 2032
- Table 26: Canada Retail Automation Industry Revenue (Million) Forecast, by Application 2019 & 2032
- Table 27: Global Retail Automation Industry Revenue Million Forecast, by Type 2019 & 2032
- Table 28: Global Retail Automation Industry Revenue Million Forecast, by End-User 2019 & 2032
- Table 29: Global Retail Automation Industry Revenue Million Forecast, by Country 2019 & 2032
- Table 30: United Kingdom Retail Automation Industry Revenue (Million) Forecast, by Application 2019 & 2032
- Table 31: Germany Retail Automation Industry Revenue (Million) Forecast, by Application 2019 & 2032
- Table 32: France Retail Automation Industry Revenue (Million) Forecast, by Application 2019 & 2032
- Table 33: Global Retail Automation Industry Revenue Million Forecast, by Type 2019 & 2032
- Table 34: Global Retail Automation Industry Revenue Million Forecast, by End-User 2019 & 2032
- Table 35: Global Retail Automation Industry Revenue Million Forecast, by Country 2019 & 2032
- Table 36: China Retail Automation Industry Revenue (Million) Forecast, by Application 2019 & 2032
- Table 37: Japan Retail Automation Industry Revenue (Million) Forecast, by Application 2019 & 2032
- Table 38: India Retail Automation Industry Revenue (Million) Forecast, by Application 2019 & 2032
- Table 39: Global Retail Automation Industry Revenue Million Forecast, by Type 2019 & 2032
- Table 40: Global Retail Automation Industry Revenue Million Forecast, by End-User 2019 & 2032
- Table 41: Global Retail Automation Industry Revenue Million Forecast, by Country 2019 & 2032
- Table 42: Global Retail Automation Industry Revenue Million Forecast, by Type 2019 & 2032
- Table 43: Global Retail Automation Industry Revenue Million Forecast, by End-User 2019 & 2032
- Table 44: Global Retail Automation Industry Revenue Million Forecast, by Country 2019 & 2032
- Table 45: Global Retail Automation Industry Revenue Million Forecast, by Type 2019 & 2032
- Table 46: Global Retail Automation Industry Revenue Million Forecast, by End-User 2019 & 2032
- Table 47: Global Retail Automation Industry Revenue Million Forecast, by Country 2019 & 2032
Frequently Asked Questions
1. What is the projected Compound Annual Growth Rate (CAGR) of the Retail Automation Industry?
The projected CAGR is approximately 14.66%.
2. Which companies are prominent players in the Retail Automation Industry?
Key companies in the market include RapidPricer B V, Honeywell International Inc, Fiserv Inc, Emarsys eMarketing Systems AG, NCR Corporation, Datalogic S p A, Fujitsu Limited, Diebold Nixdorf Incorporated, ECR Software Corporation, Posiflex Technology Inc .
3. What are the main segments of the Retail Automation Industry?
The market segments include Type, End-User.
4. Can you provide details about the market size?
The market size is estimated to be USD 17.46 Million as of 2022.
5. What are some drivers contributing to market growth?
Rising Demand for Quality and Fast Service; Growth and Competition among Retail Industry and E -commerce.
6. What are the notable trends driving market growth?
Growth and Competition among Retail Industry and E -commerce.
7. Are there any restraints impacting market growth?
Slow Adoption of Automated Machine Learning Tools.
8. Can you provide examples of recent developments in the market?
October 2022: Focal Systems, a leading retail automation provider, entered into a partnership with Piggly Wiggly Midwest locations. Piggly Wiggly Midwest will be conducting a trial of the Focal Operating System (FocalOS) in its stores across Wisconsin and Illinois. The primary objective of this collaboration is to enhance the customer experience by leveraging FocalOS to digitize and automate various aspects of their business, including ordering, inventory management, merchandising, and in-store personnel management.
9. What pricing options are available for accessing the report?
Pricing options include single-user, multi-user, and enterprise licenses priced at USD 4750, USD 5250, and USD 8750 respectively.
10. Is the market size provided in terms of value or volume?
The market size is provided in terms of value, measured in Million.
11. Are there any specific market keywords associated with the report?
Yes, the market keyword associated with the report is "Retail Automation Industry," which aids in identifying and referencing the specific market segment covered.
12. How do I determine which pricing option suits my needs best?
The pricing options vary based on user requirements and access needs. Individual users may opt for single-user licenses, while businesses requiring broader access may choose multi-user or enterprise licenses for cost-effective access to the report.
13. Are there any additional resources or data provided in the Retail Automation Industry report?
While the report offers comprehensive insights, it's advisable to review the specific contents or supplementary materials provided to ascertain if additional resources or data are available.
14. How can I stay updated on further developments or reports in the Retail Automation Industry?
To stay informed about further developments, trends, and reports in the Retail Automation Industry, consider subscribing to industry newsletters, following relevant companies and organizations, or regularly checking reputable industry news sources and publications.
Methodology
Step 1 - Identification of Relevant Samples Size from Population Database


Step 2 - Approaches for Defining Global Market Size (Value, Volume* & Price*)

Note*: In applicable scenarios
Step 3 - Data Sources
Primary Research
- Web Analytics
- Survey Reports
- Research Institute
- Latest Research Reports
- Opinion Leaders
Secondary Research
- Annual Reports
- White Paper
- Latest Press Release
- Industry Association
- Paid Database
- Investor Presentations

Step 4 - Data Triangulation
Involves using different sources of information in order to increase the validity of a study
These sources are likely to be stakeholders in a program - participants, other researchers, program staff, other community members, and so on.
Then we put all data in single framework & apply various statistical tools to find out the dynamic on the market.
During the analysis stage, feedback from the stakeholder groups would be compared to determine areas of agreement as well as areas of divergence


