
Key Insights
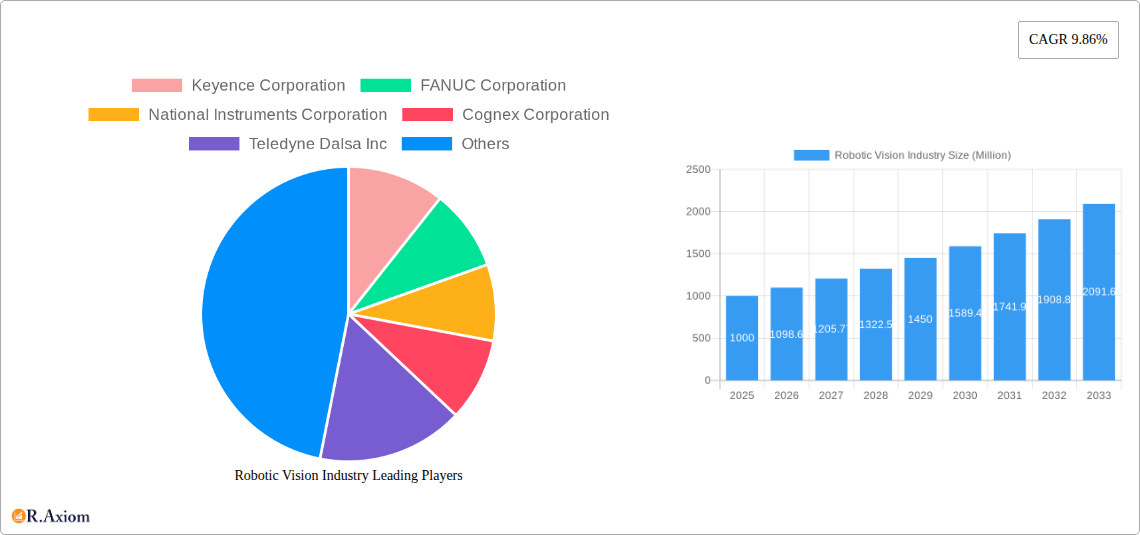
The robotic vision market, valued at approximately $XX million in 2025, is experiencing robust growth, projected to expand at a compound annual growth rate (CAGR) of 9.86% from 2025 to 2033. This expansion is fueled by several key drivers. The increasing automation across various industries, particularly automotive, electronics, and food and beverage, is creating significant demand for precise and efficient vision-guided robots. Advancements in 3D vision technology, offering superior depth perception and object recognition capabilities compared to 2D systems, are further accelerating market growth. Furthermore, the rising adoption of Industry 4.0 principles and the growing need for quality control and process optimization in manufacturing are contributing factors. The market is segmented by technology (2D and 3D vision) and end-user industry (automotive, electronics, aerospace, food and beverage, pharmaceutical, and others). Key players like Keyence, FANUC, Cognex, and others are driving innovation and competition within the market.
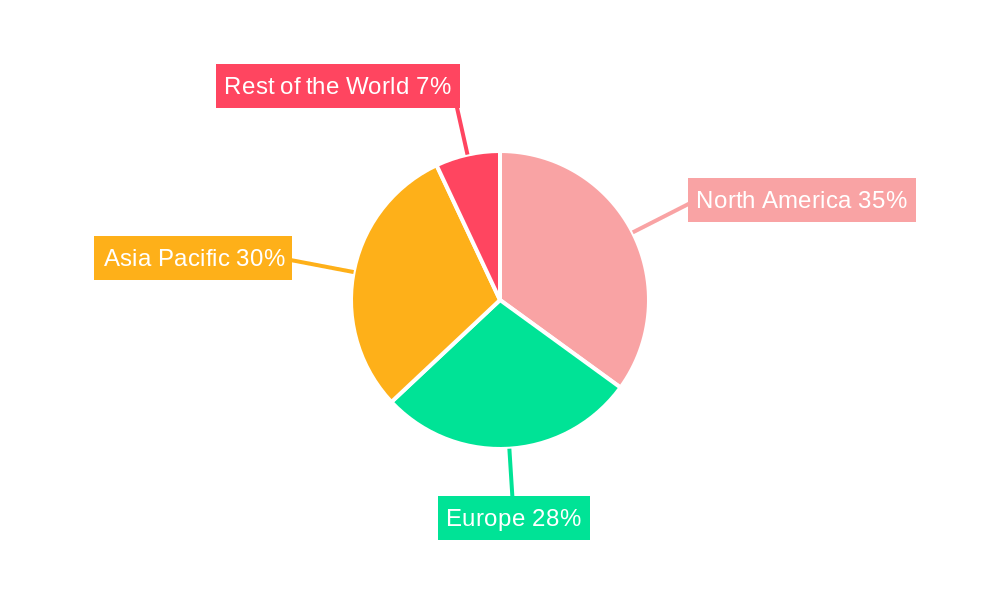
Despite the positive outlook, certain restraints exist. High initial investment costs associated with implementing robotic vision systems can be a barrier to entry for smaller companies. Furthermore, the complexity of integrating these systems into existing manufacturing processes and the need for skilled labor to operate and maintain them present challenges. However, the long-term cost savings achieved through improved efficiency, reduced error rates, and enhanced productivity are expected to outweigh these initial hurdles. The Asia-Pacific region, driven by rapid industrialization and a large manufacturing base, is anticipated to be a major growth driver in the coming years. North America and Europe will also contribute significantly, fueled by ongoing investments in automation and technological advancements. The pharmaceutical and aerospace sectors are expected to show particularly strong growth due to the high precision required in their production processes.
Robotic Vision Industry Market Report: 2019-2033
This comprehensive report provides a detailed analysis of the Robotic Vision Industry, offering invaluable insights for stakeholders, investors, and industry professionals. The report covers market size, segmentation, growth drivers, challenges, and key players, providing a 360-degree view of this rapidly evolving sector. The study period spans from 2019 to 2033, with 2025 serving as both the base and estimated year.
Robotic Vision Industry Market Concentration & Innovation
The Robotic Vision Industry is characterized by a moderately concentrated market structure, with a few dominant players holding significant market share. Keyence Corporation, FANUC Corporation, and Cognex Corporation are among the leading companies, collectively accounting for an estimated xx% of the global market in 2025. However, the market also exhibits substantial innovation, driven by advancements in artificial intelligence (AI), machine learning (ML), and computer vision technologies.
The regulatory landscape varies across different regions, influencing market dynamics. Stringent safety and quality standards in industries like automotive and aerospace necessitate robust and reliable robotic vision systems. The emergence of sophisticated 3D vision systems and the increasing adoption of AI-powered solutions are further fueling innovation. Mergers and acquisitions (M&A) activity has also been significant, with deal values exceeding $xx Million in the past five years, leading to consolidation and enhanced competitive landscape. For instance, ABB's acquisition of ASTI Mobile Robotics signifies the growing importance of integration between robotics and vision systems.
- Market Share (2025 Estimate):
- Keyence Corporation: xx%
- FANUC Corporation: xx%
- Cognex Corporation: xx%
- Others: xx%
- M&A Deal Value (2019-2024): >$xx Million
Robotic Vision Industry Industry Trends & Insights
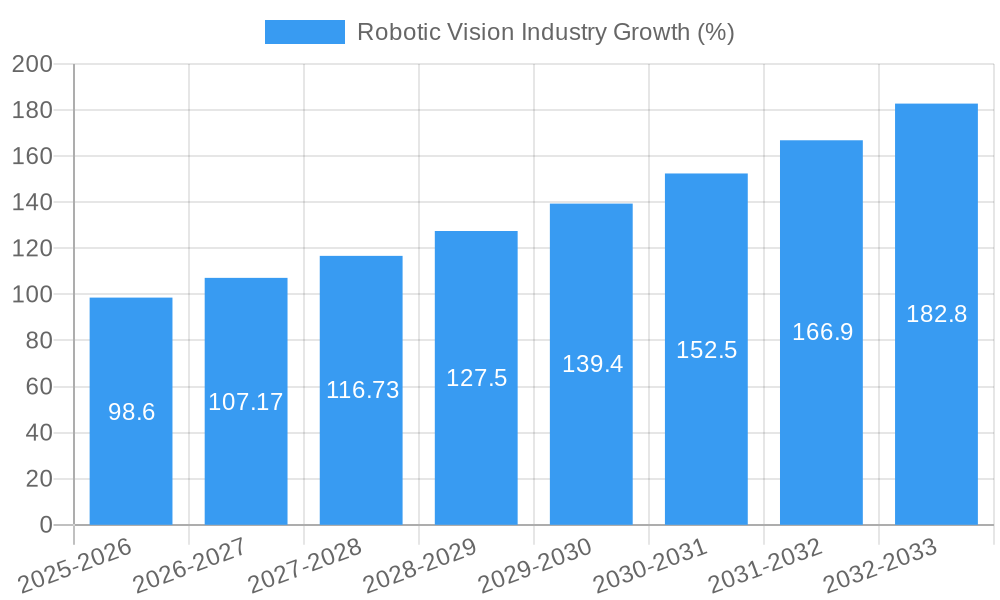
The Robotic Vision Industry is experiencing robust growth, projected to achieve a CAGR of xx% during the forecast period (2025-2033). This growth is propelled by several key factors: the increasing automation across various end-user industries, particularly automotive, electronics, and logistics; advancements in sensor technology leading to improved accuracy and speed; and the rising demand for cost-effective and efficient automation solutions. The market penetration of robotic vision systems is increasing steadily, with a significant portion of new automation projects incorporating these technologies. Technological disruptions, particularly the integration of AI and ML, are revolutionizing the capabilities of robotic vision systems, enabling them to perform more complex tasks and adapt to dynamic environments. Consumer preferences for higher quality and customized products are also contributing to increased demand for advanced automation and robotic vision solutions. The competitive dynamics are intense, with leading players focusing on innovation, strategic partnerships, and expanding product portfolios.
Dominant Markets & Segments in Robotic Vision Industry
The Automotive industry remains the dominant end-user segment for robotic vision systems, driven by the increasing demand for automated manufacturing processes and quality control measures. North America and Asia (particularly China and Japan) are leading regional markets, driven by robust industrial automation adoption rates and supportive government policies.
By Technology:
- 3D Vision: 3D vision is experiencing faster growth than 2D due to its ability to provide more comprehensive data and improve accuracy in complex applications.
- 2D Vision: 2D Vision continues to be a major segment due to its cost-effectiveness and suitability for numerous applications.
By End-User Industry:
- Automotive: High demand for automation in vehicle assembly and quality control.
- Electronics: Automated inspection and quality control in electronics manufacturing.
- Aerospace: Stringent quality requirements drive adoption in aerospace manufacturing.
- Food & Beverage: Automated inspection and quality control in food processing.
- Pharmaceutical: High precision demands in pharmaceutical production.
Key Drivers:
- Automotive: Rising vehicle production, stricter quality standards, and the need for automated assembly lines.
- Electronics: Increasing demand for high-precision components and automated assembly processes.
- Government Policies: Initiatives promoting industrial automation and technological advancements.
- Infrastructure: Development of advanced industrial infrastructure and supporting technologies.
Robotic Vision Industry Product Developments
Recent product innovations focus on enhanced processing speed, improved accuracy, and broader application capabilities. AI-powered algorithms enable robots to process visual data more effectively, and the integration of various sensor types improves the overall robustness of robotic vision systems. This allows for the development of advanced solutions for various tasks, like advanced autonomous vehicles and more sophisticated robotic surgical systems. The market is witnessing a shift toward compact, modular, and easily integrable vision systems that cater to the diverse needs of various industries.
Report Scope & Segmentation Analysis
This report segments the Robotic Vision Industry by technology (2D and 3D vision) and end-user industry (Automotive, Electronics, Aerospace, Food and Beverage, Pharmaceutical, and Other). Growth projections and market sizes for each segment are provided, considering the competitive landscape and market dynamics specific to each area. The competitive dynamics differ across segments due to specific application requirements, technological sophistication levels, and market maturity. The automotive sector, for example, displays higher integration levels compared to other industries.
Key Drivers of Robotic Vision Industry Growth
Technological advancements in AI, ML, and sensor technology are major drivers, enabling more sophisticated and adaptable robotic vision systems. Economic factors, including the ongoing trend towards automation and the need for increased efficiency, are also key contributors. Favorable government policies and initiatives supporting industrial automation further stimulate growth. The increasing demand for higher product quality and reduced operational costs in various end-user industries are driving the adoption of robotic vision systems.
Challenges in the Robotic Vision Industry Sector
High initial investment costs and integration complexities represent significant barriers for many companies. Supply chain disruptions and the availability of skilled labor can also impede growth. Intense competition among established players and new entrants puts pressure on profit margins. Regulatory uncertainties and varying safety standards across different regions pose additional challenges. The overall impact of these factors is an estimated xx% reduction in market growth during the forecast period.
Emerging Opportunities in Robotic Vision Industry
The expanding adoption of robotic vision systems in emerging markets and new application areas presents significant opportunities for growth. Advances in 3D vision technology, AI-powered image processing, and the development of more robust and cost-effective systems are opening new market segments. The increasing demand for automated solutions in the healthcare, agriculture, and logistics sectors offers promising avenues for expansion.
Leading Players in the Robotic Vision Industry Market
- Keyence Corporation
- FANUC Corporation
- National Instruments Corporation
- Cognex Corporation
- Teledyne Dalsa Inc
- Sick AG
- ABB Group
- Qualcomm Technologies Inc
- Hexagon A
- Omron Adept Technology Inc
Key Developments in Robotic Vision Industry Industry
- September 2022: ABB launches its first line of branded Autonomous Mobile Robots (AMRs) following its 2021 acquisition of ASTI Mobile Robotics, showcasing integration of robotics, AMRs, and vision systems.
- August 2022: Visionary.ai and Innoviz partner to combine imaging technology and LiDAR sensors, promising improved 3D machine vision performance for robots and drones.
Strategic Outlook for Robotic Vision Industry Market
The Robotic Vision Industry is poised for continued growth, driven by technological advancements, increasing automation needs, and supportive regulatory environments. The integration of AI and ML will further enhance the capabilities of robotic vision systems, expanding their application range and creating new opportunities. The focus on developing more compact, cost-effective, and user-friendly solutions will broaden market accessibility. The continued expansion into new industries and emerging markets will contribute to robust growth in the years to come.
Robotic Vision Industry Segmentation
-
1. Technology
- 1.1. 2D Vision
- 1.2. 3D Vision
-
2. End User Industry
- 2.1. Automotive
- 2.2. Electronics
- 2.3. Aerospace
- 2.4. Food and Beverage
- 2.5. Pharmaceutical
- 2.6. Other End User Industries
Robotic Vision Industry Segmentation By Geography
- 1. North America
- 2. Europe
- 3. Asia Pacific
- 4. Rest of the World
Robotic Vision Industry REPORT HIGHLIGHTS
| Aspects | Details |
|---|---|
| Study Period | 2019-2033 |
| Base Year | 2024 |
| Estimated Year | 2025 |
| Forecast Period | 2025-2033 |
| Historical Period | 2019-2024 |
| Growth Rate | CAGR of 9.86% from 2019-2033 |
| Segmentation |
|
Table of Contents
- 1. Introduction
- 1.1. Research Scope
- 1.2. Market Segmentation
- 1.3. Research Methodology
- 1.4. Definitions and Assumptions
- 2. Executive Summary
- 2.1. Introduction
- 3. Market Dynamics
- 3.1. Introduction
- 3.2. Market Drivers
- 3.2.1. Increased Adoption of Cognitive Humanoid Robots; Growing Demand from End - User Segments like Automotive Industry
- 3.3. Market Restrains
- 3.3.1. High Investments
- 3.4. Market Trends
- 3.4.1. Growing Demand from End-User Segments like Automotive Industry Drives the Market Growth
- 4. Market Factor Analysis
- 4.1. Porters Five Forces
- 4.2. Supply/Value Chain
- 4.3. PESTEL analysis
- 4.4. Market Entropy
- 4.5. Patent/Trademark Analysis
- 5. Global Robotic Vision Industry Analysis, Insights and Forecast, 2019-2031
- 5.1. Market Analysis, Insights and Forecast - by Technology
- 5.1.1. 2D Vision
- 5.1.2. 3D Vision
- 5.2. Market Analysis, Insights and Forecast - by End User Industry
- 5.2.1. Automotive
- 5.2.2. Electronics
- 5.2.3. Aerospace
- 5.2.4. Food and Beverage
- 5.2.5. Pharmaceutical
- 5.2.6. Other End User Industries
- 5.3. Market Analysis, Insights and Forecast - by Region
- 5.3.1. North America
- 5.3.2. Europe
- 5.3.3. Asia Pacific
- 5.3.4. Rest of the World
- 5.1. Market Analysis, Insights and Forecast - by Technology
- 6. North America Robotic Vision Industry Analysis, Insights and Forecast, 2019-2031
- 6.1. Market Analysis, Insights and Forecast - by Technology
- 6.1.1. 2D Vision
- 6.1.2. 3D Vision
- 6.2. Market Analysis, Insights and Forecast - by End User Industry
- 6.2.1. Automotive
- 6.2.2. Electronics
- 6.2.3. Aerospace
- 6.2.4. Food and Beverage
- 6.2.5. Pharmaceutical
- 6.2.6. Other End User Industries
- 6.1. Market Analysis, Insights and Forecast - by Technology
- 7. Europe Robotic Vision Industry Analysis, Insights and Forecast, 2019-2031
- 7.1. Market Analysis, Insights and Forecast - by Technology
- 7.1.1. 2D Vision
- 7.1.2. 3D Vision
- 7.2. Market Analysis, Insights and Forecast - by End User Industry
- 7.2.1. Automotive
- 7.2.2. Electronics
- 7.2.3. Aerospace
- 7.2.4. Food and Beverage
- 7.2.5. Pharmaceutical
- 7.2.6. Other End User Industries
- 7.1. Market Analysis, Insights and Forecast - by Technology
- 8. Asia Pacific Robotic Vision Industry Analysis, Insights and Forecast, 2019-2031
- 8.1. Market Analysis, Insights and Forecast - by Technology
- 8.1.1. 2D Vision
- 8.1.2. 3D Vision
- 8.2. Market Analysis, Insights and Forecast - by End User Industry
- 8.2.1. Automotive
- 8.2.2. Electronics
- 8.2.3. Aerospace
- 8.2.4. Food and Beverage
- 8.2.5. Pharmaceutical
- 8.2.6. Other End User Industries
- 8.1. Market Analysis, Insights and Forecast - by Technology
- 9. Rest of the World Robotic Vision Industry Analysis, Insights and Forecast, 2019-2031
- 9.1. Market Analysis, Insights and Forecast - by Technology
- 9.1.1. 2D Vision
- 9.1.2. 3D Vision
- 9.2. Market Analysis, Insights and Forecast - by End User Industry
- 9.2.1. Automotive
- 9.2.2. Electronics
- 9.2.3. Aerospace
- 9.2.4. Food and Beverage
- 9.2.5. Pharmaceutical
- 9.2.6. Other End User Industries
- 9.1. Market Analysis, Insights and Forecast - by Technology
- 10. North America Robotic Vision Industry Analysis, Insights and Forecast, 2019-2031
- 10.1. Market Analysis, Insights and Forecast - By Country/Sub-region
- 10.1.1.
- 11. Europe Robotic Vision Industry Analysis, Insights and Forecast, 2019-2031
- 11.1. Market Analysis, Insights and Forecast - By Country/Sub-region
- 11.1.1.
- 12. Asia Pacific Robotic Vision Industry Analysis, Insights and Forecast, 2019-2031
- 12.1. Market Analysis, Insights and Forecast - By Country/Sub-region
- 12.1.1.
- 13. Rest of the World Robotic Vision Industry Analysis, Insights and Forecast, 2019-2031
- 13.1. Market Analysis, Insights and Forecast - By Country/Sub-region
- 13.1.1.
- 14. Competitive Analysis
- 14.1. Global Market Share Analysis 2024
- 14.2. Company Profiles
- 14.2.1 Keyence Corporation
- 14.2.1.1. Overview
- 14.2.1.2. Products
- 14.2.1.3. SWOT Analysis
- 14.2.1.4. Recent Developments
- 14.2.1.5. Financials (Based on Availability)
- 14.2.2 FANUC Corporation
- 14.2.2.1. Overview
- 14.2.2.2. Products
- 14.2.2.3. SWOT Analysis
- 14.2.2.4. Recent Developments
- 14.2.2.5. Financials (Based on Availability)
- 14.2.3 National Instruments Corporation
- 14.2.3.1. Overview
- 14.2.3.2. Products
- 14.2.3.3. SWOT Analysis
- 14.2.3.4. Recent Developments
- 14.2.3.5. Financials (Based on Availability)
- 14.2.4 Cognex Corporation
- 14.2.4.1. Overview
- 14.2.4.2. Products
- 14.2.4.3. SWOT Analysis
- 14.2.4.4. Recent Developments
- 14.2.4.5. Financials (Based on Availability)
- 14.2.5 Teledyne Dalsa Inc
- 14.2.5.1. Overview
- 14.2.5.2. Products
- 14.2.5.3. SWOT Analysis
- 14.2.5.4. Recent Developments
- 14.2.5.5. Financials (Based on Availability)
- 14.2.6 Sick AG
- 14.2.6.1. Overview
- 14.2.6.2. Products
- 14.2.6.3. SWOT Analysis
- 14.2.6.4. Recent Developments
- 14.2.6.5. Financials (Based on Availability)
- 14.2.7 ABB Group
- 14.2.7.1. Overview
- 14.2.7.2. Products
- 14.2.7.3. SWOT Analysis
- 14.2.7.4. Recent Developments
- 14.2.7.5. Financials (Based on Availability)
- 14.2.8 Qualcomm Technologies Inc
- 14.2.8.1. Overview
- 14.2.8.2. Products
- 14.2.8.3. SWOT Analysis
- 14.2.8.4. Recent Developments
- 14.2.8.5. Financials (Based on Availability)
- 14.2.9 Hexagon A
- 14.2.9.1. Overview
- 14.2.9.2. Products
- 14.2.9.3. SWOT Analysis
- 14.2.9.4. Recent Developments
- 14.2.9.5. Financials (Based on Availability)
- 14.2.10 Omron Adept Technology Inc
- 14.2.10.1. Overview
- 14.2.10.2. Products
- 14.2.10.3. SWOT Analysis
- 14.2.10.4. Recent Developments
- 14.2.10.5. Financials (Based on Availability)
- 14.2.1 Keyence Corporation
List of Figures
- Figure 1: Global Robotic Vision Industry Revenue Breakdown (Million, %) by Region 2024 & 2032
- Figure 2: North America Robotic Vision Industry Revenue (Million), by Country 2024 & 2032
- Figure 3: North America Robotic Vision Industry Revenue Share (%), by Country 2024 & 2032
- Figure 4: Europe Robotic Vision Industry Revenue (Million), by Country 2024 & 2032
- Figure 5: Europe Robotic Vision Industry Revenue Share (%), by Country 2024 & 2032
- Figure 6: Asia Pacific Robotic Vision Industry Revenue (Million), by Country 2024 & 2032
- Figure 7: Asia Pacific Robotic Vision Industry Revenue Share (%), by Country 2024 & 2032
- Figure 8: Rest of the World Robotic Vision Industry Revenue (Million), by Country 2024 & 2032
- Figure 9: Rest of the World Robotic Vision Industry Revenue Share (%), by Country 2024 & 2032
- Figure 10: North America Robotic Vision Industry Revenue (Million), by Technology 2024 & 2032
- Figure 11: North America Robotic Vision Industry Revenue Share (%), by Technology 2024 & 2032
- Figure 12: North America Robotic Vision Industry Revenue (Million), by End User Industry 2024 & 2032
- Figure 13: North America Robotic Vision Industry Revenue Share (%), by End User Industry 2024 & 2032
- Figure 14: North America Robotic Vision Industry Revenue (Million), by Country 2024 & 2032
- Figure 15: North America Robotic Vision Industry Revenue Share (%), by Country 2024 & 2032
- Figure 16: Europe Robotic Vision Industry Revenue (Million), by Technology 2024 & 2032
- Figure 17: Europe Robotic Vision Industry Revenue Share (%), by Technology 2024 & 2032
- Figure 18: Europe Robotic Vision Industry Revenue (Million), by End User Industry 2024 & 2032
- Figure 19: Europe Robotic Vision Industry Revenue Share (%), by End User Industry 2024 & 2032
- Figure 20: Europe Robotic Vision Industry Revenue (Million), by Country 2024 & 2032
- Figure 21: Europe Robotic Vision Industry Revenue Share (%), by Country 2024 & 2032
- Figure 22: Asia Pacific Robotic Vision Industry Revenue (Million), by Technology 2024 & 2032
- Figure 23: Asia Pacific Robotic Vision Industry Revenue Share (%), by Technology 2024 & 2032
- Figure 24: Asia Pacific Robotic Vision Industry Revenue (Million), by End User Industry 2024 & 2032
- Figure 25: Asia Pacific Robotic Vision Industry Revenue Share (%), by End User Industry 2024 & 2032
- Figure 26: Asia Pacific Robotic Vision Industry Revenue (Million), by Country 2024 & 2032
- Figure 27: Asia Pacific Robotic Vision Industry Revenue Share (%), by Country 2024 & 2032
- Figure 28: Rest of the World Robotic Vision Industry Revenue (Million), by Technology 2024 & 2032
- Figure 29: Rest of the World Robotic Vision Industry Revenue Share (%), by Technology 2024 & 2032
- Figure 30: Rest of the World Robotic Vision Industry Revenue (Million), by End User Industry 2024 & 2032
- Figure 31: Rest of the World Robotic Vision Industry Revenue Share (%), by End User Industry 2024 & 2032
- Figure 32: Rest of the World Robotic Vision Industry Revenue (Million), by Country 2024 & 2032
- Figure 33: Rest of the World Robotic Vision Industry Revenue Share (%), by Country 2024 & 2032
List of Tables
- Table 1: Global Robotic Vision Industry Revenue Million Forecast, by Region 2019 & 2032
- Table 2: Global Robotic Vision Industry Revenue Million Forecast, by Technology 2019 & 2032
- Table 3: Global Robotic Vision Industry Revenue Million Forecast, by End User Industry 2019 & 2032
- Table 4: Global Robotic Vision Industry Revenue Million Forecast, by Region 2019 & 2032
- Table 5: Global Robotic Vision Industry Revenue Million Forecast, by Country 2019 & 2032
- Table 6: Robotic Vision Industry Revenue (Million) Forecast, by Application 2019 & 2032
- Table 7: Global Robotic Vision Industry Revenue Million Forecast, by Country 2019 & 2032
- Table 8: Robotic Vision Industry Revenue (Million) Forecast, by Application 2019 & 2032
- Table 9: Global Robotic Vision Industry Revenue Million Forecast, by Country 2019 & 2032
- Table 10: Robotic Vision Industry Revenue (Million) Forecast, by Application 2019 & 2032
- Table 11: Global Robotic Vision Industry Revenue Million Forecast, by Country 2019 & 2032
- Table 12: Robotic Vision Industry Revenue (Million) Forecast, by Application 2019 & 2032
- Table 13: Global Robotic Vision Industry Revenue Million Forecast, by Technology 2019 & 2032
- Table 14: Global Robotic Vision Industry Revenue Million Forecast, by End User Industry 2019 & 2032
- Table 15: Global Robotic Vision Industry Revenue Million Forecast, by Country 2019 & 2032
- Table 16: Global Robotic Vision Industry Revenue Million Forecast, by Technology 2019 & 2032
- Table 17: Global Robotic Vision Industry Revenue Million Forecast, by End User Industry 2019 & 2032
- Table 18: Global Robotic Vision Industry Revenue Million Forecast, by Country 2019 & 2032
- Table 19: Global Robotic Vision Industry Revenue Million Forecast, by Technology 2019 & 2032
- Table 20: Global Robotic Vision Industry Revenue Million Forecast, by End User Industry 2019 & 2032
- Table 21: Global Robotic Vision Industry Revenue Million Forecast, by Country 2019 & 2032
- Table 22: Global Robotic Vision Industry Revenue Million Forecast, by Technology 2019 & 2032
- Table 23: Global Robotic Vision Industry Revenue Million Forecast, by End User Industry 2019 & 2032
- Table 24: Global Robotic Vision Industry Revenue Million Forecast, by Country 2019 & 2032
Frequently Asked Questions
1. What is the projected Compound Annual Growth Rate (CAGR) of the Robotic Vision Industry?
The projected CAGR is approximately 9.86%.
2. Which companies are prominent players in the Robotic Vision Industry?
Key companies in the market include Keyence Corporation, FANUC Corporation, National Instruments Corporation, Cognex Corporation, Teledyne Dalsa Inc, Sick AG, ABB Group, Qualcomm Technologies Inc, Hexagon A, Omron Adept Technology Inc.
3. What are the main segments of the Robotic Vision Industry?
The market segments include Technology, End User Industry.
4. Can you provide details about the market size?
The market size is estimated to be USD XX Million as of 2022.
5. What are some drivers contributing to market growth?
Increased Adoption of Cognitive Humanoid Robots; Growing Demand from End - User Segments like Automotive Industry.
6. What are the notable trends driving market growth?
Growing Demand from End-User Segments like Automotive Industry Drives the Market Growth.
7. Are there any restraints impacting market growth?
High Investments.
8. Can you provide examples of recent developments in the market?
September 2022 - Following the 2021 acquisition of mobile robot company ASTI Mobile Robotics, ABB has launched its first line of branded Autonomous Mobile Robots (AMRs). ABB has a fully integrated offering of robots, AMRs, and machine automation solutions. ABB, which already provides AMR solutions for client projects, has collaborated with crucial partner Expert Technology Group in the UK to develop a complete assembly line based on AMRs for a technology startup creating breakthrough parts for EV vehicle drive trains. ABB's automation system uses ABB robots, vision function packages, and AMRs to transport products between robotic automation cells and human assembly stations.
9. What pricing options are available for accessing the report?
Pricing options include single-user, multi-user, and enterprise licenses priced at USD 4750, USD 5250, and USD 8750 respectively.
10. Is the market size provided in terms of value or volume?
The market size is provided in terms of value, measured in Million.
11. Are there any specific market keywords associated with the report?
Yes, the market keyword associated with the report is "Robotic Vision Industry," which aids in identifying and referencing the specific market segment covered.
12. How do I determine which pricing option suits my needs best?
The pricing options vary based on user requirements and access needs. Individual users may opt for single-user licenses, while businesses requiring broader access may choose multi-user or enterprise licenses for cost-effective access to the report.
13. Are there any additional resources or data provided in the Robotic Vision Industry report?
While the report offers comprehensive insights, it's advisable to review the specific contents or supplementary materials provided to ascertain if additional resources or data are available.
14. How can I stay updated on further developments or reports in the Robotic Vision Industry?
To stay informed about further developments, trends, and reports in the Robotic Vision Industry, consider subscribing to industry newsletters, following relevant companies and organizations, or regularly checking reputable industry news sources and publications.
Methodology
Step 1 - Identification of Relevant Samples Size from Population Database


Step 2 - Approaches for Defining Global Market Size (Value, Volume* & Price*)

Note*: In applicable scenarios
Step 3 - Data Sources
Primary Research
- Web Analytics
- Survey Reports
- Research Institute
- Latest Research Reports
- Opinion Leaders
Secondary Research
- Annual Reports
- White Paper
- Latest Press Release
- Industry Association
- Paid Database
- Investor Presentations

Step 4 - Data Triangulation
Involves using different sources of information in order to increase the validity of a study
These sources are likely to be stakeholders in a program - participants, other researchers, program staff, other community members, and so on.
Then we put all data in single framework & apply various statistical tools to find out the dynamic on the market.
During the analysis stage, feedback from the stakeholder groups would be compared to determine areas of agreement as well as areas of divergence


