
Key Insights
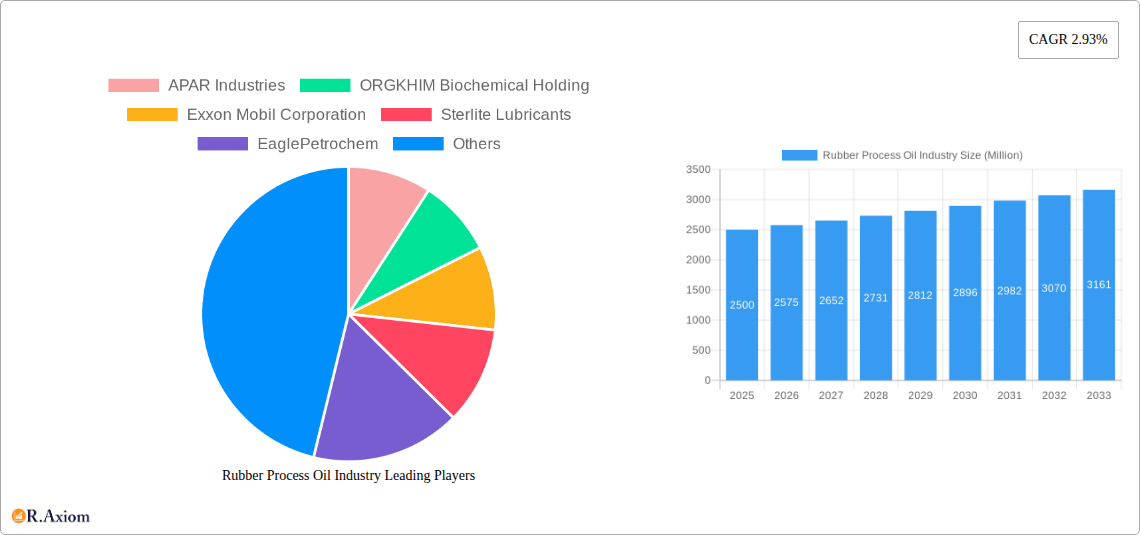
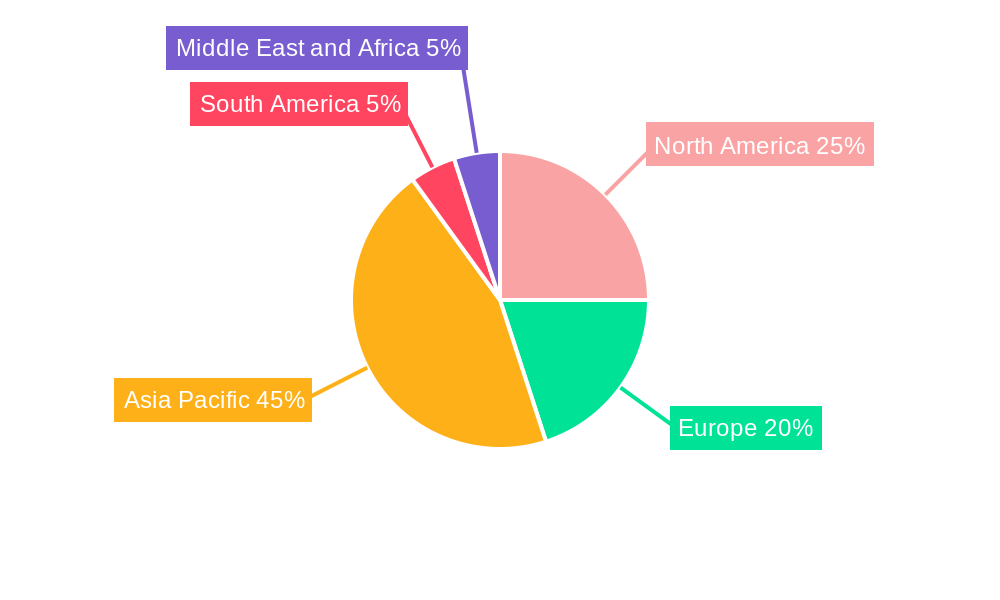
The global rubber process oil (RPO) market, valued at approximately $XX million in 2025, is projected to experience steady growth, driven by the expanding tire and automotive industries, particularly in developing economies like China and India. The market's Compound Annual Growth Rate (CAGR) of 2.93% from 2019 to 2024 suggests a continued, albeit moderate, expansion throughout the forecast period (2025-2033). Key growth drivers include increasing vehicle production, rising demand for high-performance tires, and the growing popularity of rubber-based consumer goods. The market is segmented by product type (aromatic, paraffinic, naphthenic) and application (tires & automotive, footwear, consumer goods, other), with the tire and automotive segment dominating market share due to its significant consumption of RPOs in tire manufacturing. While the market faces restraints such as fluctuating crude oil prices and environmental concerns regarding the production and disposal of certain RPO types, ongoing innovation in RPO formulations—focusing on improved performance, reduced environmental impact and cost efficiency—is expected to mitigate these challenges. Major players like ExxonMobil, Repsol, and TotalEnergies are investing in R&D and strategic partnerships to maintain their market positions and capitalize on emerging opportunities within specialized applications and regional markets. The Asia-Pacific region, fueled by strong industrial growth in China and India, is expected to remain the largest market for RPOs, followed by North America and Europe.
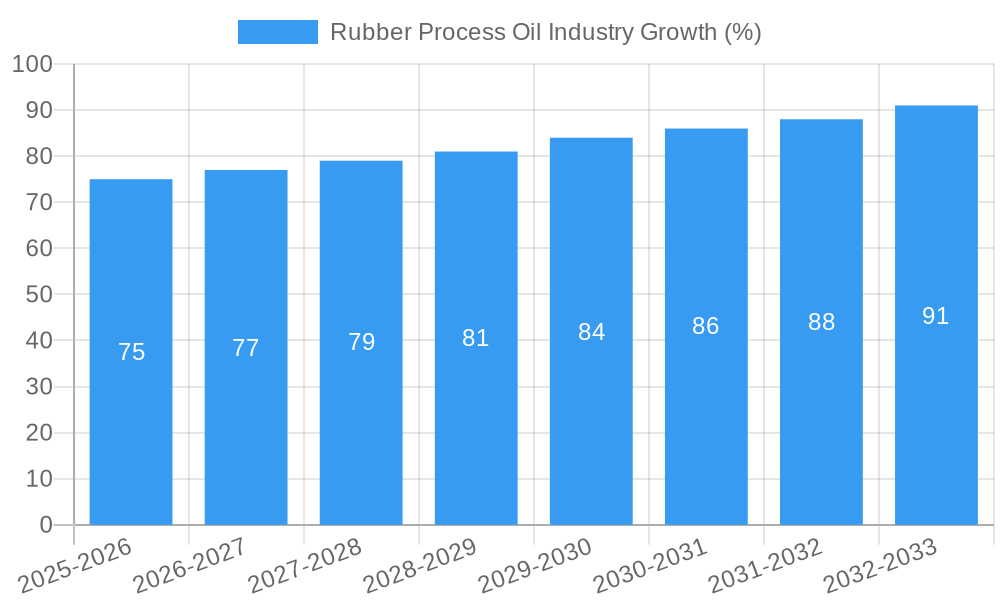
The forecast period (2025-2033) anticipates a continued upward trend in RPO demand, primarily due to the projected growth in vehicle production, particularly in emerging markets. However, the growth rate is anticipated to remain moderate, influenced by the global economic conditions and the potential adoption of alternative materials in certain applications. The increasing focus on sustainability within the rubber industry may also drive the adoption of more environmentally friendly RPO types. Competition amongst existing players will continue to intensify, with an emphasis on product differentiation, cost optimization, and strategic supply chain management. The market will likely see further consolidation through mergers and acquisitions as companies strive to enhance their market share and achieve economies of scale. Specialized applications, such as high-performance tires and advanced rubber composites, will present lucrative opportunities for growth in the coming years.
Rubber Process Oil Industry: A Comprehensive Market Analysis (2019-2033)
This detailed report provides a comprehensive analysis of the global Rubber Process Oil (RPO) industry, offering invaluable insights for stakeholders seeking to navigate this dynamic market. The study period covers 2019-2033, with 2025 as the base and estimated year. The report meticulously examines market trends, competitive landscapes, and future growth prospects, incorporating data from key players like APAR Industries, ORGKHIM Biochemical Holding, Exxon Mobil Corporation, Sterlite Lubricants, EaglePetrochem, Repsol, LODHA Petro, Chevron Corporation, Witmans Industries Pvt Ltd, TotalEnergies, HF Sinclair Corporation, Panama Petrochem Ltd, and CPC Corporation. The report's findings are presented through detailed market segmentation by product type (Aromatic, Paraffinic, Naphthenic) and application (Tire and Automobile Components, Footwear, Consumer Goods, Other Applications), enabling a granular understanding of market dynamics. The report projects a total market value exceeding xx Million by 2033.
Rubber Process Oil Industry Market Concentration & Innovation
The Rubber Process Oil industry exhibits a moderately concentrated market structure, with a few major players commanding significant market share. ExxonMobil and other large integrated oil companies hold substantial positions due to their economies of scale and established distribution networks. However, smaller, specialized producers are also active, particularly in regional markets. Market concentration is further influenced by M&A activities, with several deals valued at over xx Million recorded in the historical period (2019-2024). Innovation is driven by:
- Regulatory pressures: Stringent environmental regulations are prompting the development of more sustainable RPOs with reduced environmental impact.
- Technological advancements: Improvements in refining processes lead to higher-quality, specialized RPOs tailored to specific applications.
- End-user demands: The need for enhanced performance characteristics in end products (e.g., tires with improved fuel efficiency) is stimulating innovation.
The competitive landscape is characterized by both price competition and differentiation based on product quality and specialized applications. The report analyzes the market share of key players, illustrating the competitive dynamics and identifying potential future shifts in market power.
Rubber Process Oil Industry Industry Trends & Insights
The global Rubber Process Oil market is experiencing robust growth, driven by several key factors. The rising demand for tires and automotive components, particularly in developing economies, is a major contributor. This growth is further fueled by expanding applications in footwear, consumer goods, and other industries. The Compound Annual Growth Rate (CAGR) for the forecast period (2025-2033) is estimated at xx%, indicating a significant market expansion. Technological disruptions, such as the development of more efficient and sustainable production processes, and evolving consumer preferences towards eco-friendly products are shaping industry dynamics. Market penetration varies significantly across geographic regions and application segments, with mature markets in North America and Europe showing steady growth, while developing economies in Asia and Latin America are experiencing faster expansion. The competitive dynamics are intense, with major players engaged in continuous innovation, capacity expansion, and strategic partnerships to maintain their market position.
Dominant Markets & Segments in Rubber Process Oil Industry
The Asia-Pacific region dominates the global Rubber Process Oil market, driven by rapid industrialization, a burgeoning automotive sector, and significant growth in the tire industry. China and India are key contributors to this dominance.
Key Drivers in Asia-Pacific:
- Rapid economic growth and rising disposable incomes.
- Expanding automotive and tire manufacturing capacities.
- Government initiatives promoting infrastructure development.
Dominant Segments:
- Product Type: The aromatic segment holds the largest market share due to its wide applicability and cost-effectiveness. However, the demand for paraffinic and naphthenic RPOs is expected to grow, driven by their superior performance characteristics in specific applications.
- Application: The tire and automobile components segment constitutes the largest application area, followed by footwear and consumer goods.
Within the Asia-Pacific region, specific countries are exhibiting disproportionately high growth rates based on unique factors affecting their industrial expansion, infrastructure developments, and government policies promoting manufacturing. Detailed regional and national analyses are provided within the report, including specific economic data, infrastructure investments, and regulatory frameworks.
Rubber Process Oil Industry Product Developments
Recent product developments focus on enhancing the performance characteristics of RPOs, such as improving processability, extending the lifespan of end products, and reducing the environmental impact. This involves formulating RPOs with tailored properties for specific applications and exploring bio-based alternatives to reduce reliance on petroleum-derived raw materials. Manufacturers are increasingly emphasizing the sustainability aspects of their products, aligning with growing environmental concerns. These developments aim to provide a competitive advantage in a market increasingly driven by product differentiation.
Report Scope & Segmentation Analysis
This report segments the Rubber Process Oil market by product type (Aromatic, Paraffinic, Naphthenic) and application (Tire and Automobile Components, Footwear, Consumer Goods, Other Applications). Each segment’s market size, growth projections, and competitive dynamics are meticulously analyzed. Aromatic RPOs currently dominate the market due to their widespread applicability and cost-effectiveness, but paraffinic and naphthenic segments are exhibiting faster growth, driven by their superior performance in high-value applications. The tire and automobile component segment remains the primary application, but other sectors like footwear and consumer goods are showcasing growing demand. The report provides detailed forecasts for each segment, considering various factors affecting their respective growth trajectories.
Key Drivers of Rubber Process Oil Industry Growth
The growth of the Rubber Process Oil industry is fueled by several key factors:
- Expanding automotive industry: The global rise in vehicle production and sales directly correlates with increased demand for RPOs in tire manufacturing.
- Growth of the tire industry: The increasing demand for tires, both passenger and commercial, is a significant driver.
- Infrastructure development: Investments in infrastructure globally contribute to higher demand for construction materials, many of which rely on RPOs.
- Technological advancements: Innovations in RPO formulation enhance their performance and expand their applications.
Challenges in the Rubber Process Oil Industry Sector
The Rubber Process Oil industry faces several challenges:
- Fluctuating crude oil prices: RPO production is intrinsically linked to crude oil prices, creating price volatility.
- Stringent environmental regulations: Meeting increasingly strict environmental standards adds to production costs.
- Intense competition: The presence of numerous players leads to price competition and pressure on profit margins.
- Supply chain disruptions: Global events can significantly impact the availability of raw materials and cause supply chain bottlenecks. These factors can lead to production delays and increased costs.
Emerging Opportunities in Rubber Process Oil Industry
Significant opportunities exist for growth within the Rubber Process Oil industry. These include:
- Development of bio-based RPOs: Growing environmental consciousness opens avenues for sustainable alternatives.
- Expansion into new applications: RPOs find increasing use in diverse applications such as adhesives and sealants.
- Focus on high-performance RPOs: The demand for specialized RPOs with superior properties is increasing, allowing for premium pricing.
- Growth in emerging markets: Developing economies present significant untapped potential for expansion.
Leading Players in the Rubber Process Oil Industry Market
- APAR Industries
- ORGKHIM Biochemical Holding
- Exxon Mobil Corporation
- Sterlite Lubricants
- EaglePetrochem
- Repsol
- LODHA Petro
- Chevron Corporation
- Witmans Industries Pvt Ltd
- TotalEnergies
- HF Sinclair Corporation
- Panama Petrochem Ltd
- CPC Corporation
Key Developments in Rubber Process Oil Industry Industry
- January 2023: ExxonMobil announces a significant investment in expanding its RPO production capacity.
- June 2022: Repsol launches a new line of sustainable RPOs.
- October 2021: A major merger occurs between two mid-sized RPO producers. (Specific details within the full report).
- (Further key developments with dates and impact analysis are included in the full report.)
Strategic Outlook for Rubber Process Oil Industry Market
The future of the Rubber Process Oil industry looks promising, driven by sustained growth in the automotive and tire sectors, increasing demand for sustainable alternatives, and expansion into new application areas. Technological advancements will play a crucial role in shaping the market, with a focus on improving product performance, sustainability, and cost-effectiveness. Companies that embrace innovation, invest in sustainable practices, and effectively manage supply chain challenges are expected to thrive in this dynamic market. The market is poised for continued expansion, particularly in emerging economies, presenting lucrative opportunities for both established players and new entrants.
Rubber Process Oil Industry Segmentation
-
1. Product Type
- 1.1. Aromatic
- 1.2. Paraffinic
- 1.3. Naphthenic
-
2. Application
- 2.1. Tire and Automobile Components
- 2.2. Footwear
- 2.3. Consumer Goods
- 2.4. Other Applications
Rubber Process Oil Industry Segmentation By Geography
-
1. Asia Pacific
- 1.1. China
- 1.2. India
- 1.3. Japan
- 1.4. South Korea
- 1.5. Rest of Asia Pacific
-
2. North America
- 2.1. United States
- 2.2. Canada
- 2.3. Mexico
-
3. Europe
- 3.1. Germany
- 3.2. United Kingdom
- 3.3. France
- 3.4. Italy
- 3.5. Rest of Europe
-
4. South America
- 4.1. Brazil
- 4.2. Argentina
- 4.3. Rest of South America
-
5. Middle East and Africa
- 5.1. Saudi Arabia
- 5.2. South Africa
- 5.3. Rest of Middle East and Africa
Rubber Process Oil Industry REPORT HIGHLIGHTS
| Aspects | Details |
|---|---|
| Study Period | 2019-2033 |
| Base Year | 2024 |
| Estimated Year | 2025 |
| Forecast Period | 2025-2033 |
| Historical Period | 2019-2024 |
| Growth Rate | CAGR of 2.93% from 2019-2033 |
| Segmentation |
|
Table of Contents
- 1. Introduction
- 1.1. Research Scope
- 1.2. Market Segmentation
- 1.3. Research Methodology
- 1.4. Definitions and Assumptions
- 2. Executive Summary
- 2.1. Introduction
- 3. Market Dynamics
- 3.1. Introduction
- 3.2. Market Drivers
- 3.2.1. Increasing Demand for Tire and Automotive Components; Growing Demand for Footwear; Others
- 3.3. Market Restrains
- 3.3.1. Volatility in Raw Material Price; Other Restraints
- 3.4. Market Trends
- 3.4.1. Growing Demand of Rubber Process Oil from Tire and Automobile Components
- 4. Market Factor Analysis
- 4.1. Porters Five Forces
- 4.2. Supply/Value Chain
- 4.3. PESTEL analysis
- 4.4. Market Entropy
- 4.5. Patent/Trademark Analysis
- 5. Global Rubber Process Oil Industry Analysis, Insights and Forecast, 2019-2031
- 5.1. Market Analysis, Insights and Forecast - by Product Type
- 5.1.1. Aromatic
- 5.1.2. Paraffinic
- 5.1.3. Naphthenic
- 5.2. Market Analysis, Insights and Forecast - by Application
- 5.2.1. Tire and Automobile Components
- 5.2.2. Footwear
- 5.2.3. Consumer Goods
- 5.2.4. Other Applications
- 5.3. Market Analysis, Insights and Forecast - by Region
- 5.3.1. Asia Pacific
- 5.3.2. North America
- 5.3.3. Europe
- 5.3.4. South America
- 5.3.5. Middle East and Africa
- 5.1. Market Analysis, Insights and Forecast - by Product Type
- 6. Asia Pacific Rubber Process Oil Industry Analysis, Insights and Forecast, 2019-2031
- 6.1. Market Analysis, Insights and Forecast - by Product Type
- 6.1.1. Aromatic
- 6.1.2. Paraffinic
- 6.1.3. Naphthenic
- 6.2. Market Analysis, Insights and Forecast - by Application
- 6.2.1. Tire and Automobile Components
- 6.2.2. Footwear
- 6.2.3. Consumer Goods
- 6.2.4. Other Applications
- 6.1. Market Analysis, Insights and Forecast - by Product Type
- 7. North America Rubber Process Oil Industry Analysis, Insights and Forecast, 2019-2031
- 7.1. Market Analysis, Insights and Forecast - by Product Type
- 7.1.1. Aromatic
- 7.1.2. Paraffinic
- 7.1.3. Naphthenic
- 7.2. Market Analysis, Insights and Forecast - by Application
- 7.2.1. Tire and Automobile Components
- 7.2.2. Footwear
- 7.2.3. Consumer Goods
- 7.2.4. Other Applications
- 7.1. Market Analysis, Insights and Forecast - by Product Type
- 8. Europe Rubber Process Oil Industry Analysis, Insights and Forecast, 2019-2031
- 8.1. Market Analysis, Insights and Forecast - by Product Type
- 8.1.1. Aromatic
- 8.1.2. Paraffinic
- 8.1.3. Naphthenic
- 8.2. Market Analysis, Insights and Forecast - by Application
- 8.2.1. Tire and Automobile Components
- 8.2.2. Footwear
- 8.2.3. Consumer Goods
- 8.2.4. Other Applications
- 8.1. Market Analysis, Insights and Forecast - by Product Type
- 9. South America Rubber Process Oil Industry Analysis, Insights and Forecast, 2019-2031
- 9.1. Market Analysis, Insights and Forecast - by Product Type
- 9.1.1. Aromatic
- 9.1.2. Paraffinic
- 9.1.3. Naphthenic
- 9.2. Market Analysis, Insights and Forecast - by Application
- 9.2.1. Tire and Automobile Components
- 9.2.2. Footwear
- 9.2.3. Consumer Goods
- 9.2.4. Other Applications
- 9.1. Market Analysis, Insights and Forecast - by Product Type
- 10. Middle East and Africa Rubber Process Oil Industry Analysis, Insights and Forecast, 2019-2031
- 10.1. Market Analysis, Insights and Forecast - by Product Type
- 10.1.1. Aromatic
- 10.1.2. Paraffinic
- 10.1.3. Naphthenic
- 10.2. Market Analysis, Insights and Forecast - by Application
- 10.2.1. Tire and Automobile Components
- 10.2.2. Footwear
- 10.2.3. Consumer Goods
- 10.2.4. Other Applications
- 10.1. Market Analysis, Insights and Forecast - by Product Type
- 11. Asia Pacific Rubber Process Oil Industry Analysis, Insights and Forecast, 2019-2031
- 11.1. Market Analysis, Insights and Forecast - By Country/Sub-region
- 11.1.1 China
- 11.1.2 India
- 11.1.3 Japan
- 11.1.4 South Korea
- 11.1.5 Rest of Asia Pacific
- 12. North America Rubber Process Oil Industry Analysis, Insights and Forecast, 2019-2031
- 12.1. Market Analysis, Insights and Forecast - By Country/Sub-region
- 12.1.1 United States
- 12.1.2 Canada
- 12.1.3 Mexico
- 13. Europe Rubber Process Oil Industry Analysis, Insights and Forecast, 2019-2031
- 13.1. Market Analysis, Insights and Forecast - By Country/Sub-region
- 13.1.1 Germany
- 13.1.2 United Kingdom
- 13.1.3 France
- 13.1.4 Italy
- 13.1.5 Rest of Europe
- 14. South America Rubber Process Oil Industry Analysis, Insights and Forecast, 2019-2031
- 14.1. Market Analysis, Insights and Forecast - By Country/Sub-region
- 14.1.1 Brazil
- 14.1.2 Argentina
- 14.1.3 Rest of South America
- 15. Middle East and Africa Rubber Process Oil Industry Analysis, Insights and Forecast, 2019-2031
- 15.1. Market Analysis, Insights and Forecast - By Country/Sub-region
- 15.1.1 Saudi Arabia
- 15.1.2 South Africa
- 15.1.3 Rest of Middle East and Africa
- 16. Competitive Analysis
- 16.1. Global Market Share Analysis 2024
- 16.2. Company Profiles
- 16.2.1 APAR Industries
- 16.2.1.1. Overview
- 16.2.1.2. Products
- 16.2.1.3. SWOT Analysis
- 16.2.1.4. Recent Developments
- 16.2.1.5. Financials (Based on Availability)
- 16.2.2 ORGKHIM Biochemical Holding
- 16.2.2.1. Overview
- 16.2.2.2. Products
- 16.2.2.3. SWOT Analysis
- 16.2.2.4. Recent Developments
- 16.2.2.5. Financials (Based on Availability)
- 16.2.3 Exxon Mobil Corporation
- 16.2.3.1. Overview
- 16.2.3.2. Products
- 16.2.3.3. SWOT Analysis
- 16.2.3.4. Recent Developments
- 16.2.3.5. Financials (Based on Availability)
- 16.2.4 Sterlite Lubricants
- 16.2.4.1. Overview
- 16.2.4.2. Products
- 16.2.4.3. SWOT Analysis
- 16.2.4.4. Recent Developments
- 16.2.4.5. Financials (Based on Availability)
- 16.2.5 EaglePetrochem
- 16.2.5.1. Overview
- 16.2.5.2. Products
- 16.2.5.3. SWOT Analysis
- 16.2.5.4. Recent Developments
- 16.2.5.5. Financials (Based on Availability)
- 16.2.6 Repsol
- 16.2.6.1. Overview
- 16.2.6.2. Products
- 16.2.6.3. SWOT Analysis
- 16.2.6.4. Recent Developments
- 16.2.6.5. Financials (Based on Availability)
- 16.2.7 LODHA Petro
- 16.2.7.1. Overview
- 16.2.7.2. Products
- 16.2.7.3. SWOT Analysis
- 16.2.7.4. Recent Developments
- 16.2.7.5. Financials (Based on Availability)
- 16.2.8 Chevron Corporation
- 16.2.8.1. Overview
- 16.2.8.2. Products
- 16.2.8.3. SWOT Analysis
- 16.2.8.4. Recent Developments
- 16.2.8.5. Financials (Based on Availability)
- 16.2.9 Witmans Industries Pvt Ltd*List Not Exhaustive
- 16.2.9.1. Overview
- 16.2.9.2. Products
- 16.2.9.3. SWOT Analysis
- 16.2.9.4. Recent Developments
- 16.2.9.5. Financials (Based on Availability)
- 16.2.10 TotalEnergies
- 16.2.10.1. Overview
- 16.2.10.2. Products
- 16.2.10.3. SWOT Analysis
- 16.2.10.4. Recent Developments
- 16.2.10.5. Financials (Based on Availability)
- 16.2.11 HF Sinclair Corporation
- 16.2.11.1. Overview
- 16.2.11.2. Products
- 16.2.11.3. SWOT Analysis
- 16.2.11.4. Recent Developments
- 16.2.11.5. Financials (Based on Availability)
- 16.2.12 Panama Petrochem Ltd
- 16.2.12.1. Overview
- 16.2.12.2. Products
- 16.2.12.3. SWOT Analysis
- 16.2.12.4. Recent Developments
- 16.2.12.5. Financials (Based on Availability)
- 16.2.13 CPC Corporation
- 16.2.13.1. Overview
- 16.2.13.2. Products
- 16.2.13.3. SWOT Analysis
- 16.2.13.4. Recent Developments
- 16.2.13.5. Financials (Based on Availability)
- 16.2.1 APAR Industries
List of Figures
- Figure 1: Global Rubber Process Oil Industry Revenue Breakdown (Million, %) by Region 2024 & 2032
- Figure 2: Global Rubber Process Oil Industry Volume Breakdown (Million, %) by Region 2024 & 2032
- Figure 3: Asia Pacific Rubber Process Oil Industry Revenue (Million), by Country 2024 & 2032
- Figure 4: Asia Pacific Rubber Process Oil Industry Volume (Million), by Country 2024 & 2032
- Figure 5: Asia Pacific Rubber Process Oil Industry Revenue Share (%), by Country 2024 & 2032
- Figure 6: Asia Pacific Rubber Process Oil Industry Volume Share (%), by Country 2024 & 2032
- Figure 7: North America Rubber Process Oil Industry Revenue (Million), by Country 2024 & 2032
- Figure 8: North America Rubber Process Oil Industry Volume (Million), by Country 2024 & 2032
- Figure 9: North America Rubber Process Oil Industry Revenue Share (%), by Country 2024 & 2032
- Figure 10: North America Rubber Process Oil Industry Volume Share (%), by Country 2024 & 2032
- Figure 11: Europe Rubber Process Oil Industry Revenue (Million), by Country 2024 & 2032
- Figure 12: Europe Rubber Process Oil Industry Volume (Million), by Country 2024 & 2032
- Figure 13: Europe Rubber Process Oil Industry Revenue Share (%), by Country 2024 & 2032
- Figure 14: Europe Rubber Process Oil Industry Volume Share (%), by Country 2024 & 2032
- Figure 15: South America Rubber Process Oil Industry Revenue (Million), by Country 2024 & 2032
- Figure 16: South America Rubber Process Oil Industry Volume (Million), by Country 2024 & 2032
- Figure 17: South America Rubber Process Oil Industry Revenue Share (%), by Country 2024 & 2032
- Figure 18: South America Rubber Process Oil Industry Volume Share (%), by Country 2024 & 2032
- Figure 19: Middle East and Africa Rubber Process Oil Industry Revenue (Million), by Country 2024 & 2032
- Figure 20: Middle East and Africa Rubber Process Oil Industry Volume (Million), by Country 2024 & 2032
- Figure 21: Middle East and Africa Rubber Process Oil Industry Revenue Share (%), by Country 2024 & 2032
- Figure 22: Middle East and Africa Rubber Process Oil Industry Volume Share (%), by Country 2024 & 2032
- Figure 23: Asia Pacific Rubber Process Oil Industry Revenue (Million), by Product Type 2024 & 2032
- Figure 24: Asia Pacific Rubber Process Oil Industry Volume (Million), by Product Type 2024 & 2032
- Figure 25: Asia Pacific Rubber Process Oil Industry Revenue Share (%), by Product Type 2024 & 2032
- Figure 26: Asia Pacific Rubber Process Oil Industry Volume Share (%), by Product Type 2024 & 2032
- Figure 27: Asia Pacific Rubber Process Oil Industry Revenue (Million), by Application 2024 & 2032
- Figure 28: Asia Pacific Rubber Process Oil Industry Volume (Million), by Application 2024 & 2032
- Figure 29: Asia Pacific Rubber Process Oil Industry Revenue Share (%), by Application 2024 & 2032
- Figure 30: Asia Pacific Rubber Process Oil Industry Volume Share (%), by Application 2024 & 2032
- Figure 31: Asia Pacific Rubber Process Oil Industry Revenue (Million), by Country 2024 & 2032
- Figure 32: Asia Pacific Rubber Process Oil Industry Volume (Million), by Country 2024 & 2032
- Figure 33: Asia Pacific Rubber Process Oil Industry Revenue Share (%), by Country 2024 & 2032
- Figure 34: Asia Pacific Rubber Process Oil Industry Volume Share (%), by Country 2024 & 2032
- Figure 35: North America Rubber Process Oil Industry Revenue (Million), by Product Type 2024 & 2032
- Figure 36: North America Rubber Process Oil Industry Volume (Million), by Product Type 2024 & 2032
- Figure 37: North America Rubber Process Oil Industry Revenue Share (%), by Product Type 2024 & 2032
- Figure 38: North America Rubber Process Oil Industry Volume Share (%), by Product Type 2024 & 2032
- Figure 39: North America Rubber Process Oil Industry Revenue (Million), by Application 2024 & 2032
- Figure 40: North America Rubber Process Oil Industry Volume (Million), by Application 2024 & 2032
- Figure 41: North America Rubber Process Oil Industry Revenue Share (%), by Application 2024 & 2032
- Figure 42: North America Rubber Process Oil Industry Volume Share (%), by Application 2024 & 2032
- Figure 43: North America Rubber Process Oil Industry Revenue (Million), by Country 2024 & 2032
- Figure 44: North America Rubber Process Oil Industry Volume (Million), by Country 2024 & 2032
- Figure 45: North America Rubber Process Oil Industry Revenue Share (%), by Country 2024 & 2032
- Figure 46: North America Rubber Process Oil Industry Volume Share (%), by Country 2024 & 2032
- Figure 47: Europe Rubber Process Oil Industry Revenue (Million), by Product Type 2024 & 2032
- Figure 48: Europe Rubber Process Oil Industry Volume (Million), by Product Type 2024 & 2032
- Figure 49: Europe Rubber Process Oil Industry Revenue Share (%), by Product Type 2024 & 2032
- Figure 50: Europe Rubber Process Oil Industry Volume Share (%), by Product Type 2024 & 2032
- Figure 51: Europe Rubber Process Oil Industry Revenue (Million), by Application 2024 & 2032
- Figure 52: Europe Rubber Process Oil Industry Volume (Million), by Application 2024 & 2032
- Figure 53: Europe Rubber Process Oil Industry Revenue Share (%), by Application 2024 & 2032
- Figure 54: Europe Rubber Process Oil Industry Volume Share (%), by Application 2024 & 2032
- Figure 55: Europe Rubber Process Oil Industry Revenue (Million), by Country 2024 & 2032
- Figure 56: Europe Rubber Process Oil Industry Volume (Million), by Country 2024 & 2032
- Figure 57: Europe Rubber Process Oil Industry Revenue Share (%), by Country 2024 & 2032
- Figure 58: Europe Rubber Process Oil Industry Volume Share (%), by Country 2024 & 2032
- Figure 59: South America Rubber Process Oil Industry Revenue (Million), by Product Type 2024 & 2032
- Figure 60: South America Rubber Process Oil Industry Volume (Million), by Product Type 2024 & 2032
- Figure 61: South America Rubber Process Oil Industry Revenue Share (%), by Product Type 2024 & 2032
- Figure 62: South America Rubber Process Oil Industry Volume Share (%), by Product Type 2024 & 2032
- Figure 63: South America Rubber Process Oil Industry Revenue (Million), by Application 2024 & 2032
- Figure 64: South America Rubber Process Oil Industry Volume (Million), by Application 2024 & 2032
- Figure 65: South America Rubber Process Oil Industry Revenue Share (%), by Application 2024 & 2032
- Figure 66: South America Rubber Process Oil Industry Volume Share (%), by Application 2024 & 2032
- Figure 67: South America Rubber Process Oil Industry Revenue (Million), by Country 2024 & 2032
- Figure 68: South America Rubber Process Oil Industry Volume (Million), by Country 2024 & 2032
- Figure 69: South America Rubber Process Oil Industry Revenue Share (%), by Country 2024 & 2032
- Figure 70: South America Rubber Process Oil Industry Volume Share (%), by Country 2024 & 2032
- Figure 71: Middle East and Africa Rubber Process Oil Industry Revenue (Million), by Product Type 2024 & 2032
- Figure 72: Middle East and Africa Rubber Process Oil Industry Volume (Million), by Product Type 2024 & 2032
- Figure 73: Middle East and Africa Rubber Process Oil Industry Revenue Share (%), by Product Type 2024 & 2032
- Figure 74: Middle East and Africa Rubber Process Oil Industry Volume Share (%), by Product Type 2024 & 2032
- Figure 75: Middle East and Africa Rubber Process Oil Industry Revenue (Million), by Application 2024 & 2032
- Figure 76: Middle East and Africa Rubber Process Oil Industry Volume (Million), by Application 2024 & 2032
- Figure 77: Middle East and Africa Rubber Process Oil Industry Revenue Share (%), by Application 2024 & 2032
- Figure 78: Middle East and Africa Rubber Process Oil Industry Volume Share (%), by Application 2024 & 2032
- Figure 79: Middle East and Africa Rubber Process Oil Industry Revenue (Million), by Country 2024 & 2032
- Figure 80: Middle East and Africa Rubber Process Oil Industry Volume (Million), by Country 2024 & 2032
- Figure 81: Middle East and Africa Rubber Process Oil Industry Revenue Share (%), by Country 2024 & 2032
- Figure 82: Middle East and Africa Rubber Process Oil Industry Volume Share (%), by Country 2024 & 2032
List of Tables
- Table 1: Global Rubber Process Oil Industry Revenue Million Forecast, by Region 2019 & 2032
- Table 2: Global Rubber Process Oil Industry Volume Million Forecast, by Region 2019 & 2032
- Table 3: Global Rubber Process Oil Industry Revenue Million Forecast, by Product Type 2019 & 2032
- Table 4: Global Rubber Process Oil Industry Volume Million Forecast, by Product Type 2019 & 2032
- Table 5: Global Rubber Process Oil Industry Revenue Million Forecast, by Application 2019 & 2032
- Table 6: Global Rubber Process Oil Industry Volume Million Forecast, by Application 2019 & 2032
- Table 7: Global Rubber Process Oil Industry Revenue Million Forecast, by Region 2019 & 2032
- Table 8: Global Rubber Process Oil Industry Volume Million Forecast, by Region 2019 & 2032
- Table 9: Global Rubber Process Oil Industry Revenue Million Forecast, by Country 2019 & 2032
- Table 10: Global Rubber Process Oil Industry Volume Million Forecast, by Country 2019 & 2032
- Table 11: China Rubber Process Oil Industry Revenue (Million) Forecast, by Application 2019 & 2032
- Table 12: China Rubber Process Oil Industry Volume (Million) Forecast, by Application 2019 & 2032
- Table 13: India Rubber Process Oil Industry Revenue (Million) Forecast, by Application 2019 & 2032
- Table 14: India Rubber Process Oil Industry Volume (Million) Forecast, by Application 2019 & 2032
- Table 15: Japan Rubber Process Oil Industry Revenue (Million) Forecast, by Application 2019 & 2032
- Table 16: Japan Rubber Process Oil Industry Volume (Million) Forecast, by Application 2019 & 2032
- Table 17: South Korea Rubber Process Oil Industry Revenue (Million) Forecast, by Application 2019 & 2032
- Table 18: South Korea Rubber Process Oil Industry Volume (Million) Forecast, by Application 2019 & 2032
- Table 19: Rest of Asia Pacific Rubber Process Oil Industry Revenue (Million) Forecast, by Application 2019 & 2032
- Table 20: Rest of Asia Pacific Rubber Process Oil Industry Volume (Million) Forecast, by Application 2019 & 2032
- Table 21: Global Rubber Process Oil Industry Revenue Million Forecast, by Country 2019 & 2032
- Table 22: Global Rubber Process Oil Industry Volume Million Forecast, by Country 2019 & 2032
- Table 23: United States Rubber Process Oil Industry Revenue (Million) Forecast, by Application 2019 & 2032
- Table 24: United States Rubber Process Oil Industry Volume (Million) Forecast, by Application 2019 & 2032
- Table 25: Canada Rubber Process Oil Industry Revenue (Million) Forecast, by Application 2019 & 2032
- Table 26: Canada Rubber Process Oil Industry Volume (Million) Forecast, by Application 2019 & 2032
- Table 27: Mexico Rubber Process Oil Industry Revenue (Million) Forecast, by Application 2019 & 2032
- Table 28: Mexico Rubber Process Oil Industry Volume (Million) Forecast, by Application 2019 & 2032
- Table 29: Global Rubber Process Oil Industry Revenue Million Forecast, by Country 2019 & 2032
- Table 30: Global Rubber Process Oil Industry Volume Million Forecast, by Country 2019 & 2032
- Table 31: Germany Rubber Process Oil Industry Revenue (Million) Forecast, by Application 2019 & 2032
- Table 32: Germany Rubber Process Oil Industry Volume (Million) Forecast, by Application 2019 & 2032
- Table 33: United Kingdom Rubber Process Oil Industry Revenue (Million) Forecast, by Application 2019 & 2032
- Table 34: United Kingdom Rubber Process Oil Industry Volume (Million) Forecast, by Application 2019 & 2032
- Table 35: France Rubber Process Oil Industry Revenue (Million) Forecast, by Application 2019 & 2032
- Table 36: France Rubber Process Oil Industry Volume (Million) Forecast, by Application 2019 & 2032
- Table 37: Italy Rubber Process Oil Industry Revenue (Million) Forecast, by Application 2019 & 2032
- Table 38: Italy Rubber Process Oil Industry Volume (Million) Forecast, by Application 2019 & 2032
- Table 39: Rest of Europe Rubber Process Oil Industry Revenue (Million) Forecast, by Application 2019 & 2032
- Table 40: Rest of Europe Rubber Process Oil Industry Volume (Million) Forecast, by Application 2019 & 2032
- Table 41: Global Rubber Process Oil Industry Revenue Million Forecast, by Country 2019 & 2032
- Table 42: Global Rubber Process Oil Industry Volume Million Forecast, by Country 2019 & 2032
- Table 43: Brazil Rubber Process Oil Industry Revenue (Million) Forecast, by Application 2019 & 2032
- Table 44: Brazil Rubber Process Oil Industry Volume (Million) Forecast, by Application 2019 & 2032
- Table 45: Argentina Rubber Process Oil Industry Revenue (Million) Forecast, by Application 2019 & 2032
- Table 46: Argentina Rubber Process Oil Industry Volume (Million) Forecast, by Application 2019 & 2032
- Table 47: Rest of South America Rubber Process Oil Industry Revenue (Million) Forecast, by Application 2019 & 2032
- Table 48: Rest of South America Rubber Process Oil Industry Volume (Million) Forecast, by Application 2019 & 2032
- Table 49: Global Rubber Process Oil Industry Revenue Million Forecast, by Country 2019 & 2032
- Table 50: Global Rubber Process Oil Industry Volume Million Forecast, by Country 2019 & 2032
- Table 51: Saudi Arabia Rubber Process Oil Industry Revenue (Million) Forecast, by Application 2019 & 2032
- Table 52: Saudi Arabia Rubber Process Oil Industry Volume (Million) Forecast, by Application 2019 & 2032
- Table 53: South Africa Rubber Process Oil Industry Revenue (Million) Forecast, by Application 2019 & 2032
- Table 54: South Africa Rubber Process Oil Industry Volume (Million) Forecast, by Application 2019 & 2032
- Table 55: Rest of Middle East and Africa Rubber Process Oil Industry Revenue (Million) Forecast, by Application 2019 & 2032
- Table 56: Rest of Middle East and Africa Rubber Process Oil Industry Volume (Million) Forecast, by Application 2019 & 2032
- Table 57: Global Rubber Process Oil Industry Revenue Million Forecast, by Product Type 2019 & 2032
- Table 58: Global Rubber Process Oil Industry Volume Million Forecast, by Product Type 2019 & 2032
- Table 59: Global Rubber Process Oil Industry Revenue Million Forecast, by Application 2019 & 2032
- Table 60: Global Rubber Process Oil Industry Volume Million Forecast, by Application 2019 & 2032
- Table 61: Global Rubber Process Oil Industry Revenue Million Forecast, by Country 2019 & 2032
- Table 62: Global Rubber Process Oil Industry Volume Million Forecast, by Country 2019 & 2032
- Table 63: China Rubber Process Oil Industry Revenue (Million) Forecast, by Application 2019 & 2032
- Table 64: China Rubber Process Oil Industry Volume (Million) Forecast, by Application 2019 & 2032
- Table 65: India Rubber Process Oil Industry Revenue (Million) Forecast, by Application 2019 & 2032
- Table 66: India Rubber Process Oil Industry Volume (Million) Forecast, by Application 2019 & 2032
- Table 67: Japan Rubber Process Oil Industry Revenue (Million) Forecast, by Application 2019 & 2032
- Table 68: Japan Rubber Process Oil Industry Volume (Million) Forecast, by Application 2019 & 2032
- Table 69: South Korea Rubber Process Oil Industry Revenue (Million) Forecast, by Application 2019 & 2032
- Table 70: South Korea Rubber Process Oil Industry Volume (Million) Forecast, by Application 2019 & 2032
- Table 71: Rest of Asia Pacific Rubber Process Oil Industry Revenue (Million) Forecast, by Application 2019 & 2032
- Table 72: Rest of Asia Pacific Rubber Process Oil Industry Volume (Million) Forecast, by Application 2019 & 2032
- Table 73: Global Rubber Process Oil Industry Revenue Million Forecast, by Product Type 2019 & 2032
- Table 74: Global Rubber Process Oil Industry Volume Million Forecast, by Product Type 2019 & 2032
- Table 75: Global Rubber Process Oil Industry Revenue Million Forecast, by Application 2019 & 2032
- Table 76: Global Rubber Process Oil Industry Volume Million Forecast, by Application 2019 & 2032
- Table 77: Global Rubber Process Oil Industry Revenue Million Forecast, by Country 2019 & 2032
- Table 78: Global Rubber Process Oil Industry Volume Million Forecast, by Country 2019 & 2032
- Table 79: United States Rubber Process Oil Industry Revenue (Million) Forecast, by Application 2019 & 2032
- Table 80: United States Rubber Process Oil Industry Volume (Million) Forecast, by Application 2019 & 2032
- Table 81: Canada Rubber Process Oil Industry Revenue (Million) Forecast, by Application 2019 & 2032
- Table 82: Canada Rubber Process Oil Industry Volume (Million) Forecast, by Application 2019 & 2032
- Table 83: Mexico Rubber Process Oil Industry Revenue (Million) Forecast, by Application 2019 & 2032
- Table 84: Mexico Rubber Process Oil Industry Volume (Million) Forecast, by Application 2019 & 2032
- Table 85: Global Rubber Process Oil Industry Revenue Million Forecast, by Product Type 2019 & 2032
- Table 86: Global Rubber Process Oil Industry Volume Million Forecast, by Product Type 2019 & 2032
- Table 87: Global Rubber Process Oil Industry Revenue Million Forecast, by Application 2019 & 2032
- Table 88: Global Rubber Process Oil Industry Volume Million Forecast, by Application 2019 & 2032
- Table 89: Global Rubber Process Oil Industry Revenue Million Forecast, by Country 2019 & 2032
- Table 90: Global Rubber Process Oil Industry Volume Million Forecast, by Country 2019 & 2032
- Table 91: Germany Rubber Process Oil Industry Revenue (Million) Forecast, by Application 2019 & 2032
- Table 92: Germany Rubber Process Oil Industry Volume (Million) Forecast, by Application 2019 & 2032
- Table 93: United Kingdom Rubber Process Oil Industry Revenue (Million) Forecast, by Application 2019 & 2032
- Table 94: United Kingdom Rubber Process Oil Industry Volume (Million) Forecast, by Application 2019 & 2032
- Table 95: France Rubber Process Oil Industry Revenue (Million) Forecast, by Application 2019 & 2032
- Table 96: France Rubber Process Oil Industry Volume (Million) Forecast, by Application 2019 & 2032
- Table 97: Italy Rubber Process Oil Industry Revenue (Million) Forecast, by Application 2019 & 2032
- Table 98: Italy Rubber Process Oil Industry Volume (Million) Forecast, by Application 2019 & 2032
- Table 99: Rest of Europe Rubber Process Oil Industry Revenue (Million) Forecast, by Application 2019 & 2032
- Table 100: Rest of Europe Rubber Process Oil Industry Volume (Million) Forecast, by Application 2019 & 2032
- Table 101: Global Rubber Process Oil Industry Revenue Million Forecast, by Product Type 2019 & 2032
- Table 102: Global Rubber Process Oil Industry Volume Million Forecast, by Product Type 2019 & 2032
- Table 103: Global Rubber Process Oil Industry Revenue Million Forecast, by Application 2019 & 2032
- Table 104: Global Rubber Process Oil Industry Volume Million Forecast, by Application 2019 & 2032
- Table 105: Global Rubber Process Oil Industry Revenue Million Forecast, by Country 2019 & 2032
- Table 106: Global Rubber Process Oil Industry Volume Million Forecast, by Country 2019 & 2032
- Table 107: Brazil Rubber Process Oil Industry Revenue (Million) Forecast, by Application 2019 & 2032
- Table 108: Brazil Rubber Process Oil Industry Volume (Million) Forecast, by Application 2019 & 2032
- Table 109: Argentina Rubber Process Oil Industry Revenue (Million) Forecast, by Application 2019 & 2032
- Table 110: Argentina Rubber Process Oil Industry Volume (Million) Forecast, by Application 2019 & 2032
- Table 111: Rest of South America Rubber Process Oil Industry Revenue (Million) Forecast, by Application 2019 & 2032
- Table 112: Rest of South America Rubber Process Oil Industry Volume (Million) Forecast, by Application 2019 & 2032
- Table 113: Global Rubber Process Oil Industry Revenue Million Forecast, by Product Type 2019 & 2032
- Table 114: Global Rubber Process Oil Industry Volume Million Forecast, by Product Type 2019 & 2032
- Table 115: Global Rubber Process Oil Industry Revenue Million Forecast, by Application 2019 & 2032
- Table 116: Global Rubber Process Oil Industry Volume Million Forecast, by Application 2019 & 2032
- Table 117: Global Rubber Process Oil Industry Revenue Million Forecast, by Country 2019 & 2032
- Table 118: Global Rubber Process Oil Industry Volume Million Forecast, by Country 2019 & 2032
- Table 119: Saudi Arabia Rubber Process Oil Industry Revenue (Million) Forecast, by Application 2019 & 2032
- Table 120: Saudi Arabia Rubber Process Oil Industry Volume (Million) Forecast, by Application 2019 & 2032
- Table 121: South Africa Rubber Process Oil Industry Revenue (Million) Forecast, by Application 2019 & 2032
- Table 122: South Africa Rubber Process Oil Industry Volume (Million) Forecast, by Application 2019 & 2032
- Table 123: Rest of Middle East and Africa Rubber Process Oil Industry Revenue (Million) Forecast, by Application 2019 & 2032
- Table 124: Rest of Middle East and Africa Rubber Process Oil Industry Volume (Million) Forecast, by Application 2019 & 2032
Frequently Asked Questions
1. What is the projected Compound Annual Growth Rate (CAGR) of the Rubber Process Oil Industry?
The projected CAGR is approximately 2.93%.
2. Which companies are prominent players in the Rubber Process Oil Industry?
Key companies in the market include APAR Industries, ORGKHIM Biochemical Holding, Exxon Mobil Corporation, Sterlite Lubricants, EaglePetrochem, Repsol, LODHA Petro, Chevron Corporation, Witmans Industries Pvt Ltd*List Not Exhaustive, TotalEnergies, HF Sinclair Corporation, Panama Petrochem Ltd, CPC Corporation.
3. What are the main segments of the Rubber Process Oil Industry?
The market segments include Product Type, Application.
4. Can you provide details about the market size?
The market size is estimated to be USD XX Million as of 2022.
5. What are some drivers contributing to market growth?
Increasing Demand for Tire and Automotive Components; Growing Demand for Footwear; Others.
6. What are the notable trends driving market growth?
Growing Demand of Rubber Process Oil from Tire and Automobile Components.
7. Are there any restraints impacting market growth?
Volatility in Raw Material Price; Other Restraints.
8. Can you provide examples of recent developments in the market?
N/A
9. What pricing options are available for accessing the report?
Pricing options include single-user, multi-user, and enterprise licenses priced at USD 4750, USD 5250, and USD 8750 respectively.
10. Is the market size provided in terms of value or volume?
The market size is provided in terms of value, measured in Million and volume, measured in Million.
11. Are there any specific market keywords associated with the report?
Yes, the market keyword associated with the report is "Rubber Process Oil Industry," which aids in identifying and referencing the specific market segment covered.
12. How do I determine which pricing option suits my needs best?
The pricing options vary based on user requirements and access needs. Individual users may opt for single-user licenses, while businesses requiring broader access may choose multi-user or enterprise licenses for cost-effective access to the report.
13. Are there any additional resources or data provided in the Rubber Process Oil Industry report?
While the report offers comprehensive insights, it's advisable to review the specific contents or supplementary materials provided to ascertain if additional resources or data are available.
14. How can I stay updated on further developments or reports in the Rubber Process Oil Industry?
To stay informed about further developments, trends, and reports in the Rubber Process Oil Industry, consider subscribing to industry newsletters, following relevant companies and organizations, or regularly checking reputable industry news sources and publications.
Methodology
Step 1 - Identification of Relevant Samples Size from Population Database


Step 2 - Approaches for Defining Global Market Size (Value, Volume* & Price*)

Note*: In applicable scenarios
Step 3 - Data Sources
Primary Research
- Web Analytics
- Survey Reports
- Research Institute
- Latest Research Reports
- Opinion Leaders
Secondary Research
- Annual Reports
- White Paper
- Latest Press Release
- Industry Association
- Paid Database
- Investor Presentations

Step 4 - Data Triangulation
Involves using different sources of information in order to increase the validity of a study
These sources are likely to be stakeholders in a program - participants, other researchers, program staff, other community members, and so on.
Then we put all data in single framework & apply various statistical tools to find out the dynamic on the market.
During the analysis stage, feedback from the stakeholder groups would be compared to determine areas of agreement as well as areas of divergence


