
Key Insights
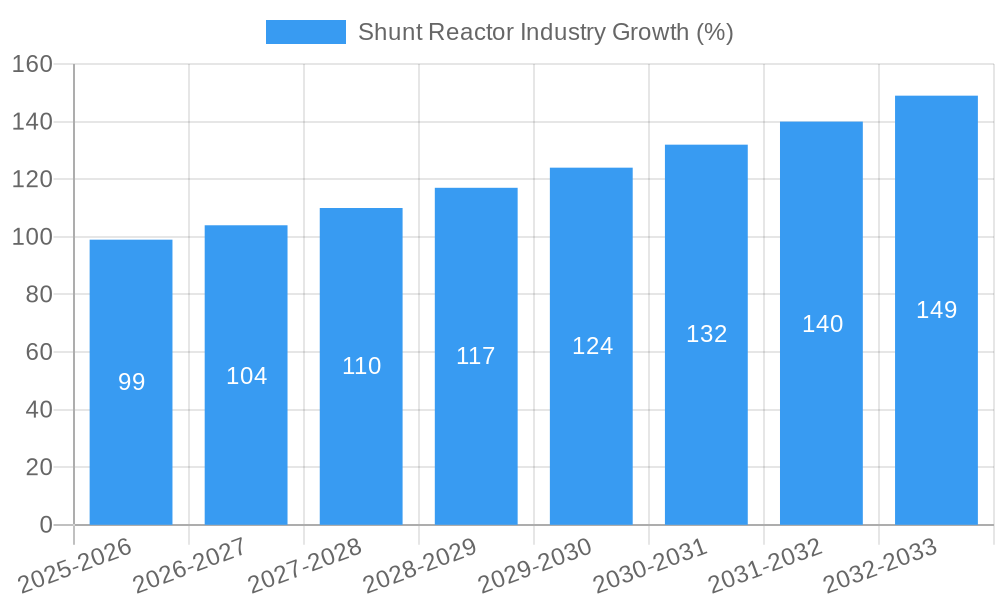
The global shunt reactor market, valued at approximately $XX million in 2025, is projected to experience robust growth, exhibiting a Compound Annual Growth Rate (CAGR) of 6.10% from 2025 to 2033. This expansion is fueled by the increasing demand for stable and reliable power grids, particularly in rapidly developing economies across Asia-Pacific and the Middle East. The rising adoption of renewable energy sources, including solar and wind power, necessitates the integration of shunt reactors to mitigate voltage fluctuations and improve grid stability. Furthermore, advancements in reactor technology, such as the development of more efficient and compact designs, contribute to market growth. The market is segmented by product type (oil-immersed, air-core dry), form factor (fixed, variable), and rated voltage (below 200 kV, 200-400 kV, above 400 kV). Oil-immersed reactors currently dominate the market due to their established technology and cost-effectiveness, but air-core dry reactors are gaining traction due to their environmentally friendly nature. The fixed shunt reactor segment holds a larger market share compared to variable shunt reactors, reflecting the prevalence of applications requiring consistent reactive power compensation. Key players like Trench Group, Fuji Electric, Hyosung, Mitsubishi Electric, and Siemens are driving innovation and competition within the market, investing in research and development to enhance reactor performance and expand their product portfolios. Geographic expansion, particularly in emerging markets with significant infrastructure development, further contributes to market expansion.
Growth restraints include the high initial investment costs associated with shunt reactor installation and the potential environmental concerns related to the use of oil-filled reactors. However, these challenges are being addressed through technological advancements and the increasing adoption of more sustainable alternatives. The market's future prospects remain positive, driven by sustained investment in power grid modernization, the integration of renewable energy sources, and the ongoing development of sophisticated power electronics technologies. The continued emphasis on grid stability and reliability across various regions will solidify the shunt reactor market's position as a crucial component of modern power systems.
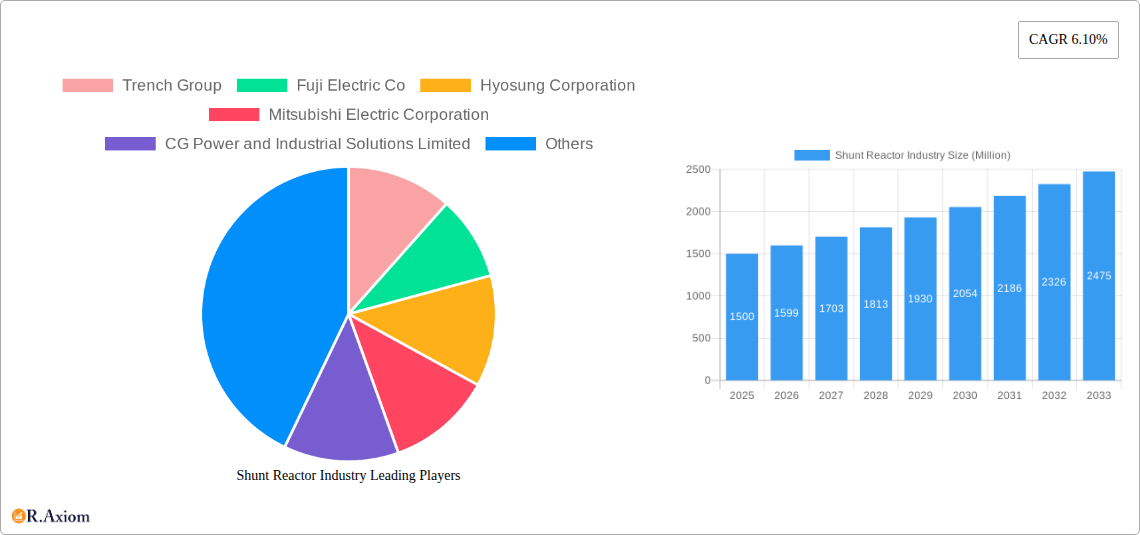
Shunt Reactor Industry Market Report: 2019-2033
This comprehensive report provides a detailed analysis of the global shunt reactor industry, covering market size, segmentation, growth drivers, challenges, and key players. The study period spans from 2019 to 2033, with 2025 serving as the base and estimated year. The forecast period is 2025-2033, and the historical period encompasses 2019-2024. Key companies analyzed include Trench Group, Fuji Electric Co, Hyosung Corporation, Mitsubishi Electric Corporation, CG Power and Industrial Solutions Limited, Siemens AG, Hitachi ABB Power Grids, Hyundai Heavy Industries Co Ltd, TBEA Co Ltd, and Alstom SA (list not exhaustive).
Shunt Reactor Industry Market Concentration & Innovation
This section analyzes the competitive landscape of the shunt reactor market, encompassing market concentration, innovation drivers, regulatory frameworks, and industry dynamics. The global shunt reactor market exhibits a moderately concentrated structure, with the top 10 players holding an estimated xx% market share in 2025. Innovation is driven by the need for improved efficiency, reliability, and reduced environmental impact. Stringent environmental regulations are pushing the adoption of eco-friendly materials and designs. Key innovations include advancements in insulation technologies, the development of compact reactors, and the integration of smart grid technologies. The market also witnesses consistent M&A activity, with deal values totaling approximately $xx Million in the past five years. These acquisitions often focus on expanding geographic reach, technological capabilities, and product portfolios. Product substitutes, primarily other reactive power compensation devices, exert some competitive pressure, although shunt reactors remain dominant in many applications. End-user trends, characterized by a growing demand for renewable energy integration and improved grid stability, are major growth drivers.
- Market Concentration: Top 10 players hold xx% market share (2025).
- Innovation Drivers: Improved efficiency, reliability, environmental regulations.
- M&A Activity: Deal values totaling approximately $xx Million (2020-2024).
- Regulatory Frameworks: Stringent environmental standards driving innovation.
Shunt Reactor Industry Trends & Insights
The global shunt reactor market is experiencing robust growth, driven by the increasing demand for electricity and the expansion of power grids worldwide. The market is projected to exhibit a Compound Annual Growth Rate (CAGR) of xx% during the forecast period (2025-2033). This growth is fueled by several factors, including the rise of renewable energy sources (solar, wind), which often require reactive power compensation. Technological disruptions, such as the adoption of advanced materials and smart grid technologies, are further enhancing market expansion. Consumer preferences are shifting towards more efficient and environmentally friendly solutions, driving demand for advanced shunt reactor designs. The competitive landscape is characterized by intense competition among established players and emerging companies, leading to continuous product innovation and price optimization. Market penetration of advanced features like digital monitoring and remote control is steadily increasing, further driving growth.
Dominant Markets & Segments in Shunt Reactor Industry
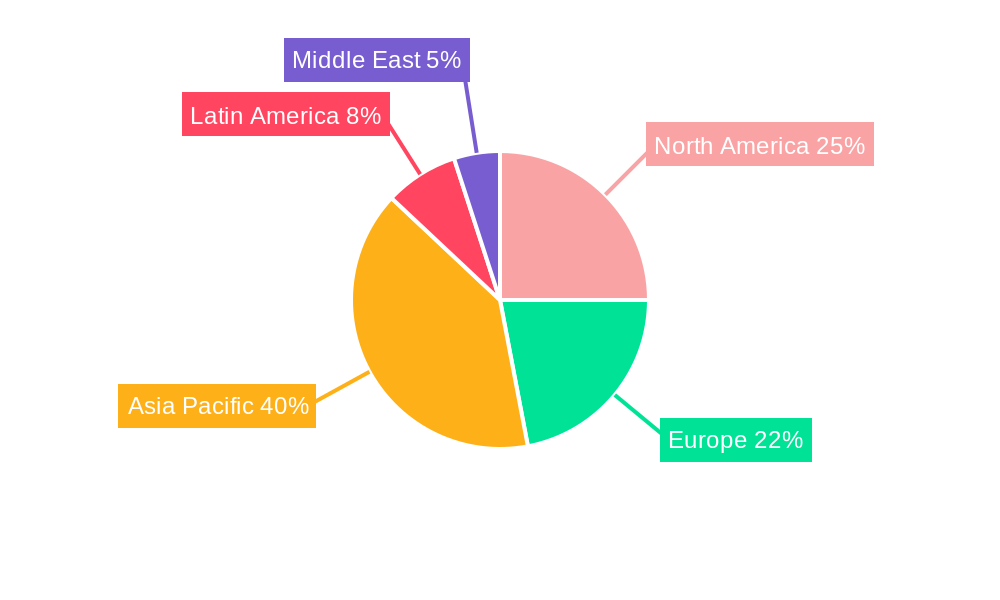
The Asia-Pacific region is projected to dominate the shunt reactor market throughout the forecast period, driven by substantial investments in infrastructure development and rapid economic growth in countries like China and India. Within the segment breakdown:
By Type of Product: Oil-immersed reactors currently hold the largest market share due to their established technology and cost-effectiveness. However, air core dry reactors are gaining traction due to their environmental benefits and suitability for specific applications. The oil-immersed reactor segment is projected to grow at a CAGR of xx% during the forecast period, while the air core dry reactor segment is expected to grow at xx%.
By Form Factor: Fixed shunt reactors constitute the larger segment, owing to their simpler design and lower cost. Variable shunt reactors offer enhanced flexibility and are witnessing increased adoption in smart grids and renewable energy integration projects. The fixed shunt reactor segment is projected to grow at a CAGR of xx% while the variable shunt reactor segment is projected to grow at xx%.
By Rated Voltage: The 200kV-400kV segment holds the largest market share, driven by the prevalent voltage levels in existing power transmission systems. However, the above 400kV segment is expected to show the highest growth rate due to the expansion of ultra-high-voltage transmission lines. The less than 200kV segment is expected to grow at a CAGR of xx%, the 200kV-400kV segment at xx%, and the above 400kV segment at xx%.
Key drivers for regional dominance include:
- Economic Policies: Government initiatives promoting grid modernization and renewable energy adoption.
- Infrastructure Development: Massive investments in power transmission and distribution networks.
Shunt Reactor Industry Product Developments
Recent product innovations focus on enhancing efficiency, reliability, and environmental sustainability. This includes the development of compact, high-efficiency designs utilizing advanced insulation materials and cooling technologies. The integration of smart grid functionalities, such as digital monitoring and remote control, is another key trend. These improvements aim to meet the growing demand for reliable and efficient power transmission, particularly in the context of integrating renewable energy sources into the grid. The market fit for these developments is excellent, driven by the need for improved grid stability and operational efficiency.
Report Scope & Segmentation Analysis
This report segments the shunt reactor market by type of product (oil-immersed reactor, air core dry reactor), form factor (fixed shunt reactor, variable shunt reactor), and rated voltage (less than 200 kV, 200kV-400kV, above 400kV). Each segment is analyzed in terms of its market size, growth projections, and competitive dynamics. Growth projections vary by segment, reflecting differences in technological advancements, market demand, and regulatory influences. Competitive dynamics are shaped by the presence of both established players and new entrants, leading to a dynamic competitive landscape.
Key Drivers of Shunt Reactor Industry Growth
The growth of the shunt reactor industry is driven by several factors, including the increasing demand for electricity, the expansion of power grids, and the integration of renewable energy sources into the grid. Furthermore, government regulations promoting grid stability and energy efficiency are driving adoption. Technological advancements, such as the development of more efficient and compact designs, also contribute to market growth. The rising adoption of smart grid technologies further enhances the demand for advanced shunt reactor solutions.
Challenges in the Shunt Reactor Industry Sector
Challenges facing the shunt reactor industry include the high initial investment costs associated with implementing new installations, potential supply chain disruptions affecting raw material availability, and increasing competition from alternative reactive power compensation technologies. Furthermore, stringent environmental regulations require manufacturers to adopt eco-friendly materials and designs, adding to production costs. These factors can constrain market growth if not addressed effectively.
Emerging Opportunities in Shunt Reactor Industry
Emerging opportunities lie in the development of advanced shunt reactor designs with enhanced efficiency, reliability, and smart grid integration capabilities. The growing demand for renewable energy integration and the expansion of ultra-high-voltage transmission lines present significant market opportunities. Furthermore, new markets in developing economies offer considerable growth potential. Focus on developing compact and environmentally friendly designs will be crucial for capturing future market share.
Leading Players in the Shunt Reactor Industry Market
- Trench Group
- Fuji Electric Co
- Hyosung Corporation
- Mitsubishi Electric Corporation
- CG Power and Industrial Solutions Limited
- Siemens AG
- Hitachi ABB Power Grids
- Hyundai Heavy Industries Co Ltd
- TBEA Co Ltd
- Alstom SA *List Not Exhaustive
Key Developments in Shunt Reactor Industry Industry
- 2022 Q4: Siemens AG launched a new line of compact shunt reactors with improved efficiency.
- 2023 Q1: Hitachi ABB Power Grids announced a strategic partnership to develop advanced grid solutions including shunt reactors.
- 2023 Q3: Mitsubishi Electric Corporation completed a major acquisition expanding its shunt reactor manufacturing capacity. (Further developments to be added based on available data)
Strategic Outlook for Shunt Reactor Industry Market
The future of the shunt reactor market is bright, driven by the continued growth in electricity demand, the expansion of power grids, and the increasing integration of renewable energy. Technological advancements, coupled with supportive government policies, will further propel market expansion. Companies that focus on innovation, efficiency, and sustainability will be best positioned to capture market share in this dynamic and rapidly evolving industry.
Shunt Reactor Industry Segmentation
-
1. Type of Product
- 1.1. Oil-Immersed Reactor
- 1.2. Air Core Dry Reactor
-
2. Form Factor
- 2.1. Fixed Shunt Reactor
- 2.2. Variable Shunt Reactor
-
3. Rated Voltage
- 3.1. Less than 200 kV
- 3.2. 200kV-400kV
- 3.3. Above 400kV
Shunt Reactor Industry Segmentation By Geography
-
1. North America
- 1.1. United States
- 1.2. Canada
-
2. Europe
- 2.1. United Kingdom
- 2.2. Germany
- 2.3. France
- 2.4. Rest of Europe
-
3. Asia Pacific
- 3.1. China
- 3.2. India
- 3.3. Japan
- 3.4. Rest of Asia Pacific
- 4. Latin America
- 5. Middle East
Shunt Reactor Industry REPORT HIGHLIGHTS
| Aspects | Details |
|---|---|
| Study Period | 2019-2033 |
| Base Year | 2024 |
| Estimated Year | 2025 |
| Forecast Period | 2025-2033 |
| Historical Period | 2019-2024 |
| Growth Rate | CAGR of 6.10% from 2019-2033 |
| Segmentation |
|
Table of Contents
- 1. Introduction
- 1.1. Research Scope
- 1.2. Market Segmentation
- 1.3. Research Methodology
- 1.4. Definitions and Assumptions
- 2. Executive Summary
- 2.1. Introduction
- 3. Market Dynamics
- 3.1. Introduction
- 3.2. Market Drivers
- 3.2.1. ; Increasing Need for Modernization of Transmission and Distribution Networks; Increased Industrialization of the Developing Nations
- 3.3. Market Restrains
- 3.3.1 Shortage of Skilled Workers
- 3.3.2 Data Security Concerns
- 3.3.3 and the Initial Investment Costs Hinder Business Operations
- 3.4. Market Trends
- 3.4.1. Variable is Expected to Hold Significant Growth
- 4. Market Factor Analysis
- 4.1. Porters Five Forces
- 4.2. Supply/Value Chain
- 4.3. PESTEL analysis
- 4.4. Market Entropy
- 4.5. Patent/Trademark Analysis
- 5. Global Shunt Reactor Industry Analysis, Insights and Forecast, 2019-2031
- 5.1. Market Analysis, Insights and Forecast - by Type of Product
- 5.1.1. Oil-Immersed Reactor
- 5.1.2. Air Core Dry Reactor
- 5.2. Market Analysis, Insights and Forecast - by Form Factor
- 5.2.1. Fixed Shunt Reactor
- 5.2.2. Variable Shunt Reactor
- 5.3. Market Analysis, Insights and Forecast - by Rated Voltage
- 5.3.1. Less than 200 kV
- 5.3.2. 200kV-400kV
- 5.3.3. Above 400kV
- 5.4. Market Analysis, Insights and Forecast - by Region
- 5.4.1. North America
- 5.4.2. Europe
- 5.4.3. Asia Pacific
- 5.4.4. Latin America
- 5.4.5. Middle East
- 5.1. Market Analysis, Insights and Forecast - by Type of Product
- 6. North America Shunt Reactor Industry Analysis, Insights and Forecast, 2019-2031
- 6.1. Market Analysis, Insights and Forecast - by Type of Product
- 6.1.1. Oil-Immersed Reactor
- 6.1.2. Air Core Dry Reactor
- 6.2. Market Analysis, Insights and Forecast - by Form Factor
- 6.2.1. Fixed Shunt Reactor
- 6.2.2. Variable Shunt Reactor
- 6.3. Market Analysis, Insights and Forecast - by Rated Voltage
- 6.3.1. Less than 200 kV
- 6.3.2. 200kV-400kV
- 6.3.3. Above 400kV
- 6.1. Market Analysis, Insights and Forecast - by Type of Product
- 7. Europe Shunt Reactor Industry Analysis, Insights and Forecast, 2019-2031
- 7.1. Market Analysis, Insights and Forecast - by Type of Product
- 7.1.1. Oil-Immersed Reactor
- 7.1.2. Air Core Dry Reactor
- 7.2. Market Analysis, Insights and Forecast - by Form Factor
- 7.2.1. Fixed Shunt Reactor
- 7.2.2. Variable Shunt Reactor
- 7.3. Market Analysis, Insights and Forecast - by Rated Voltage
- 7.3.1. Less than 200 kV
- 7.3.2. 200kV-400kV
- 7.3.3. Above 400kV
- 7.1. Market Analysis, Insights and Forecast - by Type of Product
- 8. Asia Pacific Shunt Reactor Industry Analysis, Insights and Forecast, 2019-2031
- 8.1. Market Analysis, Insights and Forecast - by Type of Product
- 8.1.1. Oil-Immersed Reactor
- 8.1.2. Air Core Dry Reactor
- 8.2. Market Analysis, Insights and Forecast - by Form Factor
- 8.2.1. Fixed Shunt Reactor
- 8.2.2. Variable Shunt Reactor
- 8.3. Market Analysis, Insights and Forecast - by Rated Voltage
- 8.3.1. Less than 200 kV
- 8.3.2. 200kV-400kV
- 8.3.3. Above 400kV
- 8.1. Market Analysis, Insights and Forecast - by Type of Product
- 9. Latin America Shunt Reactor Industry Analysis, Insights and Forecast, 2019-2031
- 9.1. Market Analysis, Insights and Forecast - by Type of Product
- 9.1.1. Oil-Immersed Reactor
- 9.1.2. Air Core Dry Reactor
- 9.2. Market Analysis, Insights and Forecast - by Form Factor
- 9.2.1. Fixed Shunt Reactor
- 9.2.2. Variable Shunt Reactor
- 9.3. Market Analysis, Insights and Forecast - by Rated Voltage
- 9.3.1. Less than 200 kV
- 9.3.2. 200kV-400kV
- 9.3.3. Above 400kV
- 9.1. Market Analysis, Insights and Forecast - by Type of Product
- 10. Middle East Shunt Reactor Industry Analysis, Insights and Forecast, 2019-2031
- 10.1. Market Analysis, Insights and Forecast - by Type of Product
- 10.1.1. Oil-Immersed Reactor
- 10.1.2. Air Core Dry Reactor
- 10.2. Market Analysis, Insights and Forecast - by Form Factor
- 10.2.1. Fixed Shunt Reactor
- 10.2.2. Variable Shunt Reactor
- 10.3. Market Analysis, Insights and Forecast - by Rated Voltage
- 10.3.1. Less than 200 kV
- 10.3.2. 200kV-400kV
- 10.3.3. Above 400kV
- 10.1. Market Analysis, Insights and Forecast - by Type of Product
- 11. North America Shunt Reactor Industry Analysis, Insights and Forecast, 2019-2031
- 11.1. Market Analysis, Insights and Forecast - By Country/Sub-region
- 11.1.1 United States
- 11.1.2 Canada
- 12. Europe Shunt Reactor Industry Analysis, Insights and Forecast, 2019-2031
- 12.1. Market Analysis, Insights and Forecast - By Country/Sub-region
- 12.1.1 United Kingdom
- 12.1.2 Germany
- 12.1.3 France
- 12.1.4 Rest of Europe
- 13. Asia Pacific Shunt Reactor Industry Analysis, Insights and Forecast, 2019-2031
- 13.1. Market Analysis, Insights and Forecast - By Country/Sub-region
- 13.1.1 China
- 13.1.2 India
- 13.1.3 Japan
- 13.1.4 Rest of Asia Pacific
- 14. Latin America Shunt Reactor Industry Analysis, Insights and Forecast, 2019-2031
- 14.1. Market Analysis, Insights and Forecast - By Country/Sub-region
- 14.1.1.
- 15. Middle East Shunt Reactor Industry Analysis, Insights and Forecast, 2019-2031
- 15.1. Market Analysis, Insights and Forecast - By Country/Sub-region
- 15.1.1.
- 16. Competitive Analysis
- 16.1. Global Market Share Analysis 2024
- 16.2. Company Profiles
- 16.2.1 Trench Group
- 16.2.1.1. Overview
- 16.2.1.2. Products
- 16.2.1.3. SWOT Analysis
- 16.2.1.4. Recent Developments
- 16.2.1.5. Financials (Based on Availability)
- 16.2.2 Fuji Electric Co
- 16.2.2.1. Overview
- 16.2.2.2. Products
- 16.2.2.3. SWOT Analysis
- 16.2.2.4. Recent Developments
- 16.2.2.5. Financials (Based on Availability)
- 16.2.3 Hyosung Corporation
- 16.2.3.1. Overview
- 16.2.3.2. Products
- 16.2.3.3. SWOT Analysis
- 16.2.3.4. Recent Developments
- 16.2.3.5. Financials (Based on Availability)
- 16.2.4 Mitsubishi Electric Corporation
- 16.2.4.1. Overview
- 16.2.4.2. Products
- 16.2.4.3. SWOT Analysis
- 16.2.4.4. Recent Developments
- 16.2.4.5. Financials (Based on Availability)
- 16.2.5 CG Power and Industrial Solutions Limited
- 16.2.5.1. Overview
- 16.2.5.2. Products
- 16.2.5.3. SWOT Analysis
- 16.2.5.4. Recent Developments
- 16.2.5.5. Financials (Based on Availability)
- 16.2.6 Siemens AG
- 16.2.6.1. Overview
- 16.2.6.2. Products
- 16.2.6.3. SWOT Analysis
- 16.2.6.4. Recent Developments
- 16.2.6.5. Financials (Based on Availability)
- 16.2.7 Hitachi ABB Power Grids
- 16.2.7.1. Overview
- 16.2.7.2. Products
- 16.2.7.3. SWOT Analysis
- 16.2.7.4. Recent Developments
- 16.2.7.5. Financials (Based on Availability)
- 16.2.8 Hyundai Heavy Industries Co Ltd
- 16.2.8.1. Overview
- 16.2.8.2. Products
- 16.2.8.3. SWOT Analysis
- 16.2.8.4. Recent Developments
- 16.2.8.5. Financials (Based on Availability)
- 16.2.9 TBEA Co Ltd
- 16.2.9.1. Overview
- 16.2.9.2. Products
- 16.2.9.3. SWOT Analysis
- 16.2.9.4. Recent Developments
- 16.2.9.5. Financials (Based on Availability)
- 16.2.10 Alstom SA*List Not Exhaustive
- 16.2.10.1. Overview
- 16.2.10.2. Products
- 16.2.10.3. SWOT Analysis
- 16.2.10.4. Recent Developments
- 16.2.10.5. Financials (Based on Availability)
- 16.2.1 Trench Group
List of Figures
- Figure 1: Global Shunt Reactor Industry Revenue Breakdown (Million, %) by Region 2024 & 2032
- Figure 2: North America Shunt Reactor Industry Revenue (Million), by Country 2024 & 2032
- Figure 3: North America Shunt Reactor Industry Revenue Share (%), by Country 2024 & 2032
- Figure 4: Europe Shunt Reactor Industry Revenue (Million), by Country 2024 & 2032
- Figure 5: Europe Shunt Reactor Industry Revenue Share (%), by Country 2024 & 2032
- Figure 6: Asia Pacific Shunt Reactor Industry Revenue (Million), by Country 2024 & 2032
- Figure 7: Asia Pacific Shunt Reactor Industry Revenue Share (%), by Country 2024 & 2032
- Figure 8: Latin America Shunt Reactor Industry Revenue (Million), by Country 2024 & 2032
- Figure 9: Latin America Shunt Reactor Industry Revenue Share (%), by Country 2024 & 2032
- Figure 10: Middle East Shunt Reactor Industry Revenue (Million), by Country 2024 & 2032
- Figure 11: Middle East Shunt Reactor Industry Revenue Share (%), by Country 2024 & 2032
- Figure 12: North America Shunt Reactor Industry Revenue (Million), by Type of Product 2024 & 2032
- Figure 13: North America Shunt Reactor Industry Revenue Share (%), by Type of Product 2024 & 2032
- Figure 14: North America Shunt Reactor Industry Revenue (Million), by Form Factor 2024 & 2032
- Figure 15: North America Shunt Reactor Industry Revenue Share (%), by Form Factor 2024 & 2032
- Figure 16: North America Shunt Reactor Industry Revenue (Million), by Rated Voltage 2024 & 2032
- Figure 17: North America Shunt Reactor Industry Revenue Share (%), by Rated Voltage 2024 & 2032
- Figure 18: North America Shunt Reactor Industry Revenue (Million), by Country 2024 & 2032
- Figure 19: North America Shunt Reactor Industry Revenue Share (%), by Country 2024 & 2032
- Figure 20: Europe Shunt Reactor Industry Revenue (Million), by Type of Product 2024 & 2032
- Figure 21: Europe Shunt Reactor Industry Revenue Share (%), by Type of Product 2024 & 2032
- Figure 22: Europe Shunt Reactor Industry Revenue (Million), by Form Factor 2024 & 2032
- Figure 23: Europe Shunt Reactor Industry Revenue Share (%), by Form Factor 2024 & 2032
- Figure 24: Europe Shunt Reactor Industry Revenue (Million), by Rated Voltage 2024 & 2032
- Figure 25: Europe Shunt Reactor Industry Revenue Share (%), by Rated Voltage 2024 & 2032
- Figure 26: Europe Shunt Reactor Industry Revenue (Million), by Country 2024 & 2032
- Figure 27: Europe Shunt Reactor Industry Revenue Share (%), by Country 2024 & 2032
- Figure 28: Asia Pacific Shunt Reactor Industry Revenue (Million), by Type of Product 2024 & 2032
- Figure 29: Asia Pacific Shunt Reactor Industry Revenue Share (%), by Type of Product 2024 & 2032
- Figure 30: Asia Pacific Shunt Reactor Industry Revenue (Million), by Form Factor 2024 & 2032
- Figure 31: Asia Pacific Shunt Reactor Industry Revenue Share (%), by Form Factor 2024 & 2032
- Figure 32: Asia Pacific Shunt Reactor Industry Revenue (Million), by Rated Voltage 2024 & 2032
- Figure 33: Asia Pacific Shunt Reactor Industry Revenue Share (%), by Rated Voltage 2024 & 2032
- Figure 34: Asia Pacific Shunt Reactor Industry Revenue (Million), by Country 2024 & 2032
- Figure 35: Asia Pacific Shunt Reactor Industry Revenue Share (%), by Country 2024 & 2032
- Figure 36: Latin America Shunt Reactor Industry Revenue (Million), by Type of Product 2024 & 2032
- Figure 37: Latin America Shunt Reactor Industry Revenue Share (%), by Type of Product 2024 & 2032
- Figure 38: Latin America Shunt Reactor Industry Revenue (Million), by Form Factor 2024 & 2032
- Figure 39: Latin America Shunt Reactor Industry Revenue Share (%), by Form Factor 2024 & 2032
- Figure 40: Latin America Shunt Reactor Industry Revenue (Million), by Rated Voltage 2024 & 2032
- Figure 41: Latin America Shunt Reactor Industry Revenue Share (%), by Rated Voltage 2024 & 2032
- Figure 42: Latin America Shunt Reactor Industry Revenue (Million), by Country 2024 & 2032
- Figure 43: Latin America Shunt Reactor Industry Revenue Share (%), by Country 2024 & 2032
- Figure 44: Middle East Shunt Reactor Industry Revenue (Million), by Type of Product 2024 & 2032
- Figure 45: Middle East Shunt Reactor Industry Revenue Share (%), by Type of Product 2024 & 2032
- Figure 46: Middle East Shunt Reactor Industry Revenue (Million), by Form Factor 2024 & 2032
- Figure 47: Middle East Shunt Reactor Industry Revenue Share (%), by Form Factor 2024 & 2032
- Figure 48: Middle East Shunt Reactor Industry Revenue (Million), by Rated Voltage 2024 & 2032
- Figure 49: Middle East Shunt Reactor Industry Revenue Share (%), by Rated Voltage 2024 & 2032
- Figure 50: Middle East Shunt Reactor Industry Revenue (Million), by Country 2024 & 2032
- Figure 51: Middle East Shunt Reactor Industry Revenue Share (%), by Country 2024 & 2032
List of Tables
- Table 1: Global Shunt Reactor Industry Revenue Million Forecast, by Region 2019 & 2032
- Table 2: Global Shunt Reactor Industry Revenue Million Forecast, by Type of Product 2019 & 2032
- Table 3: Global Shunt Reactor Industry Revenue Million Forecast, by Form Factor 2019 & 2032
- Table 4: Global Shunt Reactor Industry Revenue Million Forecast, by Rated Voltage 2019 & 2032
- Table 5: Global Shunt Reactor Industry Revenue Million Forecast, by Region 2019 & 2032
- Table 6: Global Shunt Reactor Industry Revenue Million Forecast, by Country 2019 & 2032
- Table 7: United States Shunt Reactor Industry Revenue (Million) Forecast, by Application 2019 & 2032
- Table 8: Canada Shunt Reactor Industry Revenue (Million) Forecast, by Application 2019 & 2032
- Table 9: Global Shunt Reactor Industry Revenue Million Forecast, by Country 2019 & 2032
- Table 10: United Kingdom Shunt Reactor Industry Revenue (Million) Forecast, by Application 2019 & 2032
- Table 11: Germany Shunt Reactor Industry Revenue (Million) Forecast, by Application 2019 & 2032
- Table 12: France Shunt Reactor Industry Revenue (Million) Forecast, by Application 2019 & 2032
- Table 13: Rest of Europe Shunt Reactor Industry Revenue (Million) Forecast, by Application 2019 & 2032
- Table 14: Global Shunt Reactor Industry Revenue Million Forecast, by Country 2019 & 2032
- Table 15: China Shunt Reactor Industry Revenue (Million) Forecast, by Application 2019 & 2032
- Table 16: India Shunt Reactor Industry Revenue (Million) Forecast, by Application 2019 & 2032
- Table 17: Japan Shunt Reactor Industry Revenue (Million) Forecast, by Application 2019 & 2032
- Table 18: Rest of Asia Pacific Shunt Reactor Industry Revenue (Million) Forecast, by Application 2019 & 2032
- Table 19: Global Shunt Reactor Industry Revenue Million Forecast, by Country 2019 & 2032
- Table 20: Shunt Reactor Industry Revenue (Million) Forecast, by Application 2019 & 2032
- Table 21: Global Shunt Reactor Industry Revenue Million Forecast, by Country 2019 & 2032
- Table 22: Shunt Reactor Industry Revenue (Million) Forecast, by Application 2019 & 2032
- Table 23: Global Shunt Reactor Industry Revenue Million Forecast, by Type of Product 2019 & 2032
- Table 24: Global Shunt Reactor Industry Revenue Million Forecast, by Form Factor 2019 & 2032
- Table 25: Global Shunt Reactor Industry Revenue Million Forecast, by Rated Voltage 2019 & 2032
- Table 26: Global Shunt Reactor Industry Revenue Million Forecast, by Country 2019 & 2032
- Table 27: United States Shunt Reactor Industry Revenue (Million) Forecast, by Application 2019 & 2032
- Table 28: Canada Shunt Reactor Industry Revenue (Million) Forecast, by Application 2019 & 2032
- Table 29: Global Shunt Reactor Industry Revenue Million Forecast, by Type of Product 2019 & 2032
- Table 30: Global Shunt Reactor Industry Revenue Million Forecast, by Form Factor 2019 & 2032
- Table 31: Global Shunt Reactor Industry Revenue Million Forecast, by Rated Voltage 2019 & 2032
- Table 32: Global Shunt Reactor Industry Revenue Million Forecast, by Country 2019 & 2032
- Table 33: United Kingdom Shunt Reactor Industry Revenue (Million) Forecast, by Application 2019 & 2032
- Table 34: Germany Shunt Reactor Industry Revenue (Million) Forecast, by Application 2019 & 2032
- Table 35: France Shunt Reactor Industry Revenue (Million) Forecast, by Application 2019 & 2032
- Table 36: Rest of Europe Shunt Reactor Industry Revenue (Million) Forecast, by Application 2019 & 2032
- Table 37: Global Shunt Reactor Industry Revenue Million Forecast, by Type of Product 2019 & 2032
- Table 38: Global Shunt Reactor Industry Revenue Million Forecast, by Form Factor 2019 & 2032
- Table 39: Global Shunt Reactor Industry Revenue Million Forecast, by Rated Voltage 2019 & 2032
- Table 40: Global Shunt Reactor Industry Revenue Million Forecast, by Country 2019 & 2032
- Table 41: China Shunt Reactor Industry Revenue (Million) Forecast, by Application 2019 & 2032
- Table 42: India Shunt Reactor Industry Revenue (Million) Forecast, by Application 2019 & 2032
- Table 43: Japan Shunt Reactor Industry Revenue (Million) Forecast, by Application 2019 & 2032
- Table 44: Rest of Asia Pacific Shunt Reactor Industry Revenue (Million) Forecast, by Application 2019 & 2032
- Table 45: Global Shunt Reactor Industry Revenue Million Forecast, by Type of Product 2019 & 2032
- Table 46: Global Shunt Reactor Industry Revenue Million Forecast, by Form Factor 2019 & 2032
- Table 47: Global Shunt Reactor Industry Revenue Million Forecast, by Rated Voltage 2019 & 2032
- Table 48: Global Shunt Reactor Industry Revenue Million Forecast, by Country 2019 & 2032
- Table 49: Global Shunt Reactor Industry Revenue Million Forecast, by Type of Product 2019 & 2032
- Table 50: Global Shunt Reactor Industry Revenue Million Forecast, by Form Factor 2019 & 2032
- Table 51: Global Shunt Reactor Industry Revenue Million Forecast, by Rated Voltage 2019 & 2032
- Table 52: Global Shunt Reactor Industry Revenue Million Forecast, by Country 2019 & 2032
Frequently Asked Questions
1. What is the projected Compound Annual Growth Rate (CAGR) of the Shunt Reactor Industry?
The projected CAGR is approximately 6.10%.
2. Which companies are prominent players in the Shunt Reactor Industry?
Key companies in the market include Trench Group, Fuji Electric Co, Hyosung Corporation, Mitsubishi Electric Corporation, CG Power and Industrial Solutions Limited, Siemens AG, Hitachi ABB Power Grids, Hyundai Heavy Industries Co Ltd, TBEA Co Ltd, Alstom SA*List Not Exhaustive.
3. What are the main segments of the Shunt Reactor Industry?
The market segments include Type of Product, Form Factor, Rated Voltage.
4. Can you provide details about the market size?
The market size is estimated to be USD XX Million as of 2022.
5. What are some drivers contributing to market growth?
; Increasing Need for Modernization of Transmission and Distribution Networks; Increased Industrialization of the Developing Nations.
6. What are the notable trends driving market growth?
Variable is Expected to Hold Significant Growth.
7. Are there any restraints impacting market growth?
Shortage of Skilled Workers. Data Security Concerns. and the Initial Investment Costs Hinder Business Operations.
8. Can you provide examples of recent developments in the market?
N/A
9. What pricing options are available for accessing the report?
Pricing options include single-user, multi-user, and enterprise licenses priced at USD 4750, USD 5250, and USD 8750 respectively.
10. Is the market size provided in terms of value or volume?
The market size is provided in terms of value, measured in Million.
11. Are there any specific market keywords associated with the report?
Yes, the market keyword associated with the report is "Shunt Reactor Industry," which aids in identifying and referencing the specific market segment covered.
12. How do I determine which pricing option suits my needs best?
The pricing options vary based on user requirements and access needs. Individual users may opt for single-user licenses, while businesses requiring broader access may choose multi-user or enterprise licenses for cost-effective access to the report.
13. Are there any additional resources or data provided in the Shunt Reactor Industry report?
While the report offers comprehensive insights, it's advisable to review the specific contents or supplementary materials provided to ascertain if additional resources or data are available.
14. How can I stay updated on further developments or reports in the Shunt Reactor Industry?
To stay informed about further developments, trends, and reports in the Shunt Reactor Industry, consider subscribing to industry newsletters, following relevant companies and organizations, or regularly checking reputable industry news sources and publications.
Methodology
Step 1 - Identification of Relevant Samples Size from Population Database


Step 2 - Approaches for Defining Global Market Size (Value, Volume* & Price*)

Note*: In applicable scenarios
Step 3 - Data Sources
Primary Research
- Web Analytics
- Survey Reports
- Research Institute
- Latest Research Reports
- Opinion Leaders
Secondary Research
- Annual Reports
- White Paper
- Latest Press Release
- Industry Association
- Paid Database
- Investor Presentations

Step 4 - Data Triangulation
Involves using different sources of information in order to increase the validity of a study
These sources are likely to be stakeholders in a program - participants, other researchers, program staff, other community members, and so on.
Then we put all data in single framework & apply various statistical tools to find out the dynamic on the market.
During the analysis stage, feedback from the stakeholder groups would be compared to determine areas of agreement as well as areas of divergence


