
Key Insights
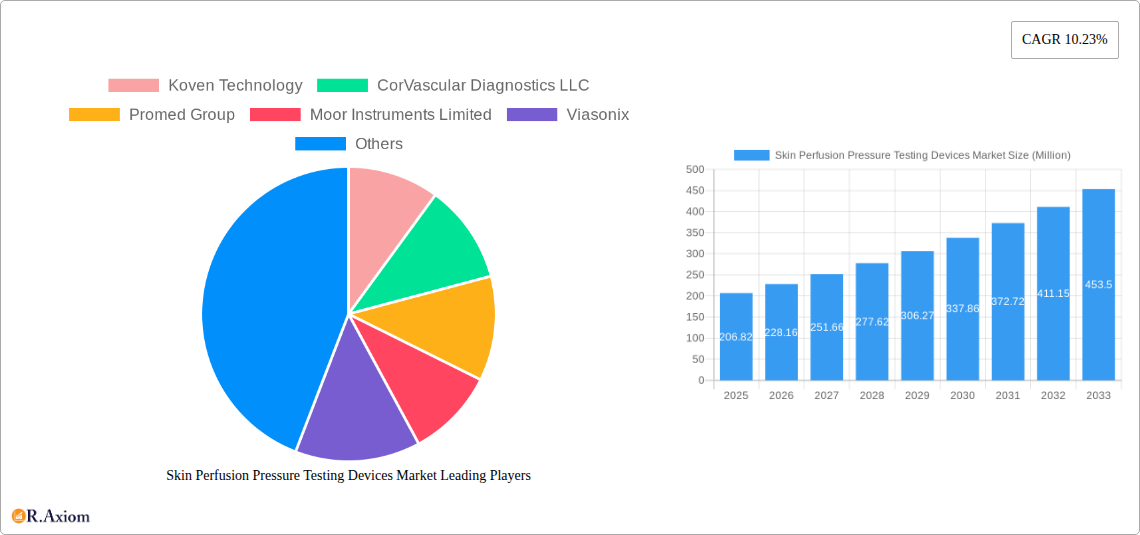
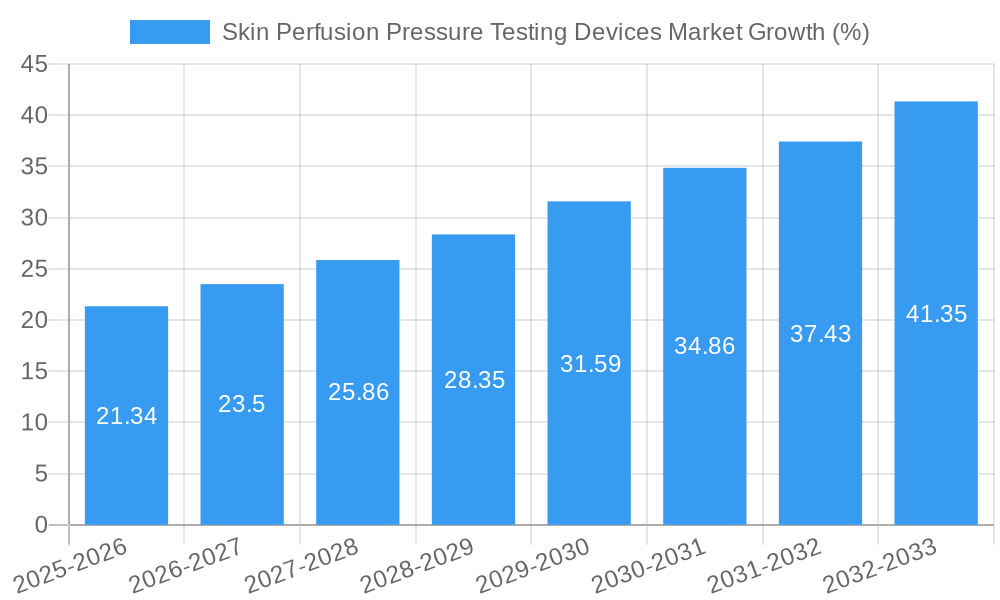
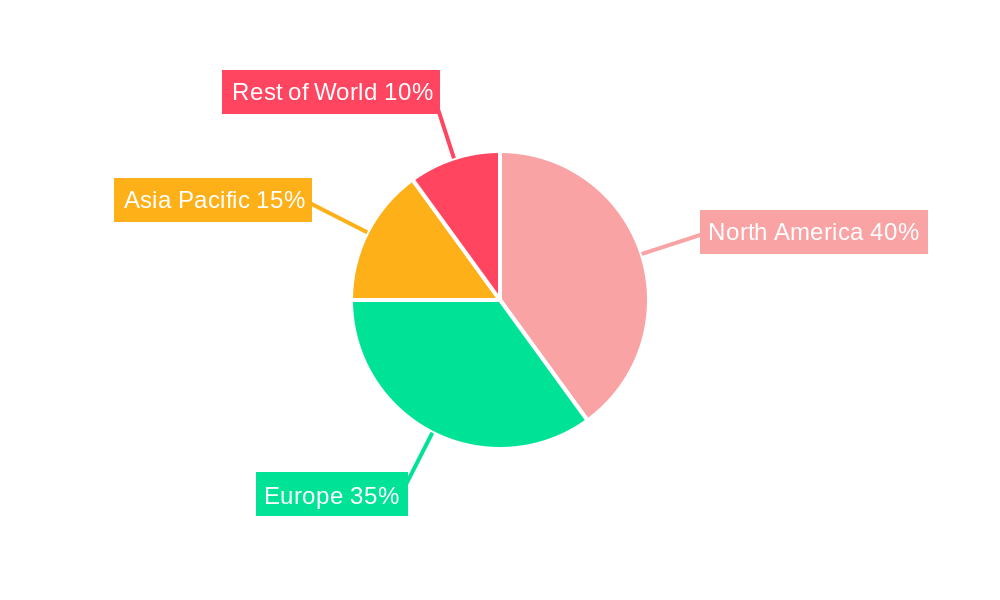
The global skin perfusion pressure testing devices market, valued at $206.82 million in 2025, is projected to experience robust growth, driven by a Compound Annual Growth Rate (CAGR) of 10.23% from 2025 to 2033. This expansion is fueled by several key factors. The increasing prevalence of chronic diseases like diabetes and peripheral artery disease (PAD), which significantly impact skin perfusion, is a primary driver. Advancements in device technology, leading to more portable, user-friendly, and accurate devices, are also boosting market adoption. Furthermore, the rising demand for minimally invasive diagnostic procedures and a growing preference for point-of-care testing are contributing to market growth. The market is segmented by product type (ultrasound, laser Doppler, photoplethysmography), mode (cart-based, portable), and end-user (hospitals, ambulatory surgical centers, research institutions). The portable device segment is anticipated to witness faster growth due to its convenience and suitability for various settings. Hospitals currently hold the largest market share among end-users, but ambulatory surgical centers are expected to exhibit significant growth in the forecast period. Geographically, North America and Europe currently dominate the market, driven by advanced healthcare infrastructure and high adoption rates. However, the Asia-Pacific region is poised for significant growth due to rising healthcare expenditure and increasing awareness of vascular diseases. Competitive landscape analysis reveals key players like Koven Technology, CorVascular Diagnostics LLC, Promed Group, Moor Instruments Limited, and others actively involved in innovation and market expansion.
The market's growth trajectory is expected to be influenced by certain challenges. High device costs and the need for skilled professionals to operate sophisticated equipment might limit widespread adoption in certain regions. Regulatory approvals and reimbursement policies also play a significant role in market dynamics. However, ongoing technological advancements focused on cost reduction and user-friendliness, coupled with increasing government initiatives to improve healthcare infrastructure, are expected to mitigate these restraints and further propel market growth throughout the forecast period. The development of more integrated and advanced devices that provide comprehensive skin perfusion analysis will likely drive further innovation and market expansion in the coming years.
Skin Perfusion Pressure Testing Devices Market: A Comprehensive Report (2019-2033)
This comprehensive report provides a detailed analysis of the Skin Perfusion Pressure Testing Devices market, offering valuable insights into market dynamics, growth drivers, competitive landscape, and future trends. The study period spans from 2019 to 2033, with 2025 serving as the base and estimated year. The report segments the market by product type, mode, and end-user, offering granular data for informed decision-making. The market is projected to reach xx Million by 2033, exhibiting a CAGR of xx% during the forecast period (2025-2033).
Skin Perfusion Pressure Testing Devices Market Market Concentration & Innovation
The Skin Perfusion Pressure Testing Devices market exhibits a moderately concentrated landscape, with key players such as Koven Technology, CorVascular Diagnostics LLC, Promed Group, Moor Instruments Limited, Viasonix, Vasamed, ADInstruments, and Perimed AB holding significant market share. While precise market share data for each player requires in-depth competitive intelligence, preliminary estimates suggest a top five players' share of approximately 60%. Innovation is driven by the need for improved accuracy, portability, and ease of use, leading to the development of advanced technologies like laser Doppler and ultrasound-based devices. Regulatory frameworks, particularly those concerning medical device approvals, significantly influence market growth. Substitutes for skin perfusion pressure testing are limited, although other non-invasive techniques may sometimes be used. End-user trends indicate a preference for portable and user-friendly devices, especially in ambulatory surgical centers. M&A activities in this sector have been relatively modest in recent years, with deal values typically ranging from xx Million to xx Million. The current trend suggests increased consolidation and further innovation in the years to come.
Skin Perfusion Pressure Testing Devices Market Industry Trends & Insights
The Skin Perfusion Pressure Testing Devices market is experiencing robust growth, fueled by rising prevalence of chronic diseases like diabetes and peripheral artery disease (PAD), increasing demand for non-invasive diagnostic tools, and technological advancements. The market is witnessing significant technological disruptions, particularly with the integration of advanced imaging and data analysis capabilities in devices. Consumer preference shifts towards portable, user-friendly, and cost-effective solutions are shaping market trends. Competitive dynamics are marked by ongoing product innovation, strategic partnerships, and expansion into new geographical markets. The global market is anticipated to exhibit strong growth, surpassing xx Million by 2033, reflecting a substantial market penetration increase. The CAGR during the forecast period (2025-2033) is estimated at xx%. This growth is driven by increasing healthcare spending and the need for accurate and efficient monitoring in various healthcare settings.
Dominant Markets & Segments in Skin Perfusion Pressure Testing Devices Market
Leading Region/Country: North America currently dominates the Skin Perfusion Pressure Testing Devices market, driven by high healthcare expenditure, advanced medical infrastructure, and a large patient population suffering from cardiovascular diseases. Europe follows as a significant market.
Dominant Segment (By Product Type): Ultrasound skin perfusion pressure testing devices currently hold the largest market share due to their relatively high accuracy and widespread availability. However, laser Doppler devices are expected to witness substantial growth driven by their non-invasive nature and suitability for various applications.
Dominant Segment (By Mode): Cart-based devices currently dominate due to their established presence and comprehensive functionalities. However, portable devices are rapidly gaining traction because of their convenience and flexibility, particularly in ambulatory settings.
Dominant Segment (By End-User): Hospitals currently account for the largest segment of the market due to higher testing volumes and access to advanced medical equipment. Ambulatory surgical centers are experiencing significant growth, driven by an increasing focus on outpatient procedures.
Key Drivers:
- Robust healthcare infrastructure in developed nations.
- Favorable reimbursement policies.
- Increasing prevalence of chronic vascular diseases.
Skin Perfusion Pressure Testing Devices Market Product Developments
Recent product innovations focus on enhancing accuracy, portability, and ease of use. New devices incorporate advanced imaging and data analysis features, improving diagnostic capabilities. Manufacturers are emphasizing wireless connectivity and integration with electronic health records (EHR) systems. These improvements enhance the devices’ market fit by streamlining workflows and improving diagnostic accuracy, particularly within ambulatory and remote care settings.
Report Scope & Segmentation Analysis
By Product Type: The market is segmented into Ultrasound skin perfusion pressure testing devices, Laser Doppler skin perfusion pressure testing devices, and Photoplethysmography skin perfusion pressure testing devices. Each segment presents unique growth prospects, influenced by technological advancements and clinical preferences. Ultrasound devices hold a substantial market share, but laser Doppler and photoplethysmography devices show promising growth potential.
By Mode: The market is categorized into Cart-based devices and Portable devices. Cart-based devices currently dominate, but portable devices exhibit faster growth, driven by convenience and flexibility.
By End-User: The market is divided into Hospitals, Ambulatory surgical centers, and Others. Hospitals are the largest segment, but ambulatory surgical centers are growing rapidly due to the increasing prevalence of outpatient procedures.
Key Drivers of Skin Perfusion Pressure Testing Devices Market Growth
Technological advancements, particularly in sensor technology and data analysis, are key drivers. Rising prevalence of chronic diseases requiring continuous monitoring, alongside increasing healthcare expenditure and favorable reimbursement policies in many regions, also contribute significantly. Regulatory approvals and standards related to medical devices further influence market growth.
Challenges in the Skin Perfusion Pressure Testing Devices Market Sector
High initial investment costs for advanced devices represent a barrier to entry for smaller players. Stringent regulatory requirements and approval processes can delay product launches and increase development costs. The competitive landscape with established players possessing strong market positions poses a challenge for new entrants. Supply chain disruptions, particularly concerning specific components for these sophisticated devices, are also an ongoing concern.
Emerging Opportunities in Skin Perfusion Pressure Testing Devices Market
The integration of artificial intelligence (AI) and machine learning (ML) for improved diagnostic accuracy presents a significant opportunity. Expansion into emerging markets with increasing healthcare infrastructure investments holds significant potential for growth. Demand for telehealth and remote patient monitoring is creating new avenues for portable, wireless devices. The focus on home healthcare and point-of-care diagnostics provides further growth potential.
Leading Players in the Skin Perfusion Pressure Testing Devices Market Market
- Koven Technology
- CorVascular Diagnostics LLC
- Promed Group
- Moor Instruments Limited
- Viasonix
- Vasamed
- ADInstruments
- Perimed AB
Key Developments in Skin Perfusion Pressure Testing Devices Market Industry
- Jan 2023: Moor Instruments Limited launched a new generation of laser Doppler devices with enhanced features.
- Oct 2022: A strategic partnership between Koven Technology and a major distributor expanded market reach in Asia.
- Further developments will be detailed in the full report.
Strategic Outlook for Skin Perfusion Pressure Testing Devices Market Market
The Skin Perfusion Pressure Testing Devices market presents a promising outlook, driven by technological innovation, increasing disease prevalence, and expanding healthcare infrastructure. Opportunities abound in integrating advanced technologies and expanding into emerging markets. Companies focusing on innovation, strategic partnerships, and addressing unmet clinical needs are well-positioned to capitalize on market growth. The increasing adoption of remote patient monitoring and telehealth solutions will continue to drive demand for portable, user-friendly devices.
Skin Perfusion Pressure Testing Devices Market Segmentation
-
1. Product Type
- 1.1. Ultrasound skin perfusion pressure testing devices
- 1.2. Laser do
- 1.3. Photople
-
2. Mode
- 2.1. Cart-based devices
- 2.2. Portable devices
-
3. End-User
- 3.1. Hospitals
- 3.2. Ambulatory surgical centers
- 3.3. Others
Skin Perfusion Pressure Testing Devices Market Segmentation By Geography
-
1. North America
- 1.1. United States
- 1.2. Canada
- 1.3. Mexico
-
2. Europe
- 2.1. Germany
- 2.2. United Kingdom
- 2.3. France
- 2.4. Italy
- 2.5. Spain
- 2.6. Rest of Europe
-
3. Asia Pacific
- 3.1. China
- 3.2. Japan
- 3.3. India
- 3.4. Australia
- 3.5. South Korea
- 3.6. Rest of Asia Pacific
-
4. Middle East and Africa
- 4.1. GCC
- 4.2. South Africa
- 4.3. Rest of Middle East and Africa
-
5. South America
- 5.1. Brazil
- 5.2. Argentina
- 5.3. Rest of South America
Skin Perfusion Pressure Testing Devices Market REPORT HIGHLIGHTS
| Aspects | Details |
|---|---|
| Study Period | 2019-2033 |
| Base Year | 2024 |
| Estimated Year | 2025 |
| Forecast Period | 2025-2033 |
| Historical Period | 2019-2024 |
| Growth Rate | CAGR of 10.23% from 2019-2033 |
| Segmentation |
|
Table of Contents
- 1. Introduction
- 1.1. Research Scope
- 1.2. Market Segmentation
- 1.3. Research Methodology
- 1.4. Definitions and Assumptions
- 2. Executive Summary
- 2.1. Introduction
- 3. Market Dynamics
- 3.1. Introduction
- 3.2. Market Drivers
- 3.2.1. ; Rising Prevalence of Peripheral Artery Diseases; Increasing Prevalence of Diabetes; Technological Advancements
- 3.3. Market Restrains
- 3.3.1. ; Lack of Skilled Personnels
- 3.4. Market Trends
- 3.4.1. Ambulatory Surgical Centers show Lucrative Opportunity in the Global Skin Perfusion Pressure Testing Devices Market
- 4. Market Factor Analysis
- 4.1. Porters Five Forces
- 4.2. Supply/Value Chain
- 4.3. PESTEL analysis
- 4.4. Market Entropy
- 4.5. Patent/Trademark Analysis
- 5. Global Skin Perfusion Pressure Testing Devices Market Analysis, Insights and Forecast, 2019-2031
- 5.1. Market Analysis, Insights and Forecast - by Product Type
- 5.1.1. Ultrasound skin perfusion pressure testing devices
- 5.1.2. Laser do
- 5.1.3. Photople
- 5.2. Market Analysis, Insights and Forecast - by Mode
- 5.2.1. Cart-based devices
- 5.2.2. Portable devices
- 5.3. Market Analysis, Insights and Forecast - by End-User
- 5.3.1. Hospitals
- 5.3.2. Ambulatory surgical centers
- 5.3.3. Others
- 5.4. Market Analysis, Insights and Forecast - by Region
- 5.4.1. North America
- 5.4.2. Europe
- 5.4.3. Asia Pacific
- 5.4.4. Middle East and Africa
- 5.4.5. South America
- 5.1. Market Analysis, Insights and Forecast - by Product Type
- 6. North America Skin Perfusion Pressure Testing Devices Market Analysis, Insights and Forecast, 2019-2031
- 6.1. Market Analysis, Insights and Forecast - by Product Type
- 6.1.1. Ultrasound skin perfusion pressure testing devices
- 6.1.2. Laser do
- 6.1.3. Photople
- 6.2. Market Analysis, Insights and Forecast - by Mode
- 6.2.1. Cart-based devices
- 6.2.2. Portable devices
- 6.3. Market Analysis, Insights and Forecast - by End-User
- 6.3.1. Hospitals
- 6.3.2. Ambulatory surgical centers
- 6.3.3. Others
- 6.1. Market Analysis, Insights and Forecast - by Product Type
- 7. Europe Skin Perfusion Pressure Testing Devices Market Analysis, Insights and Forecast, 2019-2031
- 7.1. Market Analysis, Insights and Forecast - by Product Type
- 7.1.1. Ultrasound skin perfusion pressure testing devices
- 7.1.2. Laser do
- 7.1.3. Photople
- 7.2. Market Analysis, Insights and Forecast - by Mode
- 7.2.1. Cart-based devices
- 7.2.2. Portable devices
- 7.3. Market Analysis, Insights and Forecast - by End-User
- 7.3.1. Hospitals
- 7.3.2. Ambulatory surgical centers
- 7.3.3. Others
- 7.1. Market Analysis, Insights and Forecast - by Product Type
- 8. Asia Pacific Skin Perfusion Pressure Testing Devices Market Analysis, Insights and Forecast, 2019-2031
- 8.1. Market Analysis, Insights and Forecast - by Product Type
- 8.1.1. Ultrasound skin perfusion pressure testing devices
- 8.1.2. Laser do
- 8.1.3. Photople
- 8.2. Market Analysis, Insights and Forecast - by Mode
- 8.2.1. Cart-based devices
- 8.2.2. Portable devices
- 8.3. Market Analysis, Insights and Forecast - by End-User
- 8.3.1. Hospitals
- 8.3.2. Ambulatory surgical centers
- 8.3.3. Others
- 8.1. Market Analysis, Insights and Forecast - by Product Type
- 9. Middle East and Africa Skin Perfusion Pressure Testing Devices Market Analysis, Insights and Forecast, 2019-2031
- 9.1. Market Analysis, Insights and Forecast - by Product Type
- 9.1.1. Ultrasound skin perfusion pressure testing devices
- 9.1.2. Laser do
- 9.1.3. Photople
- 9.2. Market Analysis, Insights and Forecast - by Mode
- 9.2.1. Cart-based devices
- 9.2.2. Portable devices
- 9.3. Market Analysis, Insights and Forecast - by End-User
- 9.3.1. Hospitals
- 9.3.2. Ambulatory surgical centers
- 9.3.3. Others
- 9.1. Market Analysis, Insights and Forecast - by Product Type
- 10. South America Skin Perfusion Pressure Testing Devices Market Analysis, Insights and Forecast, 2019-2031
- 10.1. Market Analysis, Insights and Forecast - by Product Type
- 10.1.1. Ultrasound skin perfusion pressure testing devices
- 10.1.2. Laser do
- 10.1.3. Photople
- 10.2. Market Analysis, Insights and Forecast - by Mode
- 10.2.1. Cart-based devices
- 10.2.2. Portable devices
- 10.3. Market Analysis, Insights and Forecast - by End-User
- 10.3.1. Hospitals
- 10.3.2. Ambulatory surgical centers
- 10.3.3. Others
- 10.1. Market Analysis, Insights and Forecast - by Product Type
- 11. North Americ Skin Perfusion Pressure Testing Devices Market Analysis, Insights and Forecast, 2019-2031
- 11.1. Market Analysis, Insights and Forecast - By Country/Sub-region
- 11.1.1 United States
- 11.1.2 Canada
- 11.1.3 Mexico
- 12. South America Skin Perfusion Pressure Testing Devices Market Analysis, Insights and Forecast, 2019-2031
- 12.1. Market Analysis, Insights and Forecast - By Country/Sub-region
- 12.1.1 Brazil
- 12.1.2 Mexico
- 12.1.3 Rest of South America
- 13. Asia Pacific Skin Perfusion Pressure Testing Devices Market Analysis, Insights and Forecast, 2019-2031
- 13.1. Market Analysis, Insights and Forecast - By Country/Sub-region
- 13.1.1 China
- 13.1.2 Japan
- 13.1.3 India
- 13.1.4 South Korea
- 13.1.5 Taiwan
- 13.1.6 Australia
- 13.1.7 Rest of Asia-Pacific
- 14. Europe Skin Perfusion Pressure Testing Devices Market Analysis, Insights and Forecast, 2019-2031
- 14.1. Market Analysis, Insights and Forecast - By Country/Sub-region
- 14.1.1 Germany
- 14.1.2 United Kingdom
- 14.1.3 France
- 14.1.4 Italy
- 14.1.5 Spain
- 14.1.6 Rest of Europe
- 15. MEA Skin Perfusion Pressure Testing Devices Market Analysis, Insights and Forecast, 2019-2031
- 15.1. Market Analysis, Insights and Forecast - By Country/Sub-region
- 15.1.1 Middle East
- 15.1.2 Africa
- 16. Competitive Analysis
- 16.1. Global Market Share Analysis 2024
- 16.2. Company Profiles
- 16.2.1 Koven Technology
- 16.2.1.1. Overview
- 16.2.1.2. Products
- 16.2.1.3. SWOT Analysis
- 16.2.1.4. Recent Developments
- 16.2.1.5. Financials (Based on Availability)
- 16.2.2 CorVascular Diagnostics LLC
- 16.2.2.1. Overview
- 16.2.2.2. Products
- 16.2.2.3. SWOT Analysis
- 16.2.2.4. Recent Developments
- 16.2.2.5. Financials (Based on Availability)
- 16.2.3 Promed Group
- 16.2.3.1. Overview
- 16.2.3.2. Products
- 16.2.3.3. SWOT Analysis
- 16.2.3.4. Recent Developments
- 16.2.3.5. Financials (Based on Availability)
- 16.2.4 Moor Instruments Limited
- 16.2.4.1. Overview
- 16.2.4.2. Products
- 16.2.4.3. SWOT Analysis
- 16.2.4.4. Recent Developments
- 16.2.4.5. Financials (Based on Availability)
- 16.2.5 Viasonix
- 16.2.5.1. Overview
- 16.2.5.2. Products
- 16.2.5.3. SWOT Analysis
- 16.2.5.4. Recent Developments
- 16.2.5.5. Financials (Based on Availability)
- 16.2.6 Vasamed
- 16.2.6.1. Overview
- 16.2.6.2. Products
- 16.2.6.3. SWOT Analysis
- 16.2.6.4. Recent Developments
- 16.2.6.5. Financials (Based on Availability)
- 16.2.7 ADInstruments
- 16.2.7.1. Overview
- 16.2.7.2. Products
- 16.2.7.3. SWOT Analysis
- 16.2.7.4. Recent Developments
- 16.2.7.5. Financials (Based on Availability)
- 16.2.8 Perimed AB
- 16.2.8.1. Overview
- 16.2.8.2. Products
- 16.2.8.3. SWOT Analysis
- 16.2.8.4. Recent Developments
- 16.2.8.5. Financials (Based on Availability)
- 16.2.1 Koven Technology
List of Figures
- Figure 1: Global Skin Perfusion Pressure Testing Devices Market Revenue Breakdown (Million, %) by Region 2024 & 2032
- Figure 2: Global Skin Perfusion Pressure Testing Devices Market Volume Breakdown (K Units, %) by Region 2024 & 2032
- Figure 3: North Americ Skin Perfusion Pressure Testing Devices Market Revenue (Million), by Country 2024 & 2032
- Figure 4: North Americ Skin Perfusion Pressure Testing Devices Market Volume (K Units), by Country 2024 & 2032
- Figure 5: North Americ Skin Perfusion Pressure Testing Devices Market Revenue Share (%), by Country 2024 & 2032
- Figure 6: North Americ Skin Perfusion Pressure Testing Devices Market Volume Share (%), by Country 2024 & 2032
- Figure 7: South America Skin Perfusion Pressure Testing Devices Market Revenue (Million), by Country 2024 & 2032
- Figure 8: South America Skin Perfusion Pressure Testing Devices Market Volume (K Units), by Country 2024 & 2032
- Figure 9: South America Skin Perfusion Pressure Testing Devices Market Revenue Share (%), by Country 2024 & 2032
- Figure 10: South America Skin Perfusion Pressure Testing Devices Market Volume Share (%), by Country 2024 & 2032
- Figure 11: Asia Pacific Skin Perfusion Pressure Testing Devices Market Revenue (Million), by Country 2024 & 2032
- Figure 12: Asia Pacific Skin Perfusion Pressure Testing Devices Market Volume (K Units), by Country 2024 & 2032
- Figure 13: Asia Pacific Skin Perfusion Pressure Testing Devices Market Revenue Share (%), by Country 2024 & 2032
- Figure 14: Asia Pacific Skin Perfusion Pressure Testing Devices Market Volume Share (%), by Country 2024 & 2032
- Figure 15: Europe Skin Perfusion Pressure Testing Devices Market Revenue (Million), by Country 2024 & 2032
- Figure 16: Europe Skin Perfusion Pressure Testing Devices Market Volume (K Units), by Country 2024 & 2032
- Figure 17: Europe Skin Perfusion Pressure Testing Devices Market Revenue Share (%), by Country 2024 & 2032
- Figure 18: Europe Skin Perfusion Pressure Testing Devices Market Volume Share (%), by Country 2024 & 2032
- Figure 19: MEA Skin Perfusion Pressure Testing Devices Market Revenue (Million), by Country 2024 & 2032
- Figure 20: MEA Skin Perfusion Pressure Testing Devices Market Volume (K Units), by Country 2024 & 2032
- Figure 21: MEA Skin Perfusion Pressure Testing Devices Market Revenue Share (%), by Country 2024 & 2032
- Figure 22: MEA Skin Perfusion Pressure Testing Devices Market Volume Share (%), by Country 2024 & 2032
- Figure 23: North America Skin Perfusion Pressure Testing Devices Market Revenue (Million), by Product Type 2024 & 2032
- Figure 24: North America Skin Perfusion Pressure Testing Devices Market Volume (K Units), by Product Type 2024 & 2032
- Figure 25: North America Skin Perfusion Pressure Testing Devices Market Revenue Share (%), by Product Type 2024 & 2032
- Figure 26: North America Skin Perfusion Pressure Testing Devices Market Volume Share (%), by Product Type 2024 & 2032
- Figure 27: North America Skin Perfusion Pressure Testing Devices Market Revenue (Million), by Mode 2024 & 2032
- Figure 28: North America Skin Perfusion Pressure Testing Devices Market Volume (K Units), by Mode 2024 & 2032
- Figure 29: North America Skin Perfusion Pressure Testing Devices Market Revenue Share (%), by Mode 2024 & 2032
- Figure 30: North America Skin Perfusion Pressure Testing Devices Market Volume Share (%), by Mode 2024 & 2032
- Figure 31: North America Skin Perfusion Pressure Testing Devices Market Revenue (Million), by End-User 2024 & 2032
- Figure 32: North America Skin Perfusion Pressure Testing Devices Market Volume (K Units), by End-User 2024 & 2032
- Figure 33: North America Skin Perfusion Pressure Testing Devices Market Revenue Share (%), by End-User 2024 & 2032
- Figure 34: North America Skin Perfusion Pressure Testing Devices Market Volume Share (%), by End-User 2024 & 2032
- Figure 35: North America Skin Perfusion Pressure Testing Devices Market Revenue (Million), by Country 2024 & 2032
- Figure 36: North America Skin Perfusion Pressure Testing Devices Market Volume (K Units), by Country 2024 & 2032
- Figure 37: North America Skin Perfusion Pressure Testing Devices Market Revenue Share (%), by Country 2024 & 2032
- Figure 38: North America Skin Perfusion Pressure Testing Devices Market Volume Share (%), by Country 2024 & 2032
- Figure 39: Europe Skin Perfusion Pressure Testing Devices Market Revenue (Million), by Product Type 2024 & 2032
- Figure 40: Europe Skin Perfusion Pressure Testing Devices Market Volume (K Units), by Product Type 2024 & 2032
- Figure 41: Europe Skin Perfusion Pressure Testing Devices Market Revenue Share (%), by Product Type 2024 & 2032
- Figure 42: Europe Skin Perfusion Pressure Testing Devices Market Volume Share (%), by Product Type 2024 & 2032
- Figure 43: Europe Skin Perfusion Pressure Testing Devices Market Revenue (Million), by Mode 2024 & 2032
- Figure 44: Europe Skin Perfusion Pressure Testing Devices Market Volume (K Units), by Mode 2024 & 2032
- Figure 45: Europe Skin Perfusion Pressure Testing Devices Market Revenue Share (%), by Mode 2024 & 2032
- Figure 46: Europe Skin Perfusion Pressure Testing Devices Market Volume Share (%), by Mode 2024 & 2032
- Figure 47: Europe Skin Perfusion Pressure Testing Devices Market Revenue (Million), by End-User 2024 & 2032
- Figure 48: Europe Skin Perfusion Pressure Testing Devices Market Volume (K Units), by End-User 2024 & 2032
- Figure 49: Europe Skin Perfusion Pressure Testing Devices Market Revenue Share (%), by End-User 2024 & 2032
- Figure 50: Europe Skin Perfusion Pressure Testing Devices Market Volume Share (%), by End-User 2024 & 2032
- Figure 51: Europe Skin Perfusion Pressure Testing Devices Market Revenue (Million), by Country 2024 & 2032
- Figure 52: Europe Skin Perfusion Pressure Testing Devices Market Volume (K Units), by Country 2024 & 2032
- Figure 53: Europe Skin Perfusion Pressure Testing Devices Market Revenue Share (%), by Country 2024 & 2032
- Figure 54: Europe Skin Perfusion Pressure Testing Devices Market Volume Share (%), by Country 2024 & 2032
- Figure 55: Asia Pacific Skin Perfusion Pressure Testing Devices Market Revenue (Million), by Product Type 2024 & 2032
- Figure 56: Asia Pacific Skin Perfusion Pressure Testing Devices Market Volume (K Units), by Product Type 2024 & 2032
- Figure 57: Asia Pacific Skin Perfusion Pressure Testing Devices Market Revenue Share (%), by Product Type 2024 & 2032
- Figure 58: Asia Pacific Skin Perfusion Pressure Testing Devices Market Volume Share (%), by Product Type 2024 & 2032
- Figure 59: Asia Pacific Skin Perfusion Pressure Testing Devices Market Revenue (Million), by Mode 2024 & 2032
- Figure 60: Asia Pacific Skin Perfusion Pressure Testing Devices Market Volume (K Units), by Mode 2024 & 2032
- Figure 61: Asia Pacific Skin Perfusion Pressure Testing Devices Market Revenue Share (%), by Mode 2024 & 2032
- Figure 62: Asia Pacific Skin Perfusion Pressure Testing Devices Market Volume Share (%), by Mode 2024 & 2032
- Figure 63: Asia Pacific Skin Perfusion Pressure Testing Devices Market Revenue (Million), by End-User 2024 & 2032
- Figure 64: Asia Pacific Skin Perfusion Pressure Testing Devices Market Volume (K Units), by End-User 2024 & 2032
- Figure 65: Asia Pacific Skin Perfusion Pressure Testing Devices Market Revenue Share (%), by End-User 2024 & 2032
- Figure 66: Asia Pacific Skin Perfusion Pressure Testing Devices Market Volume Share (%), by End-User 2024 & 2032
- Figure 67: Asia Pacific Skin Perfusion Pressure Testing Devices Market Revenue (Million), by Country 2024 & 2032
- Figure 68: Asia Pacific Skin Perfusion Pressure Testing Devices Market Volume (K Units), by Country 2024 & 2032
- Figure 69: Asia Pacific Skin Perfusion Pressure Testing Devices Market Revenue Share (%), by Country 2024 & 2032
- Figure 70: Asia Pacific Skin Perfusion Pressure Testing Devices Market Volume Share (%), by Country 2024 & 2032
- Figure 71: Middle East and Africa Skin Perfusion Pressure Testing Devices Market Revenue (Million), by Product Type 2024 & 2032
- Figure 72: Middle East and Africa Skin Perfusion Pressure Testing Devices Market Volume (K Units), by Product Type 2024 & 2032
- Figure 73: Middle East and Africa Skin Perfusion Pressure Testing Devices Market Revenue Share (%), by Product Type 2024 & 2032
- Figure 74: Middle East and Africa Skin Perfusion Pressure Testing Devices Market Volume Share (%), by Product Type 2024 & 2032
- Figure 75: Middle East and Africa Skin Perfusion Pressure Testing Devices Market Revenue (Million), by Mode 2024 & 2032
- Figure 76: Middle East and Africa Skin Perfusion Pressure Testing Devices Market Volume (K Units), by Mode 2024 & 2032
- Figure 77: Middle East and Africa Skin Perfusion Pressure Testing Devices Market Revenue Share (%), by Mode 2024 & 2032
- Figure 78: Middle East and Africa Skin Perfusion Pressure Testing Devices Market Volume Share (%), by Mode 2024 & 2032
- Figure 79: Middle East and Africa Skin Perfusion Pressure Testing Devices Market Revenue (Million), by End-User 2024 & 2032
- Figure 80: Middle East and Africa Skin Perfusion Pressure Testing Devices Market Volume (K Units), by End-User 2024 & 2032
- Figure 81: Middle East and Africa Skin Perfusion Pressure Testing Devices Market Revenue Share (%), by End-User 2024 & 2032
- Figure 82: Middle East and Africa Skin Perfusion Pressure Testing Devices Market Volume Share (%), by End-User 2024 & 2032
- Figure 83: Middle East and Africa Skin Perfusion Pressure Testing Devices Market Revenue (Million), by Country 2024 & 2032
- Figure 84: Middle East and Africa Skin Perfusion Pressure Testing Devices Market Volume (K Units), by Country 2024 & 2032
- Figure 85: Middle East and Africa Skin Perfusion Pressure Testing Devices Market Revenue Share (%), by Country 2024 & 2032
- Figure 86: Middle East and Africa Skin Perfusion Pressure Testing Devices Market Volume Share (%), by Country 2024 & 2032
- Figure 87: South America Skin Perfusion Pressure Testing Devices Market Revenue (Million), by Product Type 2024 & 2032
- Figure 88: South America Skin Perfusion Pressure Testing Devices Market Volume (K Units), by Product Type 2024 & 2032
- Figure 89: South America Skin Perfusion Pressure Testing Devices Market Revenue Share (%), by Product Type 2024 & 2032
- Figure 90: South America Skin Perfusion Pressure Testing Devices Market Volume Share (%), by Product Type 2024 & 2032
- Figure 91: South America Skin Perfusion Pressure Testing Devices Market Revenue (Million), by Mode 2024 & 2032
- Figure 92: South America Skin Perfusion Pressure Testing Devices Market Volume (K Units), by Mode 2024 & 2032
- Figure 93: South America Skin Perfusion Pressure Testing Devices Market Revenue Share (%), by Mode 2024 & 2032
- Figure 94: South America Skin Perfusion Pressure Testing Devices Market Volume Share (%), by Mode 2024 & 2032
- Figure 95: South America Skin Perfusion Pressure Testing Devices Market Revenue (Million), by End-User 2024 & 2032
- Figure 96: South America Skin Perfusion Pressure Testing Devices Market Volume (K Units), by End-User 2024 & 2032
- Figure 97: South America Skin Perfusion Pressure Testing Devices Market Revenue Share (%), by End-User 2024 & 2032
- Figure 98: South America Skin Perfusion Pressure Testing Devices Market Volume Share (%), by End-User 2024 & 2032
- Figure 99: South America Skin Perfusion Pressure Testing Devices Market Revenue (Million), by Country 2024 & 2032
- Figure 100: South America Skin Perfusion Pressure Testing Devices Market Volume (K Units), by Country 2024 & 2032
- Figure 101: South America Skin Perfusion Pressure Testing Devices Market Revenue Share (%), by Country 2024 & 2032
- Figure 102: South America Skin Perfusion Pressure Testing Devices Market Volume Share (%), by Country 2024 & 2032
List of Tables
- Table 1: Global Skin Perfusion Pressure Testing Devices Market Revenue Million Forecast, by Region 2019 & 2032
- Table 2: Global Skin Perfusion Pressure Testing Devices Market Volume K Units Forecast, by Region 2019 & 2032
- Table 3: Global Skin Perfusion Pressure Testing Devices Market Revenue Million Forecast, by Product Type 2019 & 2032
- Table 4: Global Skin Perfusion Pressure Testing Devices Market Volume K Units Forecast, by Product Type 2019 & 2032
- Table 5: Global Skin Perfusion Pressure Testing Devices Market Revenue Million Forecast, by Mode 2019 & 2032
- Table 6: Global Skin Perfusion Pressure Testing Devices Market Volume K Units Forecast, by Mode 2019 & 2032
- Table 7: Global Skin Perfusion Pressure Testing Devices Market Revenue Million Forecast, by End-User 2019 & 2032
- Table 8: Global Skin Perfusion Pressure Testing Devices Market Volume K Units Forecast, by End-User 2019 & 2032
- Table 9: Global Skin Perfusion Pressure Testing Devices Market Revenue Million Forecast, by Region 2019 & 2032
- Table 10: Global Skin Perfusion Pressure Testing Devices Market Volume K Units Forecast, by Region 2019 & 2032
- Table 11: Global Skin Perfusion Pressure Testing Devices Market Revenue Million Forecast, by Country 2019 & 2032
- Table 12: Global Skin Perfusion Pressure Testing Devices Market Volume K Units Forecast, by Country 2019 & 2032
- Table 13: United States Skin Perfusion Pressure Testing Devices Market Revenue (Million) Forecast, by Application 2019 & 2032
- Table 14: United States Skin Perfusion Pressure Testing Devices Market Volume (K Units) Forecast, by Application 2019 & 2032
- Table 15: Canada Skin Perfusion Pressure Testing Devices Market Revenue (Million) Forecast, by Application 2019 & 2032
- Table 16: Canada Skin Perfusion Pressure Testing Devices Market Volume (K Units) Forecast, by Application 2019 & 2032
- Table 17: Mexico Skin Perfusion Pressure Testing Devices Market Revenue (Million) Forecast, by Application 2019 & 2032
- Table 18: Mexico Skin Perfusion Pressure Testing Devices Market Volume (K Units) Forecast, by Application 2019 & 2032
- Table 19: Global Skin Perfusion Pressure Testing Devices Market Revenue Million Forecast, by Country 2019 & 2032
- Table 20: Global Skin Perfusion Pressure Testing Devices Market Volume K Units Forecast, by Country 2019 & 2032
- Table 21: Brazil Skin Perfusion Pressure Testing Devices Market Revenue (Million) Forecast, by Application 2019 & 2032
- Table 22: Brazil Skin Perfusion Pressure Testing Devices Market Volume (K Units) Forecast, by Application 2019 & 2032
- Table 23: Mexico Skin Perfusion Pressure Testing Devices Market Revenue (Million) Forecast, by Application 2019 & 2032
- Table 24: Mexico Skin Perfusion Pressure Testing Devices Market Volume (K Units) Forecast, by Application 2019 & 2032
- Table 25: Rest of South America Skin Perfusion Pressure Testing Devices Market Revenue (Million) Forecast, by Application 2019 & 2032
- Table 26: Rest of South America Skin Perfusion Pressure Testing Devices Market Volume (K Units) Forecast, by Application 2019 & 2032
- Table 27: Global Skin Perfusion Pressure Testing Devices Market Revenue Million Forecast, by Country 2019 & 2032
- Table 28: Global Skin Perfusion Pressure Testing Devices Market Volume K Units Forecast, by Country 2019 & 2032
- Table 29: China Skin Perfusion Pressure Testing Devices Market Revenue (Million) Forecast, by Application 2019 & 2032
- Table 30: China Skin Perfusion Pressure Testing Devices Market Volume (K Units) Forecast, by Application 2019 & 2032
- Table 31: Japan Skin Perfusion Pressure Testing Devices Market Revenue (Million) Forecast, by Application 2019 & 2032
- Table 32: Japan Skin Perfusion Pressure Testing Devices Market Volume (K Units) Forecast, by Application 2019 & 2032
- Table 33: India Skin Perfusion Pressure Testing Devices Market Revenue (Million) Forecast, by Application 2019 & 2032
- Table 34: India Skin Perfusion Pressure Testing Devices Market Volume (K Units) Forecast, by Application 2019 & 2032
- Table 35: South Korea Skin Perfusion Pressure Testing Devices Market Revenue (Million) Forecast, by Application 2019 & 2032
- Table 36: South Korea Skin Perfusion Pressure Testing Devices Market Volume (K Units) Forecast, by Application 2019 & 2032
- Table 37: Taiwan Skin Perfusion Pressure Testing Devices Market Revenue (Million) Forecast, by Application 2019 & 2032
- Table 38: Taiwan Skin Perfusion Pressure Testing Devices Market Volume (K Units) Forecast, by Application 2019 & 2032
- Table 39: Australia Skin Perfusion Pressure Testing Devices Market Revenue (Million) Forecast, by Application 2019 & 2032
- Table 40: Australia Skin Perfusion Pressure Testing Devices Market Volume (K Units) Forecast, by Application 2019 & 2032
- Table 41: Rest of Asia-Pacific Skin Perfusion Pressure Testing Devices Market Revenue (Million) Forecast, by Application 2019 & 2032
- Table 42: Rest of Asia-Pacific Skin Perfusion Pressure Testing Devices Market Volume (K Units) Forecast, by Application 2019 & 2032
- Table 43: Global Skin Perfusion Pressure Testing Devices Market Revenue Million Forecast, by Country 2019 & 2032
- Table 44: Global Skin Perfusion Pressure Testing Devices Market Volume K Units Forecast, by Country 2019 & 2032
- Table 45: Germany Skin Perfusion Pressure Testing Devices Market Revenue (Million) Forecast, by Application 2019 & 2032
- Table 46: Germany Skin Perfusion Pressure Testing Devices Market Volume (K Units) Forecast, by Application 2019 & 2032
- Table 47: United Kingdom Skin Perfusion Pressure Testing Devices Market Revenue (Million) Forecast, by Application 2019 & 2032
- Table 48: United Kingdom Skin Perfusion Pressure Testing Devices Market Volume (K Units) Forecast, by Application 2019 & 2032
- Table 49: France Skin Perfusion Pressure Testing Devices Market Revenue (Million) Forecast, by Application 2019 & 2032
- Table 50: France Skin Perfusion Pressure Testing Devices Market Volume (K Units) Forecast, by Application 2019 & 2032
- Table 51: Italy Skin Perfusion Pressure Testing Devices Market Revenue (Million) Forecast, by Application 2019 & 2032
- Table 52: Italy Skin Perfusion Pressure Testing Devices Market Volume (K Units) Forecast, by Application 2019 & 2032
- Table 53: Spain Skin Perfusion Pressure Testing Devices Market Revenue (Million) Forecast, by Application 2019 & 2032
- Table 54: Spain Skin Perfusion Pressure Testing Devices Market Volume (K Units) Forecast, by Application 2019 & 2032
- Table 55: Rest of Europe Skin Perfusion Pressure Testing Devices Market Revenue (Million) Forecast, by Application 2019 & 2032
- Table 56: Rest of Europe Skin Perfusion Pressure Testing Devices Market Volume (K Units) Forecast, by Application 2019 & 2032
- Table 57: Global Skin Perfusion Pressure Testing Devices Market Revenue Million Forecast, by Country 2019 & 2032
- Table 58: Global Skin Perfusion Pressure Testing Devices Market Volume K Units Forecast, by Country 2019 & 2032
- Table 59: Middle East Skin Perfusion Pressure Testing Devices Market Revenue (Million) Forecast, by Application 2019 & 2032
- Table 60: Middle East Skin Perfusion Pressure Testing Devices Market Volume (K Units) Forecast, by Application 2019 & 2032
- Table 61: Africa Skin Perfusion Pressure Testing Devices Market Revenue (Million) Forecast, by Application 2019 & 2032
- Table 62: Africa Skin Perfusion Pressure Testing Devices Market Volume (K Units) Forecast, by Application 2019 & 2032
- Table 63: Global Skin Perfusion Pressure Testing Devices Market Revenue Million Forecast, by Product Type 2019 & 2032
- Table 64: Global Skin Perfusion Pressure Testing Devices Market Volume K Units Forecast, by Product Type 2019 & 2032
- Table 65: Global Skin Perfusion Pressure Testing Devices Market Revenue Million Forecast, by Mode 2019 & 2032
- Table 66: Global Skin Perfusion Pressure Testing Devices Market Volume K Units Forecast, by Mode 2019 & 2032
- Table 67: Global Skin Perfusion Pressure Testing Devices Market Revenue Million Forecast, by End-User 2019 & 2032
- Table 68: Global Skin Perfusion Pressure Testing Devices Market Volume K Units Forecast, by End-User 2019 & 2032
- Table 69: Global Skin Perfusion Pressure Testing Devices Market Revenue Million Forecast, by Country 2019 & 2032
- Table 70: Global Skin Perfusion Pressure Testing Devices Market Volume K Units Forecast, by Country 2019 & 2032
- Table 71: United States Skin Perfusion Pressure Testing Devices Market Revenue (Million) Forecast, by Application 2019 & 2032
- Table 72: United States Skin Perfusion Pressure Testing Devices Market Volume (K Units) Forecast, by Application 2019 & 2032
- Table 73: Canada Skin Perfusion Pressure Testing Devices Market Revenue (Million) Forecast, by Application 2019 & 2032
- Table 74: Canada Skin Perfusion Pressure Testing Devices Market Volume (K Units) Forecast, by Application 2019 & 2032
- Table 75: Mexico Skin Perfusion Pressure Testing Devices Market Revenue (Million) Forecast, by Application 2019 & 2032
- Table 76: Mexico Skin Perfusion Pressure Testing Devices Market Volume (K Units) Forecast, by Application 2019 & 2032
- Table 77: Global Skin Perfusion Pressure Testing Devices Market Revenue Million Forecast, by Product Type 2019 & 2032
- Table 78: Global Skin Perfusion Pressure Testing Devices Market Volume K Units Forecast, by Product Type 2019 & 2032
- Table 79: Global Skin Perfusion Pressure Testing Devices Market Revenue Million Forecast, by Mode 2019 & 2032
- Table 80: Global Skin Perfusion Pressure Testing Devices Market Volume K Units Forecast, by Mode 2019 & 2032
- Table 81: Global Skin Perfusion Pressure Testing Devices Market Revenue Million Forecast, by End-User 2019 & 2032
- Table 82: Global Skin Perfusion Pressure Testing Devices Market Volume K Units Forecast, by End-User 2019 & 2032
- Table 83: Global Skin Perfusion Pressure Testing Devices Market Revenue Million Forecast, by Country 2019 & 2032
- Table 84: Global Skin Perfusion Pressure Testing Devices Market Volume K Units Forecast, by Country 2019 & 2032
- Table 85: Germany Skin Perfusion Pressure Testing Devices Market Revenue (Million) Forecast, by Application 2019 & 2032
- Table 86: Germany Skin Perfusion Pressure Testing Devices Market Volume (K Units) Forecast, by Application 2019 & 2032
- Table 87: United Kingdom Skin Perfusion Pressure Testing Devices Market Revenue (Million) Forecast, by Application 2019 & 2032
- Table 88: United Kingdom Skin Perfusion Pressure Testing Devices Market Volume (K Units) Forecast, by Application 2019 & 2032
- Table 89: France Skin Perfusion Pressure Testing Devices Market Revenue (Million) Forecast, by Application 2019 & 2032
- Table 90: France Skin Perfusion Pressure Testing Devices Market Volume (K Units) Forecast, by Application 2019 & 2032
- Table 91: Italy Skin Perfusion Pressure Testing Devices Market Revenue (Million) Forecast, by Application 2019 & 2032
- Table 92: Italy Skin Perfusion Pressure Testing Devices Market Volume (K Units) Forecast, by Application 2019 & 2032
- Table 93: Spain Skin Perfusion Pressure Testing Devices Market Revenue (Million) Forecast, by Application 2019 & 2032
- Table 94: Spain Skin Perfusion Pressure Testing Devices Market Volume (K Units) Forecast, by Application 2019 & 2032
- Table 95: Rest of Europe Skin Perfusion Pressure Testing Devices Market Revenue (Million) Forecast, by Application 2019 & 2032
- Table 96: Rest of Europe Skin Perfusion Pressure Testing Devices Market Volume (K Units) Forecast, by Application 2019 & 2032
- Table 97: Global Skin Perfusion Pressure Testing Devices Market Revenue Million Forecast, by Product Type 2019 & 2032
- Table 98: Global Skin Perfusion Pressure Testing Devices Market Volume K Units Forecast, by Product Type 2019 & 2032
- Table 99: Global Skin Perfusion Pressure Testing Devices Market Revenue Million Forecast, by Mode 2019 & 2032
- Table 100: Global Skin Perfusion Pressure Testing Devices Market Volume K Units Forecast, by Mode 2019 & 2032
- Table 101: Global Skin Perfusion Pressure Testing Devices Market Revenue Million Forecast, by End-User 2019 & 2032
- Table 102: Global Skin Perfusion Pressure Testing Devices Market Volume K Units Forecast, by End-User 2019 & 2032
- Table 103: Global Skin Perfusion Pressure Testing Devices Market Revenue Million Forecast, by Country 2019 & 2032
- Table 104: Global Skin Perfusion Pressure Testing Devices Market Volume K Units Forecast, by Country 2019 & 2032
- Table 105: China Skin Perfusion Pressure Testing Devices Market Revenue (Million) Forecast, by Application 2019 & 2032
- Table 106: China Skin Perfusion Pressure Testing Devices Market Volume (K Units) Forecast, by Application 2019 & 2032
- Table 107: Japan Skin Perfusion Pressure Testing Devices Market Revenue (Million) Forecast, by Application 2019 & 2032
- Table 108: Japan Skin Perfusion Pressure Testing Devices Market Volume (K Units) Forecast, by Application 2019 & 2032
- Table 109: India Skin Perfusion Pressure Testing Devices Market Revenue (Million) Forecast, by Application 2019 & 2032
- Table 110: India Skin Perfusion Pressure Testing Devices Market Volume (K Units) Forecast, by Application 2019 & 2032
- Table 111: Australia Skin Perfusion Pressure Testing Devices Market Revenue (Million) Forecast, by Application 2019 & 2032
- Table 112: Australia Skin Perfusion Pressure Testing Devices Market Volume (K Units) Forecast, by Application 2019 & 2032
- Table 113: South Korea Skin Perfusion Pressure Testing Devices Market Revenue (Million) Forecast, by Application 2019 & 2032
- Table 114: South Korea Skin Perfusion Pressure Testing Devices Market Volume (K Units) Forecast, by Application 2019 & 2032
- Table 115: Rest of Asia Pacific Skin Perfusion Pressure Testing Devices Market Revenue (Million) Forecast, by Application 2019 & 2032
- Table 116: Rest of Asia Pacific Skin Perfusion Pressure Testing Devices Market Volume (K Units) Forecast, by Application 2019 & 2032
- Table 117: Global Skin Perfusion Pressure Testing Devices Market Revenue Million Forecast, by Product Type 2019 & 2032
- Table 118: Global Skin Perfusion Pressure Testing Devices Market Volume K Units Forecast, by Product Type 2019 & 2032
- Table 119: Global Skin Perfusion Pressure Testing Devices Market Revenue Million Forecast, by Mode 2019 & 2032
- Table 120: Global Skin Perfusion Pressure Testing Devices Market Volume K Units Forecast, by Mode 2019 & 2032
- Table 121: Global Skin Perfusion Pressure Testing Devices Market Revenue Million Forecast, by End-User 2019 & 2032
- Table 122: Global Skin Perfusion Pressure Testing Devices Market Volume K Units Forecast, by End-User 2019 & 2032
- Table 123: Global Skin Perfusion Pressure Testing Devices Market Revenue Million Forecast, by Country 2019 & 2032
- Table 124: Global Skin Perfusion Pressure Testing Devices Market Volume K Units Forecast, by Country 2019 & 2032
- Table 125: GCC Skin Perfusion Pressure Testing Devices Market Revenue (Million) Forecast, by Application 2019 & 2032
- Table 126: GCC Skin Perfusion Pressure Testing Devices Market Volume (K Units) Forecast, by Application 2019 & 2032
- Table 127: South Africa Skin Perfusion Pressure Testing Devices Market Revenue (Million) Forecast, by Application 2019 & 2032
- Table 128: South Africa Skin Perfusion Pressure Testing Devices Market Volume (K Units) Forecast, by Application 2019 & 2032
- Table 129: Rest of Middle East and Africa Skin Perfusion Pressure Testing Devices Market Revenue (Million) Forecast, by Application 2019 & 2032
- Table 130: Rest of Middle East and Africa Skin Perfusion Pressure Testing Devices Market Volume (K Units) Forecast, by Application 2019 & 2032
- Table 131: Global Skin Perfusion Pressure Testing Devices Market Revenue Million Forecast, by Product Type 2019 & 2032
- Table 132: Global Skin Perfusion Pressure Testing Devices Market Volume K Units Forecast, by Product Type 2019 & 2032
- Table 133: Global Skin Perfusion Pressure Testing Devices Market Revenue Million Forecast, by Mode 2019 & 2032
- Table 134: Global Skin Perfusion Pressure Testing Devices Market Volume K Units Forecast, by Mode 2019 & 2032
- Table 135: Global Skin Perfusion Pressure Testing Devices Market Revenue Million Forecast, by End-User 2019 & 2032
- Table 136: Global Skin Perfusion Pressure Testing Devices Market Volume K Units Forecast, by End-User 2019 & 2032
- Table 137: Global Skin Perfusion Pressure Testing Devices Market Revenue Million Forecast, by Country 2019 & 2032
- Table 138: Global Skin Perfusion Pressure Testing Devices Market Volume K Units Forecast, by Country 2019 & 2032
- Table 139: Brazil Skin Perfusion Pressure Testing Devices Market Revenue (Million) Forecast, by Application 2019 & 2032
- Table 140: Brazil Skin Perfusion Pressure Testing Devices Market Volume (K Units) Forecast, by Application 2019 & 2032
- Table 141: Argentina Skin Perfusion Pressure Testing Devices Market Revenue (Million) Forecast, by Application 2019 & 2032
- Table 142: Argentina Skin Perfusion Pressure Testing Devices Market Volume (K Units) Forecast, by Application 2019 & 2032
- Table 143: Rest of South America Skin Perfusion Pressure Testing Devices Market Revenue (Million) Forecast, by Application 2019 & 2032
- Table 144: Rest of South America Skin Perfusion Pressure Testing Devices Market Volume (K Units) Forecast, by Application 2019 & 2032
Frequently Asked Questions
1. What is the projected Compound Annual Growth Rate (CAGR) of the Skin Perfusion Pressure Testing Devices Market?
The projected CAGR is approximately 10.23%.
2. Which companies are prominent players in the Skin Perfusion Pressure Testing Devices Market?
Key companies in the market include Koven Technology, CorVascular Diagnostics LLC, Promed Group, Moor Instruments Limited, Viasonix, Vasamed, ADInstruments, Perimed AB.
3. What are the main segments of the Skin Perfusion Pressure Testing Devices Market?
The market segments include Product Type, Mode, End-User.
4. Can you provide details about the market size?
The market size is estimated to be USD 206.82 Million as of 2022.
5. What are some drivers contributing to market growth?
; Rising Prevalence of Peripheral Artery Diseases; Increasing Prevalence of Diabetes; Technological Advancements.
6. What are the notable trends driving market growth?
Ambulatory Surgical Centers show Lucrative Opportunity in the Global Skin Perfusion Pressure Testing Devices Market.
7. Are there any restraints impacting market growth?
; Lack of Skilled Personnels.
8. Can you provide examples of recent developments in the market?
N/A
9. What pricing options are available for accessing the report?
Pricing options include single-user, multi-user, and enterprise licenses priced at USD 4750, USD 5250, and USD 8750 respectively.
10. Is the market size provided in terms of value or volume?
The market size is provided in terms of value, measured in Million and volume, measured in K Units.
11. Are there any specific market keywords associated with the report?
Yes, the market keyword associated with the report is "Skin Perfusion Pressure Testing Devices Market," which aids in identifying and referencing the specific market segment covered.
12. How do I determine which pricing option suits my needs best?
The pricing options vary based on user requirements and access needs. Individual users may opt for single-user licenses, while businesses requiring broader access may choose multi-user or enterprise licenses for cost-effective access to the report.
13. Are there any additional resources or data provided in the Skin Perfusion Pressure Testing Devices Market report?
While the report offers comprehensive insights, it's advisable to review the specific contents or supplementary materials provided to ascertain if additional resources or data are available.
14. How can I stay updated on further developments or reports in the Skin Perfusion Pressure Testing Devices Market?
To stay informed about further developments, trends, and reports in the Skin Perfusion Pressure Testing Devices Market, consider subscribing to industry newsletters, following relevant companies and organizations, or regularly checking reputable industry news sources and publications.
Methodology
Step 1 - Identification of Relevant Samples Size from Population Database


Step 2 - Approaches for Defining Global Market Size (Value, Volume* & Price*)

Note*: In applicable scenarios
Step 3 - Data Sources
Primary Research
- Web Analytics
- Survey Reports
- Research Institute
- Latest Research Reports
- Opinion Leaders
Secondary Research
- Annual Reports
- White Paper
- Latest Press Release
- Industry Association
- Paid Database
- Investor Presentations

Step 4 - Data Triangulation
Involves using different sources of information in order to increase the validity of a study
These sources are likely to be stakeholders in a program - participants, other researchers, program staff, other community members, and so on.
Then we put all data in single framework & apply various statistical tools to find out the dynamic on the market.
During the analysis stage, feedback from the stakeholder groups would be compared to determine areas of agreement as well as areas of divergence


