
Key Insights
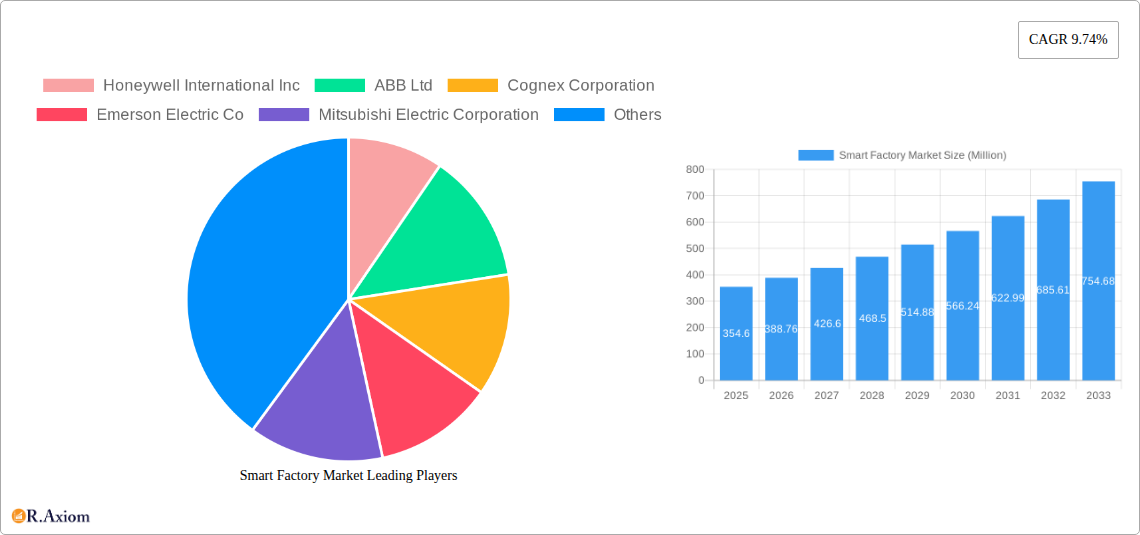
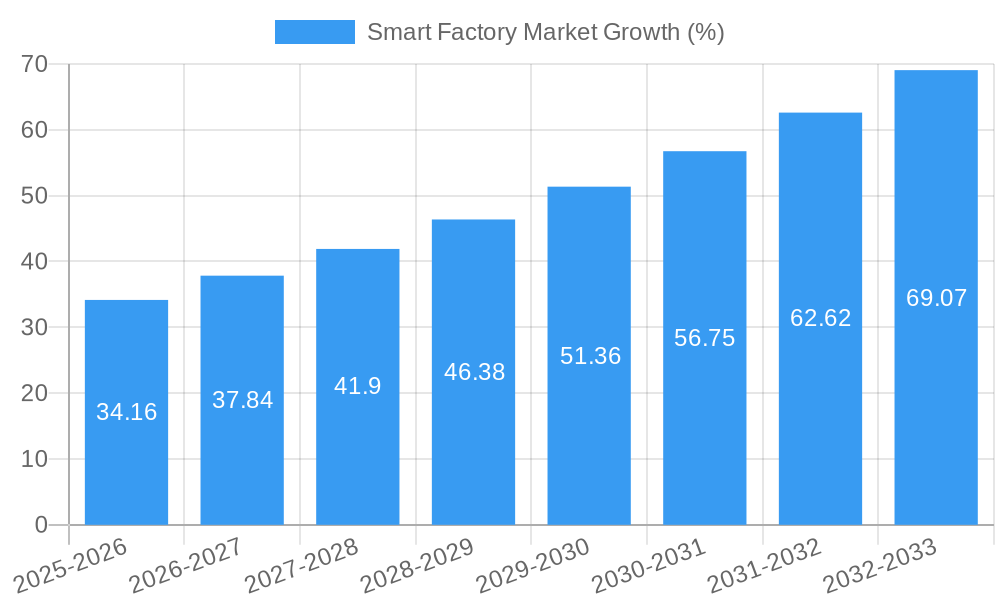
The Smart Factory market, valued at $354.60 million in 2025, is experiencing robust growth, projected to expand at a compound annual growth rate (CAGR) of 9.74% from 2025 to 2033. This expansion is driven by several key factors. Increasing automation needs across various industries, particularly in automotive, semiconductors, and pharmaceuticals, are pushing the adoption of smart factory technologies. The rising demand for improved operational efficiency, enhanced product quality, and reduced production costs are further fueling market growth. Furthermore, advancements in technologies like Industrial IoT (IIoT), artificial intelligence (AI), and machine learning (ML) are enabling more sophisticated and integrated smart factory solutions, creating new opportunities for market players. The integration of these technologies facilitates real-time data analysis, predictive maintenance, and optimized resource allocation, leading to significant improvements in overall productivity and profitability.
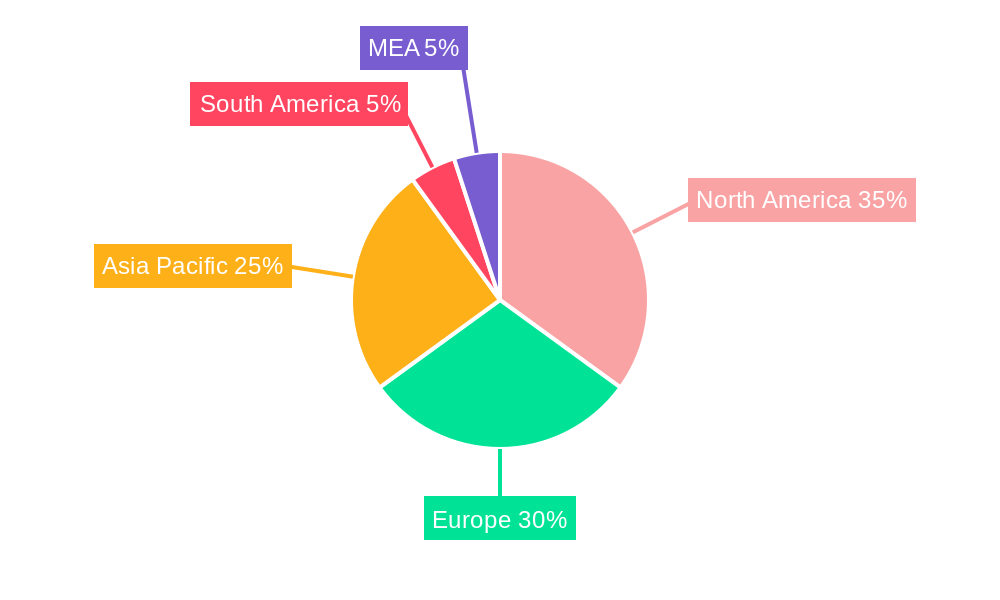
However, market growth faces some challenges. High initial investment costs associated with implementing smart factory technologies can be a barrier for smaller companies. Concerns related to data security and cybersecurity risks also pose a significant restraint. Furthermore, the need for skilled labor to manage and maintain these complex systems represents another obstacle. Despite these limitations, the long-term benefits of increased efficiency, reduced waste, and improved product quality outweigh these challenges, ensuring continued market expansion. The market segmentation, encompassing various product types (industrial robotics, machine vision, etc.), technologies (PLC, SCADA, etc.), and end-user industries, indicates diverse growth opportunities across different sectors. The presence of key players like Honeywell, ABB, and Siemens underscores the market's maturity and competitive landscape. Geographical expansion is expected across North America, Europe, and Asia-Pacific, reflecting the global adoption of smart factory concepts.
Smart Factory Market: A Comprehensive Report (2019-2033)
This in-depth report provides a comprehensive analysis of the Smart Factory Market, covering market size, segmentation, key players, growth drivers, challenges, and future opportunities. The report utilizes data from the historical period (2019-2024), base year (2025), and forecast period (2025-2033) to offer actionable insights for industry stakeholders. The total market value is estimated at xx Million in 2025 and projected to reach xx Million by 2033.
Smart Factory Market Concentration & Innovation
The Smart Factory market is characterized by a moderately concentrated landscape, with several major players holding significant market share. While precise market share figures for each company are proprietary, key players like Siemens AG, ABB Ltd, and Honeywell International Inc. are estimated to collectively hold a substantial portion (xx%) of the market. This concentration is driven by substantial investments in R&D and acquisitions, enabling them to offer comprehensive solutions across diverse segments. However, the market also exhibits a dynamic competitive landscape with several smaller players contributing to innovation and specialized solutions.
- Innovation Drivers: The adoption of Industry 4.0 technologies, including IoT, AI, and advanced analytics, is a primary driver of innovation. Further driving force include the increasing demand for enhanced efficiency, reduced operational costs, and improved product quality.
- Regulatory Frameworks: Government regulations and incentives aimed at promoting digital transformation and smart manufacturing are shaping the market. Stringent environmental regulations are pushing companies to adopt sustainable manufacturing practices.
- Product Substitutes: While there are no direct substitutes for Smart Factory solutions, companies must account for competitive pressures from traditional manufacturing methodologies and the potential disruption of emerging technologies.
- End-User Trends: End-user industries such as automotive, semiconductors, and pharmaceuticals are leading adopters of Smart Factory technologies, demanding increased automation, data-driven decision-making, and supply chain resilience.
- M&A Activities: The Smart Factory market has witnessed significant M&A activity, with larger players acquiring smaller companies to enhance their technology portfolios and expand their market reach. The total value of these deals in the last five years is estimated at xx Million.
Smart Factory Market Industry Trends & Insights
The Smart Factory market is experiencing robust growth, driven by increasing demand for automation, enhanced efficiency, improved product quality, and reduced operational costs. The market is projected to register a Compound Annual Growth Rate (CAGR) of xx% during the forecast period (2025-2033). This growth is largely attributed to the rising adoption of advanced technologies, such as AI, machine learning, and cloud computing, which enable real-time data analysis and optimized production processes. The market penetration of Smart Factory solutions is steadily increasing across various end-user industries, particularly in developed economies.
Technological disruptions, such as the emergence of 5G and edge computing, are further fueling market expansion by enabling seamless data exchange and real-time control. Consumer preferences for personalized products and rapid delivery are also influencing companies to invest in flexible and responsive manufacturing systems. The competitive landscape is intensely dynamic, with ongoing product development, strategic alliances, and M&A activities shaping the market.
Dominant Markets & Segments in Smart Factory Market
The automotive and semiconductor industries are currently the dominant end-user segments in the Smart Factory market, primarily due to their high level of automation and the need for precise, high-volume production. Geographically, North America and Europe are leading regions due to their established manufacturing base and early adoption of advanced technologies. The Asia-Pacific region is also witnessing rapid growth, with significant investment in Smart Factory infrastructure and increasing manufacturing capabilities.
- Key Drivers for Dominance:
- Automotive: High demand for automation, need for improved quality control, and rising consumer demand for customized vehicles.
- Semiconductors: Demand for high precision, complex manufacturing processes, and increasing complexity of semiconductor devices.
- North America & Europe: Early adoption of Industry 4.0 technologies, robust IT infrastructure, and favorable government policies supporting digitization.
- Asia-Pacific: Rapid economic growth, increasing manufacturing capabilities, and government initiatives aimed at promoting technological advancement.
Within the product segments, Industrial Robotics and Machine Vision Systems are prominent, driven by increased automation and the need for real-time quality inspection. Within the technologies segment, Manufacturing Execution Systems (MES) and Programmable Logic Controllers (PLCs) hold significant shares owing to their crucial role in production management and automation.
Smart Factory Market Product Developments
Recent product innovations focus on enhancing interoperability, integrating advanced analytics capabilities, and improving user experience. New applications are emerging in areas such as predictive maintenance, real-time production optimization, and enhanced supply chain visibility. Companies are emphasizing ease of use, scalability, and robust cybersecurity features to improve market fit. The integration of AI and machine learning is enabling more sophisticated automation and decision-making capabilities.
Report Scope & Segmentation Analysis
This report segments the Smart Factory market across various parameters:
- By Collaborative Industry Robots: Control Devices, Servo Motors and Drives, Sensors, Communication Technologies (Wireless and Wired), Other Product Types. Growth is primarily driven by advancements in robot dexterity and improved human-robot collaboration.
- By Technology: Product Lifecycle Management (PLM), Human Machine Interface (HMI), Enterprise Resource Planning (ERP), Manufacturing Execution System (MES), Distributed Control System (DCS), Supervisory Controller and Data Acquisition (SCADA), Programmable Logic Controller (PLC), Other Technologies. The MES and PLC segments are expected to maintain substantial market share due to their crucial role in production management and automation.
- By End-user Industry: Automotive, Semiconductors, Oil and Gas, Chemical and Petrochemical, Pharmaceutical, Aerospace and Defense, Food and Beverage, Mining, Other End-user Industries. The automotive and semiconductor industries are projected to remain dominant, with substantial growth anticipated in the pharmaceutical and food & beverage sectors.
- By Product Type: Machine Vision Systems, Lighting, Industrial Robotics. Industrial Robotics are experiencing the highest growth rate owing to increased automation needs across various industries.
Each segment shows varying growth projections based on technology adoption, regulatory changes, and industry-specific requirements. Competitive dynamics are intense across all segments, with ongoing innovation and competition from both established players and emerging companies.
Key Drivers of Smart Factory Market Growth
The growth of the Smart Factory market is fueled by several factors:
- Technological Advancements: The development of advanced technologies such as AI, IoT, and cloud computing is enabling greater automation, improved efficiency, and enhanced data analytics capabilities.
- Economic Growth: Global economic growth and rising industrial production are driving the demand for efficient and cost-effective manufacturing solutions.
- Government Regulations: Government policies and initiatives supporting the adoption of Industry 4.0 technologies are also contributing to market growth. For instance, many governments offer subsidies or tax breaks for businesses that invest in smart manufacturing technologies.
Challenges in the Smart Factory Market Sector
The Smart Factory market faces several challenges:
- High Initial Investment Costs: The implementation of Smart Factory technologies can require significant upfront investment, posing a barrier for some businesses.
- Cybersecurity Risks: The interconnected nature of Smart Factory systems makes them vulnerable to cybersecurity threats, necessitating robust security measures.
- Skills Gap: The lack of skilled workers with expertise in operating and maintaining advanced manufacturing technologies poses a significant challenge.
Emerging Opportunities in Smart Factory Market
Emerging opportunities include:
- Expansion into New Markets: The Smart Factory concept is still relatively new in many developing economies, offering significant growth potential.
- Integration of Emerging Technologies: The integration of technologies like blockchain and augmented reality could create new possibilities for supply chain management and workforce training.
- Focus on Sustainability: The increasing focus on sustainability is creating demand for Smart Factory solutions that promote resource efficiency and reduce environmental impact.
Leading Players in the Smart Factory Market Market
- Honeywell International Inc
- ABB Ltd
- Cognex Corporation
- Emerson Electric Co
- Mitsubishi Electric Corporation
- Siemens AG
- Schneider Electric SE
- Fanuc Corporation
- KUKA AG
- Robert Bosch GmbH
- FLIR Systems Inc (Teledyne Technologies Incorporated)
- Rockwell Automation Inc
- Yokogawa Electric Corporation
*List Not Exhaustive
Key Developments in Smart Factory Market Industry
- October 2022: ABB partnered with Scalable Robotics to enhance robotic welding capabilities using 3D vision.
- January 2023: Siemens launched eXplore live at The Smart Factory in Wichita, showcasing digitalization in manufacturing.
- February 2023: Emerson launched the OvationTM Green portfolio, integrating renewable energy capabilities into its power control architecture.
Strategic Outlook for Smart Factory Market Market
The Smart Factory market is poised for continued robust growth, driven by ongoing technological advancements, increasing adoption across various industries, and supportive government policies. Emerging trends such as the convergence of IT and OT, the growing importance of cybersecurity, and the need for sustainable manufacturing practices will shape the future of the market. Companies that can successfully integrate these trends into their strategies are expected to gain a competitive advantage and capture significant market share.
Smart Factory Market Segmentation
-
1. Product Type
-
1.1. Machine Vision Systems
- 1.1.1. Cameras
- 1.1.2. Processors
- 1.1.3. Software
- 1.1.4. Enclosures
- 1.1.5. Frame Grabbers
- 1.1.6. Integration Services
- 1.1.7. Lighting
-
1.2. Industrial Robotics
- 1.2.1. Articulated Robots
- 1.2.2. Cartesian Robots
- 1.2.3. Cylindrical Robots
- 1.2.4. SCARA Robots
- 1.2.5. Parallel Robots
- 1.2.6. Collaborative Industry Robots
-
1.3. Control Devices
- 1.3.1. Relays and Switches
- 1.3.2. Servo Motors and Drives
- 1.4. Sensors
-
1.5. Communication Technologies
- 1.5.1. Wired
- 1.5.2. Wireless
- 1.6. Other Product Types
-
1.1. Machine Vision Systems
-
2. Technology
- 2.1. Product Lifecycle Management (PLM)
- 2.2. Human Machine Interface (HMI)
- 2.3. Enterprise Resource and Planning (ERP)
- 2.4. Manufacturing Execution System (MES)
- 2.5. Distributed Control System (DCS)
- 2.6. Supervis
- 2.7. Programmable Logic Controller (PLC)
- 2.8. Other Technologies
-
3. End-user Industry
- 3.1. Automotive
- 3.2. Semiconductors
- 3.3. Oil and Gas
- 3.4. Chemical and Petrochemical
- 3.5. Pharmaceutical
- 3.6. Aerospace and Defense
- 3.7. Food and Beverage
- 3.8. Mining
- 3.9. Other End-user Industries
Smart Factory Market Segmentation By Geography
-
1. North America
- 1.1. United States
- 1.2. Canada
-
2. Europe
- 2.1. United Kingdom
- 2.2. Germany
- 2.3. France
-
3. Asia
- 3.1. China
- 3.2. India
- 3.3. Japan
- 3.4. Australia and New Zealand
-
4. Latin America
- 4.1. Brazil
- 4.2. Argentina
- 4.3. Mexico
-
5. Middle East and Africa
- 5.1. United Arab Emirates
- 5.2. Saudi Arabia
- 5.3. South Africa
Smart Factory Market REPORT HIGHLIGHTS
| Aspects | Details |
|---|---|
| Study Period | 2019-2033 |
| Base Year | 2024 |
| Estimated Year | 2025 |
| Forecast Period | 2025-2033 |
| Historical Period | 2019-2024 |
| Growth Rate | CAGR of 9.74% from 2019-2033 |
| Segmentation |
|
Table of Contents
- 1. Introduction
- 1.1. Research Scope
- 1.2. Market Segmentation
- 1.3. Research Methodology
- 1.4. Definitions and Assumptions
- 2. Executive Summary
- 2.1. Introduction
- 3. Market Dynamics
- 3.1. Introduction
- 3.2. Market Drivers
- 3.2.1. Growing Adoption of Internet of Things (IoT) Technologies Across the Value Chain; Rising Demand for Energy Efficiency
- 3.3. Market Restrains
- 3.3.1. Huge Capital Investments for Transformations; Vulnerable to Cyberattacks
- 3.4. Market Trends
- 3.4.1. Semiconductor Sector is Expected to Drive the Market Growth
- 4. Market Factor Analysis
- 4.1. Porters Five Forces
- 4.2. Supply/Value Chain
- 4.3. PESTEL analysis
- 4.4. Market Entropy
- 4.5. Patent/Trademark Analysis
- 5. Global Smart Factory Market Analysis, Insights and Forecast, 2019-2031
- 5.1. Market Analysis, Insights and Forecast - by Product Type
- 5.1.1. Machine Vision Systems
- 5.1.1.1. Cameras
- 5.1.1.2. Processors
- 5.1.1.3. Software
- 5.1.1.4. Enclosures
- 5.1.1.5. Frame Grabbers
- 5.1.1.6. Integration Services
- 5.1.1.7. Lighting
- 5.1.2. Industrial Robotics
- 5.1.2.1. Articulated Robots
- 5.1.2.2. Cartesian Robots
- 5.1.2.3. Cylindrical Robots
- 5.1.2.4. SCARA Robots
- 5.1.2.5. Parallel Robots
- 5.1.2.6. Collaborative Industry Robots
- 5.1.3. Control Devices
- 5.1.3.1. Relays and Switches
- 5.1.3.2. Servo Motors and Drives
- 5.1.4. Sensors
- 5.1.5. Communication Technologies
- 5.1.5.1. Wired
- 5.1.5.2. Wireless
- 5.1.6. Other Product Types
- 5.1.1. Machine Vision Systems
- 5.2. Market Analysis, Insights and Forecast - by Technology
- 5.2.1. Product Lifecycle Management (PLM)
- 5.2.2. Human Machine Interface (HMI)
- 5.2.3. Enterprise Resource and Planning (ERP)
- 5.2.4. Manufacturing Execution System (MES)
- 5.2.5. Distributed Control System (DCS)
- 5.2.6. Supervis
- 5.2.7. Programmable Logic Controller (PLC)
- 5.2.8. Other Technologies
- 5.3. Market Analysis, Insights and Forecast - by End-user Industry
- 5.3.1. Automotive
- 5.3.2. Semiconductors
- 5.3.3. Oil and Gas
- 5.3.4. Chemical and Petrochemical
- 5.3.5. Pharmaceutical
- 5.3.6. Aerospace and Defense
- 5.3.7. Food and Beverage
- 5.3.8. Mining
- 5.3.9. Other End-user Industries
- 5.4. Market Analysis, Insights and Forecast - by Region
- 5.4.1. North America
- 5.4.2. Europe
- 5.4.3. Asia
- 5.4.4. Latin America
- 5.4.5. Middle East and Africa
- 5.1. Market Analysis, Insights and Forecast - by Product Type
- 6. North America Smart Factory Market Analysis, Insights and Forecast, 2019-2031
- 6.1. Market Analysis, Insights and Forecast - by Product Type
- 6.1.1. Machine Vision Systems
- 6.1.1.1. Cameras
- 6.1.1.2. Processors
- 6.1.1.3. Software
- 6.1.1.4. Enclosures
- 6.1.1.5. Frame Grabbers
- 6.1.1.6. Integration Services
- 6.1.1.7. Lighting
- 6.1.2. Industrial Robotics
- 6.1.2.1. Articulated Robots
- 6.1.2.2. Cartesian Robots
- 6.1.2.3. Cylindrical Robots
- 6.1.2.4. SCARA Robots
- 6.1.2.5. Parallel Robots
- 6.1.2.6. Collaborative Industry Robots
- 6.1.3. Control Devices
- 6.1.3.1. Relays and Switches
- 6.1.3.2. Servo Motors and Drives
- 6.1.4. Sensors
- 6.1.5. Communication Technologies
- 6.1.5.1. Wired
- 6.1.5.2. Wireless
- 6.1.6. Other Product Types
- 6.1.1. Machine Vision Systems
- 6.2. Market Analysis, Insights and Forecast - by Technology
- 6.2.1. Product Lifecycle Management (PLM)
- 6.2.2. Human Machine Interface (HMI)
- 6.2.3. Enterprise Resource and Planning (ERP)
- 6.2.4. Manufacturing Execution System (MES)
- 6.2.5. Distributed Control System (DCS)
- 6.2.6. Supervis
- 6.2.7. Programmable Logic Controller (PLC)
- 6.2.8. Other Technologies
- 6.3. Market Analysis, Insights and Forecast - by End-user Industry
- 6.3.1. Automotive
- 6.3.2. Semiconductors
- 6.3.3. Oil and Gas
- 6.3.4. Chemical and Petrochemical
- 6.3.5. Pharmaceutical
- 6.3.6. Aerospace and Defense
- 6.3.7. Food and Beverage
- 6.3.8. Mining
- 6.3.9. Other End-user Industries
- 6.1. Market Analysis, Insights and Forecast - by Product Type
- 7. Europe Smart Factory Market Analysis, Insights and Forecast, 2019-2031
- 7.1. Market Analysis, Insights and Forecast - by Product Type
- 7.1.1. Machine Vision Systems
- 7.1.1.1. Cameras
- 7.1.1.2. Processors
- 7.1.1.3. Software
- 7.1.1.4. Enclosures
- 7.1.1.5. Frame Grabbers
- 7.1.1.6. Integration Services
- 7.1.1.7. Lighting
- 7.1.2. Industrial Robotics
- 7.1.2.1. Articulated Robots
- 7.1.2.2. Cartesian Robots
- 7.1.2.3. Cylindrical Robots
- 7.1.2.4. SCARA Robots
- 7.1.2.5. Parallel Robots
- 7.1.2.6. Collaborative Industry Robots
- 7.1.3. Control Devices
- 7.1.3.1. Relays and Switches
- 7.1.3.2. Servo Motors and Drives
- 7.1.4. Sensors
- 7.1.5. Communication Technologies
- 7.1.5.1. Wired
- 7.1.5.2. Wireless
- 7.1.6. Other Product Types
- 7.1.1. Machine Vision Systems
- 7.2. Market Analysis, Insights and Forecast - by Technology
- 7.2.1. Product Lifecycle Management (PLM)
- 7.2.2. Human Machine Interface (HMI)
- 7.2.3. Enterprise Resource and Planning (ERP)
- 7.2.4. Manufacturing Execution System (MES)
- 7.2.5. Distributed Control System (DCS)
- 7.2.6. Supervis
- 7.2.7. Programmable Logic Controller (PLC)
- 7.2.8. Other Technologies
- 7.3. Market Analysis, Insights and Forecast - by End-user Industry
- 7.3.1. Automotive
- 7.3.2. Semiconductors
- 7.3.3. Oil and Gas
- 7.3.4. Chemical and Petrochemical
- 7.3.5. Pharmaceutical
- 7.3.6. Aerospace and Defense
- 7.3.7. Food and Beverage
- 7.3.8. Mining
- 7.3.9. Other End-user Industries
- 7.1. Market Analysis, Insights and Forecast - by Product Type
- 8. Asia Smart Factory Market Analysis, Insights and Forecast, 2019-2031
- 8.1. Market Analysis, Insights and Forecast - by Product Type
- 8.1.1. Machine Vision Systems
- 8.1.1.1. Cameras
- 8.1.1.2. Processors
- 8.1.1.3. Software
- 8.1.1.4. Enclosures
- 8.1.1.5. Frame Grabbers
- 8.1.1.6. Integration Services
- 8.1.1.7. Lighting
- 8.1.2. Industrial Robotics
- 8.1.2.1. Articulated Robots
- 8.1.2.2. Cartesian Robots
- 8.1.2.3. Cylindrical Robots
- 8.1.2.4. SCARA Robots
- 8.1.2.5. Parallel Robots
- 8.1.2.6. Collaborative Industry Robots
- 8.1.3. Control Devices
- 8.1.3.1. Relays and Switches
- 8.1.3.2. Servo Motors and Drives
- 8.1.4. Sensors
- 8.1.5. Communication Technologies
- 8.1.5.1. Wired
- 8.1.5.2. Wireless
- 8.1.6. Other Product Types
- 8.1.1. Machine Vision Systems
- 8.2. Market Analysis, Insights and Forecast - by Technology
- 8.2.1. Product Lifecycle Management (PLM)
- 8.2.2. Human Machine Interface (HMI)
- 8.2.3. Enterprise Resource and Planning (ERP)
- 8.2.4. Manufacturing Execution System (MES)
- 8.2.5. Distributed Control System (DCS)
- 8.2.6. Supervis
- 8.2.7. Programmable Logic Controller (PLC)
- 8.2.8. Other Technologies
- 8.3. Market Analysis, Insights and Forecast - by End-user Industry
- 8.3.1. Automotive
- 8.3.2. Semiconductors
- 8.3.3. Oil and Gas
- 8.3.4. Chemical and Petrochemical
- 8.3.5. Pharmaceutical
- 8.3.6. Aerospace and Defense
- 8.3.7. Food and Beverage
- 8.3.8. Mining
- 8.3.9. Other End-user Industries
- 8.1. Market Analysis, Insights and Forecast - by Product Type
- 9. Latin America Smart Factory Market Analysis, Insights and Forecast, 2019-2031
- 9.1. Market Analysis, Insights and Forecast - by Product Type
- 9.1.1. Machine Vision Systems
- 9.1.1.1. Cameras
- 9.1.1.2. Processors
- 9.1.1.3. Software
- 9.1.1.4. Enclosures
- 9.1.1.5. Frame Grabbers
- 9.1.1.6. Integration Services
- 9.1.1.7. Lighting
- 9.1.2. Industrial Robotics
- 9.1.2.1. Articulated Robots
- 9.1.2.2. Cartesian Robots
- 9.1.2.3. Cylindrical Robots
- 9.1.2.4. SCARA Robots
- 9.1.2.5. Parallel Robots
- 9.1.2.6. Collaborative Industry Robots
- 9.1.3. Control Devices
- 9.1.3.1. Relays and Switches
- 9.1.3.2. Servo Motors and Drives
- 9.1.4. Sensors
- 9.1.5. Communication Technologies
- 9.1.5.1. Wired
- 9.1.5.2. Wireless
- 9.1.6. Other Product Types
- 9.1.1. Machine Vision Systems
- 9.2. Market Analysis, Insights and Forecast - by Technology
- 9.2.1. Product Lifecycle Management (PLM)
- 9.2.2. Human Machine Interface (HMI)
- 9.2.3. Enterprise Resource and Planning (ERP)
- 9.2.4. Manufacturing Execution System (MES)
- 9.2.5. Distributed Control System (DCS)
- 9.2.6. Supervis
- 9.2.7. Programmable Logic Controller (PLC)
- 9.2.8. Other Technologies
- 9.3. Market Analysis, Insights and Forecast - by End-user Industry
- 9.3.1. Automotive
- 9.3.2. Semiconductors
- 9.3.3. Oil and Gas
- 9.3.4. Chemical and Petrochemical
- 9.3.5. Pharmaceutical
- 9.3.6. Aerospace and Defense
- 9.3.7. Food and Beverage
- 9.3.8. Mining
- 9.3.9. Other End-user Industries
- 9.1. Market Analysis, Insights and Forecast - by Product Type
- 10. Middle East and Africa Smart Factory Market Analysis, Insights and Forecast, 2019-2031
- 10.1. Market Analysis, Insights and Forecast - by Product Type
- 10.1.1. Machine Vision Systems
- 10.1.1.1. Cameras
- 10.1.1.2. Processors
- 10.1.1.3. Software
- 10.1.1.4. Enclosures
- 10.1.1.5. Frame Grabbers
- 10.1.1.6. Integration Services
- 10.1.1.7. Lighting
- 10.1.2. Industrial Robotics
- 10.1.2.1. Articulated Robots
- 10.1.2.2. Cartesian Robots
- 10.1.2.3. Cylindrical Robots
- 10.1.2.4. SCARA Robots
- 10.1.2.5. Parallel Robots
- 10.1.2.6. Collaborative Industry Robots
- 10.1.3. Control Devices
- 10.1.3.1. Relays and Switches
- 10.1.3.2. Servo Motors and Drives
- 10.1.4. Sensors
- 10.1.5. Communication Technologies
- 10.1.5.1. Wired
- 10.1.5.2. Wireless
- 10.1.6. Other Product Types
- 10.1.1. Machine Vision Systems
- 10.2. Market Analysis, Insights and Forecast - by Technology
- 10.2.1. Product Lifecycle Management (PLM)
- 10.2.2. Human Machine Interface (HMI)
- 10.2.3. Enterprise Resource and Planning (ERP)
- 10.2.4. Manufacturing Execution System (MES)
- 10.2.5. Distributed Control System (DCS)
- 10.2.6. Supervis
- 10.2.7. Programmable Logic Controller (PLC)
- 10.2.8. Other Technologies
- 10.3. Market Analysis, Insights and Forecast - by End-user Industry
- 10.3.1. Automotive
- 10.3.2. Semiconductors
- 10.3.3. Oil and Gas
- 10.3.4. Chemical and Petrochemical
- 10.3.5. Pharmaceutical
- 10.3.6. Aerospace and Defense
- 10.3.7. Food and Beverage
- 10.3.8. Mining
- 10.3.9. Other End-user Industries
- 10.1. Market Analysis, Insights and Forecast - by Product Type
- 11. North America Smart Factory Market Analysis, Insights and Forecast, 2019-2031
- 11.1. Market Analysis, Insights and Forecast - By Country/Sub-region
- 11.1.1 United States
- 11.1.2 Canada
- 11.1.3 Mexico
- 12. Europe Smart Factory Market Analysis, Insights and Forecast, 2019-2031
- 12.1. Market Analysis, Insights and Forecast - By Country/Sub-region
- 12.1.1 Germany
- 12.1.2 United Kingdom
- 12.1.3 France
- 12.1.4 Spain
- 12.1.5 Italy
- 12.1.6 Spain
- 12.1.7 Belgium
- 12.1.8 Netherland
- 12.1.9 Nordics
- 12.1.10 Rest of Europe
- 13. Asia Pacific Smart Factory Market Analysis, Insights and Forecast, 2019-2031
- 13.1. Market Analysis, Insights and Forecast - By Country/Sub-region
- 13.1.1 China
- 13.1.2 Japan
- 13.1.3 India
- 13.1.4 South Korea
- 13.1.5 Southeast Asia
- 13.1.6 Australia
- 13.1.7 Indonesia
- 13.1.8 Phillipes
- 13.1.9 Singapore
- 13.1.10 Thailandc
- 13.1.11 Rest of Asia Pacific
- 14. South America Smart Factory Market Analysis, Insights and Forecast, 2019-2031
- 14.1. Market Analysis, Insights and Forecast - By Country/Sub-region
- 14.1.1 Brazil
- 14.1.2 Argentina
- 14.1.3 Peru
- 14.1.4 Chile
- 14.1.5 Colombia
- 14.1.6 Ecuador
- 14.1.7 Venezuela
- 14.1.8 Rest of South America
- 15. North America Smart Factory Market Analysis, Insights and Forecast, 2019-2031
- 15.1. Market Analysis, Insights and Forecast - By Country/Sub-region
- 15.1.1 United States
- 15.1.2 Canada
- 15.1.3 Mexico
- 16. MEA Smart Factory Market Analysis, Insights and Forecast, 2019-2031
- 16.1. Market Analysis, Insights and Forecast - By Country/Sub-region
- 16.1.1 United Arab Emirates
- 16.1.2 Saudi Arabia
- 16.1.3 South Africa
- 16.1.4 Rest of Middle East and Africa
- 17. Competitive Analysis
- 17.1. Global Market Share Analysis 2024
- 17.2. Company Profiles
- 17.2.1 Honeywell International Inc
- 17.2.1.1. Overview
- 17.2.1.2. Products
- 17.2.1.3. SWOT Analysis
- 17.2.1.4. Recent Developments
- 17.2.1.5. Financials (Based on Availability)
- 17.2.2 ABB Ltd
- 17.2.2.1. Overview
- 17.2.2.2. Products
- 17.2.2.3. SWOT Analysis
- 17.2.2.4. Recent Developments
- 17.2.2.5. Financials (Based on Availability)
- 17.2.3 Cognex Corporation
- 17.2.3.1. Overview
- 17.2.3.2. Products
- 17.2.3.3. SWOT Analysis
- 17.2.3.4. Recent Developments
- 17.2.3.5. Financials (Based on Availability)
- 17.2.4 Emerson Electric Co
- 17.2.4.1. Overview
- 17.2.4.2. Products
- 17.2.4.3. SWOT Analysis
- 17.2.4.4. Recent Developments
- 17.2.4.5. Financials (Based on Availability)
- 17.2.5 Mitsubishi Electric Corporation
- 17.2.5.1. Overview
- 17.2.5.2. Products
- 17.2.5.3. SWOT Analysis
- 17.2.5.4. Recent Developments
- 17.2.5.5. Financials (Based on Availability)
- 17.2.6 Siemens AG
- 17.2.6.1. Overview
- 17.2.6.2. Products
- 17.2.6.3. SWOT Analysis
- 17.2.6.4. Recent Developments
- 17.2.6.5. Financials (Based on Availability)
- 17.2.7 Schneider Electric SE
- 17.2.7.1. Overview
- 17.2.7.2. Products
- 17.2.7.3. SWOT Analysis
- 17.2.7.4. Recent Developments
- 17.2.7.5. Financials (Based on Availability)
- 17.2.8 Fanuc Corporation
- 17.2.8.1. Overview
- 17.2.8.2. Products
- 17.2.8.3. SWOT Analysis
- 17.2.8.4. Recent Developments
- 17.2.8.5. Financials (Based on Availability)
- 17.2.9 KUKA AG
- 17.2.9.1. Overview
- 17.2.9.2. Products
- 17.2.9.3. SWOT Analysis
- 17.2.9.4. Recent Developments
- 17.2.9.5. Financials (Based on Availability)
- 17.2.10 Robert Bosch GmbH
- 17.2.10.1. Overview
- 17.2.10.2. Products
- 17.2.10.3. SWOT Analysis
- 17.2.10.4. Recent Developments
- 17.2.10.5. Financials (Based on Availability)
- 17.2.11 FLIR Systems Inc (Teledyne Technologies Incorporated)*List Not Exhaustive
- 17.2.11.1. Overview
- 17.2.11.2. Products
- 17.2.11.3. SWOT Analysis
- 17.2.11.4. Recent Developments
- 17.2.11.5. Financials (Based on Availability)
- 17.2.12 Rockwell Automation Inc
- 17.2.12.1. Overview
- 17.2.12.2. Products
- 17.2.12.3. SWOT Analysis
- 17.2.12.4. Recent Developments
- 17.2.12.5. Financials (Based on Availability)
- 17.2.13 Yokogawa Electric Corporation
- 17.2.13.1. Overview
- 17.2.13.2. Products
- 17.2.13.3. SWOT Analysis
- 17.2.13.4. Recent Developments
- 17.2.13.5. Financials (Based on Availability)
- 17.2.1 Honeywell International Inc
List of Figures
- Figure 1: Global Smart Factory Market Revenue Breakdown (Million, %) by Region 2024 & 2032
- Figure 2: North America Smart Factory Market Revenue (Million), by Country 2024 & 2032
- Figure 3: North America Smart Factory Market Revenue Share (%), by Country 2024 & 2032
- Figure 4: Europe Smart Factory Market Revenue (Million), by Country 2024 & 2032
- Figure 5: Europe Smart Factory Market Revenue Share (%), by Country 2024 & 2032
- Figure 6: Asia Pacific Smart Factory Market Revenue (Million), by Country 2024 & 2032
- Figure 7: Asia Pacific Smart Factory Market Revenue Share (%), by Country 2024 & 2032
- Figure 8: South America Smart Factory Market Revenue (Million), by Country 2024 & 2032
- Figure 9: South America Smart Factory Market Revenue Share (%), by Country 2024 & 2032
- Figure 10: North America Smart Factory Market Revenue (Million), by Country 2024 & 2032
- Figure 11: North America Smart Factory Market Revenue Share (%), by Country 2024 & 2032
- Figure 12: MEA Smart Factory Market Revenue (Million), by Country 2024 & 2032
- Figure 13: MEA Smart Factory Market Revenue Share (%), by Country 2024 & 2032
- Figure 14: North America Smart Factory Market Revenue (Million), by Product Type 2024 & 2032
- Figure 15: North America Smart Factory Market Revenue Share (%), by Product Type 2024 & 2032
- Figure 16: North America Smart Factory Market Revenue (Million), by Technology 2024 & 2032
- Figure 17: North America Smart Factory Market Revenue Share (%), by Technology 2024 & 2032
- Figure 18: North America Smart Factory Market Revenue (Million), by End-user Industry 2024 & 2032
- Figure 19: North America Smart Factory Market Revenue Share (%), by End-user Industry 2024 & 2032
- Figure 20: North America Smart Factory Market Revenue (Million), by Country 2024 & 2032
- Figure 21: North America Smart Factory Market Revenue Share (%), by Country 2024 & 2032
- Figure 22: Europe Smart Factory Market Revenue (Million), by Product Type 2024 & 2032
- Figure 23: Europe Smart Factory Market Revenue Share (%), by Product Type 2024 & 2032
- Figure 24: Europe Smart Factory Market Revenue (Million), by Technology 2024 & 2032
- Figure 25: Europe Smart Factory Market Revenue Share (%), by Technology 2024 & 2032
- Figure 26: Europe Smart Factory Market Revenue (Million), by End-user Industry 2024 & 2032
- Figure 27: Europe Smart Factory Market Revenue Share (%), by End-user Industry 2024 & 2032
- Figure 28: Europe Smart Factory Market Revenue (Million), by Country 2024 & 2032
- Figure 29: Europe Smart Factory Market Revenue Share (%), by Country 2024 & 2032
- Figure 30: Asia Smart Factory Market Revenue (Million), by Product Type 2024 & 2032
- Figure 31: Asia Smart Factory Market Revenue Share (%), by Product Type 2024 & 2032
- Figure 32: Asia Smart Factory Market Revenue (Million), by Technology 2024 & 2032
- Figure 33: Asia Smart Factory Market Revenue Share (%), by Technology 2024 & 2032
- Figure 34: Asia Smart Factory Market Revenue (Million), by End-user Industry 2024 & 2032
- Figure 35: Asia Smart Factory Market Revenue Share (%), by End-user Industry 2024 & 2032
- Figure 36: Asia Smart Factory Market Revenue (Million), by Country 2024 & 2032
- Figure 37: Asia Smart Factory Market Revenue Share (%), by Country 2024 & 2032
- Figure 38: Latin America Smart Factory Market Revenue (Million), by Product Type 2024 & 2032
- Figure 39: Latin America Smart Factory Market Revenue Share (%), by Product Type 2024 & 2032
- Figure 40: Latin America Smart Factory Market Revenue (Million), by Technology 2024 & 2032
- Figure 41: Latin America Smart Factory Market Revenue Share (%), by Technology 2024 & 2032
- Figure 42: Latin America Smart Factory Market Revenue (Million), by End-user Industry 2024 & 2032
- Figure 43: Latin America Smart Factory Market Revenue Share (%), by End-user Industry 2024 & 2032
- Figure 44: Latin America Smart Factory Market Revenue (Million), by Country 2024 & 2032
- Figure 45: Latin America Smart Factory Market Revenue Share (%), by Country 2024 & 2032
- Figure 46: Middle East and Africa Smart Factory Market Revenue (Million), by Product Type 2024 & 2032
- Figure 47: Middle East and Africa Smart Factory Market Revenue Share (%), by Product Type 2024 & 2032
- Figure 48: Middle East and Africa Smart Factory Market Revenue (Million), by Technology 2024 & 2032
- Figure 49: Middle East and Africa Smart Factory Market Revenue Share (%), by Technology 2024 & 2032
- Figure 50: Middle East and Africa Smart Factory Market Revenue (Million), by End-user Industry 2024 & 2032
- Figure 51: Middle East and Africa Smart Factory Market Revenue Share (%), by End-user Industry 2024 & 2032
- Figure 52: Middle East and Africa Smart Factory Market Revenue (Million), by Country 2024 & 2032
- Figure 53: Middle East and Africa Smart Factory Market Revenue Share (%), by Country 2024 & 2032
List of Tables
- Table 1: Global Smart Factory Market Revenue Million Forecast, by Region 2019 & 2032
- Table 2: Global Smart Factory Market Revenue Million Forecast, by Product Type 2019 & 2032
- Table 3: Global Smart Factory Market Revenue Million Forecast, by Technology 2019 & 2032
- Table 4: Global Smart Factory Market Revenue Million Forecast, by End-user Industry 2019 & 2032
- Table 5: Global Smart Factory Market Revenue Million Forecast, by Region 2019 & 2032
- Table 6: Global Smart Factory Market Revenue Million Forecast, by Country 2019 & 2032
- Table 7: United States Smart Factory Market Revenue (Million) Forecast, by Application 2019 & 2032
- Table 8: Canada Smart Factory Market Revenue (Million) Forecast, by Application 2019 & 2032
- Table 9: Mexico Smart Factory Market Revenue (Million) Forecast, by Application 2019 & 2032
- Table 10: Global Smart Factory Market Revenue Million Forecast, by Country 2019 & 2032
- Table 11: Germany Smart Factory Market Revenue (Million) Forecast, by Application 2019 & 2032
- Table 12: United Kingdom Smart Factory Market Revenue (Million) Forecast, by Application 2019 & 2032
- Table 13: France Smart Factory Market Revenue (Million) Forecast, by Application 2019 & 2032
- Table 14: Spain Smart Factory Market Revenue (Million) Forecast, by Application 2019 & 2032
- Table 15: Italy Smart Factory Market Revenue (Million) Forecast, by Application 2019 & 2032
- Table 16: Spain Smart Factory Market Revenue (Million) Forecast, by Application 2019 & 2032
- Table 17: Belgium Smart Factory Market Revenue (Million) Forecast, by Application 2019 & 2032
- Table 18: Netherland Smart Factory Market Revenue (Million) Forecast, by Application 2019 & 2032
- Table 19: Nordics Smart Factory Market Revenue (Million) Forecast, by Application 2019 & 2032
- Table 20: Rest of Europe Smart Factory Market Revenue (Million) Forecast, by Application 2019 & 2032
- Table 21: Global Smart Factory Market Revenue Million Forecast, by Country 2019 & 2032
- Table 22: China Smart Factory Market Revenue (Million) Forecast, by Application 2019 & 2032
- Table 23: Japan Smart Factory Market Revenue (Million) Forecast, by Application 2019 & 2032
- Table 24: India Smart Factory Market Revenue (Million) Forecast, by Application 2019 & 2032
- Table 25: South Korea Smart Factory Market Revenue (Million) Forecast, by Application 2019 & 2032
- Table 26: Southeast Asia Smart Factory Market Revenue (Million) Forecast, by Application 2019 & 2032
- Table 27: Australia Smart Factory Market Revenue (Million) Forecast, by Application 2019 & 2032
- Table 28: Indonesia Smart Factory Market Revenue (Million) Forecast, by Application 2019 & 2032
- Table 29: Phillipes Smart Factory Market Revenue (Million) Forecast, by Application 2019 & 2032
- Table 30: Singapore Smart Factory Market Revenue (Million) Forecast, by Application 2019 & 2032
- Table 31: Thailandc Smart Factory Market Revenue (Million) Forecast, by Application 2019 & 2032
- Table 32: Rest of Asia Pacific Smart Factory Market Revenue (Million) Forecast, by Application 2019 & 2032
- Table 33: Global Smart Factory Market Revenue Million Forecast, by Country 2019 & 2032
- Table 34: Brazil Smart Factory Market Revenue (Million) Forecast, by Application 2019 & 2032
- Table 35: Argentina Smart Factory Market Revenue (Million) Forecast, by Application 2019 & 2032
- Table 36: Peru Smart Factory Market Revenue (Million) Forecast, by Application 2019 & 2032
- Table 37: Chile Smart Factory Market Revenue (Million) Forecast, by Application 2019 & 2032
- Table 38: Colombia Smart Factory Market Revenue (Million) Forecast, by Application 2019 & 2032
- Table 39: Ecuador Smart Factory Market Revenue (Million) Forecast, by Application 2019 & 2032
- Table 40: Venezuela Smart Factory Market Revenue (Million) Forecast, by Application 2019 & 2032
- Table 41: Rest of South America Smart Factory Market Revenue (Million) Forecast, by Application 2019 & 2032
- Table 42: Global Smart Factory Market Revenue Million Forecast, by Country 2019 & 2032
- Table 43: United States Smart Factory Market Revenue (Million) Forecast, by Application 2019 & 2032
- Table 44: Canada Smart Factory Market Revenue (Million) Forecast, by Application 2019 & 2032
- Table 45: Mexico Smart Factory Market Revenue (Million) Forecast, by Application 2019 & 2032
- Table 46: Global Smart Factory Market Revenue Million Forecast, by Country 2019 & 2032
- Table 47: United Arab Emirates Smart Factory Market Revenue (Million) Forecast, by Application 2019 & 2032
- Table 48: Saudi Arabia Smart Factory Market Revenue (Million) Forecast, by Application 2019 & 2032
- Table 49: South Africa Smart Factory Market Revenue (Million) Forecast, by Application 2019 & 2032
- Table 50: Rest of Middle East and Africa Smart Factory Market Revenue (Million) Forecast, by Application 2019 & 2032
- Table 51: Global Smart Factory Market Revenue Million Forecast, by Product Type 2019 & 2032
- Table 52: Global Smart Factory Market Revenue Million Forecast, by Technology 2019 & 2032
- Table 53: Global Smart Factory Market Revenue Million Forecast, by End-user Industry 2019 & 2032
- Table 54: Global Smart Factory Market Revenue Million Forecast, by Country 2019 & 2032
- Table 55: United States Smart Factory Market Revenue (Million) Forecast, by Application 2019 & 2032
- Table 56: Canada Smart Factory Market Revenue (Million) Forecast, by Application 2019 & 2032
- Table 57: Global Smart Factory Market Revenue Million Forecast, by Product Type 2019 & 2032
- Table 58: Global Smart Factory Market Revenue Million Forecast, by Technology 2019 & 2032
- Table 59: Global Smart Factory Market Revenue Million Forecast, by End-user Industry 2019 & 2032
- Table 60: Global Smart Factory Market Revenue Million Forecast, by Country 2019 & 2032
- Table 61: United Kingdom Smart Factory Market Revenue (Million) Forecast, by Application 2019 & 2032
- Table 62: Germany Smart Factory Market Revenue (Million) Forecast, by Application 2019 & 2032
- Table 63: France Smart Factory Market Revenue (Million) Forecast, by Application 2019 & 2032
- Table 64: Global Smart Factory Market Revenue Million Forecast, by Product Type 2019 & 2032
- Table 65: Global Smart Factory Market Revenue Million Forecast, by Technology 2019 & 2032
- Table 66: Global Smart Factory Market Revenue Million Forecast, by End-user Industry 2019 & 2032
- Table 67: Global Smart Factory Market Revenue Million Forecast, by Country 2019 & 2032
- Table 68: China Smart Factory Market Revenue (Million) Forecast, by Application 2019 & 2032
- Table 69: India Smart Factory Market Revenue (Million) Forecast, by Application 2019 & 2032
- Table 70: Japan Smart Factory Market Revenue (Million) Forecast, by Application 2019 & 2032
- Table 71: Australia and New Zealand Smart Factory Market Revenue (Million) Forecast, by Application 2019 & 2032
- Table 72: Global Smart Factory Market Revenue Million Forecast, by Product Type 2019 & 2032
- Table 73: Global Smart Factory Market Revenue Million Forecast, by Technology 2019 & 2032
- Table 74: Global Smart Factory Market Revenue Million Forecast, by End-user Industry 2019 & 2032
- Table 75: Global Smart Factory Market Revenue Million Forecast, by Country 2019 & 2032
- Table 76: Brazil Smart Factory Market Revenue (Million) Forecast, by Application 2019 & 2032
- Table 77: Argentina Smart Factory Market Revenue (Million) Forecast, by Application 2019 & 2032
- Table 78: Mexico Smart Factory Market Revenue (Million) Forecast, by Application 2019 & 2032
- Table 79: Global Smart Factory Market Revenue Million Forecast, by Product Type 2019 & 2032
- Table 80: Global Smart Factory Market Revenue Million Forecast, by Technology 2019 & 2032
- Table 81: Global Smart Factory Market Revenue Million Forecast, by End-user Industry 2019 & 2032
- Table 82: Global Smart Factory Market Revenue Million Forecast, by Country 2019 & 2032
- Table 83: United Arab Emirates Smart Factory Market Revenue (Million) Forecast, by Application 2019 & 2032
- Table 84: Saudi Arabia Smart Factory Market Revenue (Million) Forecast, by Application 2019 & 2032
- Table 85: South Africa Smart Factory Market Revenue (Million) Forecast, by Application 2019 & 2032
Frequently Asked Questions
1. What is the projected Compound Annual Growth Rate (CAGR) of the Smart Factory Market?
The projected CAGR is approximately 9.74%.
2. Which companies are prominent players in the Smart Factory Market?
Key companies in the market include Honeywell International Inc, ABB Ltd, Cognex Corporation, Emerson Electric Co, Mitsubishi Electric Corporation, Siemens AG, Schneider Electric SE, Fanuc Corporation, KUKA AG, Robert Bosch GmbH, FLIR Systems Inc (Teledyne Technologies Incorporated)*List Not Exhaustive, Rockwell Automation Inc, Yokogawa Electric Corporation.
3. What are the main segments of the Smart Factory Market?
The market segments include Product Type, Technology, End-user Industry.
4. Can you provide details about the market size?
The market size is estimated to be USD 354.60 Million as of 2022.
5. What are some drivers contributing to market growth?
Growing Adoption of Internet of Things (IoT) Technologies Across the Value Chain; Rising Demand for Energy Efficiency.
6. What are the notable trends driving market growth?
Semiconductor Sector is Expected to Drive the Market Growth.
7. Are there any restraints impacting market growth?
Huge Capital Investments for Transformations; Vulnerable to Cyberattacks.
8. Can you provide examples of recent developments in the market?
February 2023: Emerson combined its extensive power expertise and renewable energy capabilities into the OvationTM Green portfolio to help power generation companies meet the needs of their customers as they transition to green energy generation and storage. Emerson has broadened its power-based control architecture by integrating newly acquired Mita-Teknik software and technology with its industry-leading Ovation automation platform, extensive renewable energy knowledge base, cybersecurity solutions, and remote management capabilities.
9. What pricing options are available for accessing the report?
Pricing options include single-user, multi-user, and enterprise licenses priced at USD 4750, USD 5250, and USD 8750 respectively.
10. Is the market size provided in terms of value or volume?
The market size is provided in terms of value, measured in Million.
11. Are there any specific market keywords associated with the report?
Yes, the market keyword associated with the report is "Smart Factory Market," which aids in identifying and referencing the specific market segment covered.
12. How do I determine which pricing option suits my needs best?
The pricing options vary based on user requirements and access needs. Individual users may opt for single-user licenses, while businesses requiring broader access may choose multi-user or enterprise licenses for cost-effective access to the report.
13. Are there any additional resources or data provided in the Smart Factory Market report?
While the report offers comprehensive insights, it's advisable to review the specific contents or supplementary materials provided to ascertain if additional resources or data are available.
14. How can I stay updated on further developments or reports in the Smart Factory Market?
To stay informed about further developments, trends, and reports in the Smart Factory Market, consider subscribing to industry newsletters, following relevant companies and organizations, or regularly checking reputable industry news sources and publications.
Methodology
Step 1 - Identification of Relevant Samples Size from Population Database


Step 2 - Approaches for Defining Global Market Size (Value, Volume* & Price*)

Note*: In applicable scenarios
Step 3 - Data Sources
Primary Research
- Web Analytics
- Survey Reports
- Research Institute
- Latest Research Reports
- Opinion Leaders
Secondary Research
- Annual Reports
- White Paper
- Latest Press Release
- Industry Association
- Paid Database
- Investor Presentations

Step 4 - Data Triangulation
Involves using different sources of information in order to increase the validity of a study
These sources are likely to be stakeholders in a program - participants, other researchers, program staff, other community members, and so on.
Then we put all data in single framework & apply various statistical tools to find out the dynamic on the market.
During the analysis stage, feedback from the stakeholder groups would be compared to determine areas of agreement as well as areas of divergence


