

Key Insights
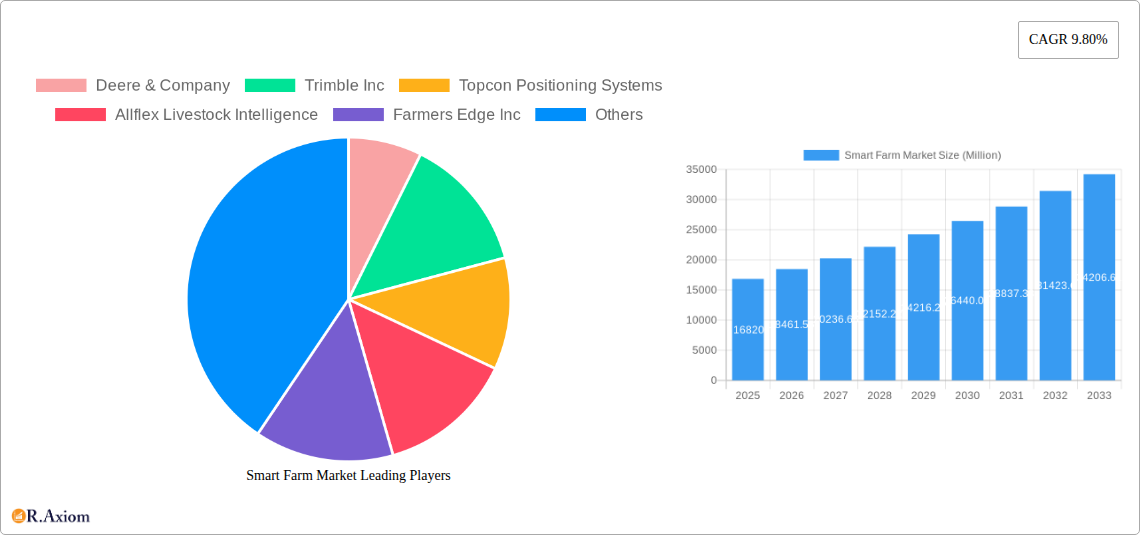
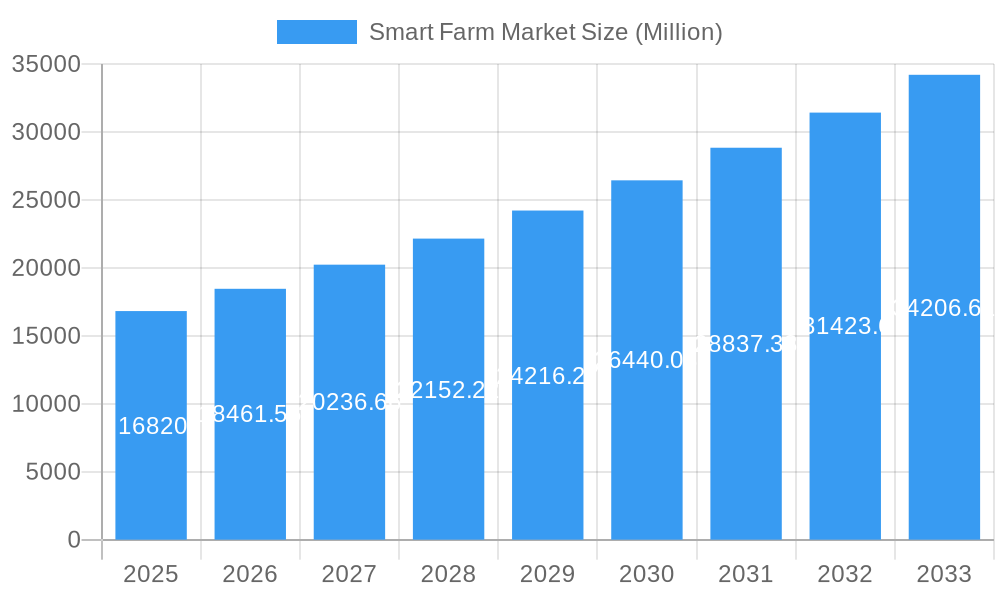
The global smart farm market, valued at $16.82 billion in 2025, is poised for robust growth, exhibiting a Compound Annual Growth Rate (CAGR) of 9.80% from 2025 to 2033. This expansion is driven by several key factors. Firstly, the increasing need for enhanced agricultural efficiency and productivity, particularly in the face of growing global food demands and limited arable land, is pushing farmers towards technology-driven solutions. Secondly, advancements in sensor technology, data analytics, and artificial intelligence (AI) are enabling the development of more sophisticated and effective smart farming technologies. These technologies offer precise control over irrigation, fertilization, and pest management, leading to optimized resource utilization and higher yields. Furthermore, government initiatives promoting the adoption of precision agriculture and digital farming are playing a crucial role in driving market growth. Key players like Deere & Company, Trimble Inc., and Topcon Positioning Systems are investing heavily in research and development, further fueling innovation within the sector.
Smart Farm Market Market Size (In Billion)
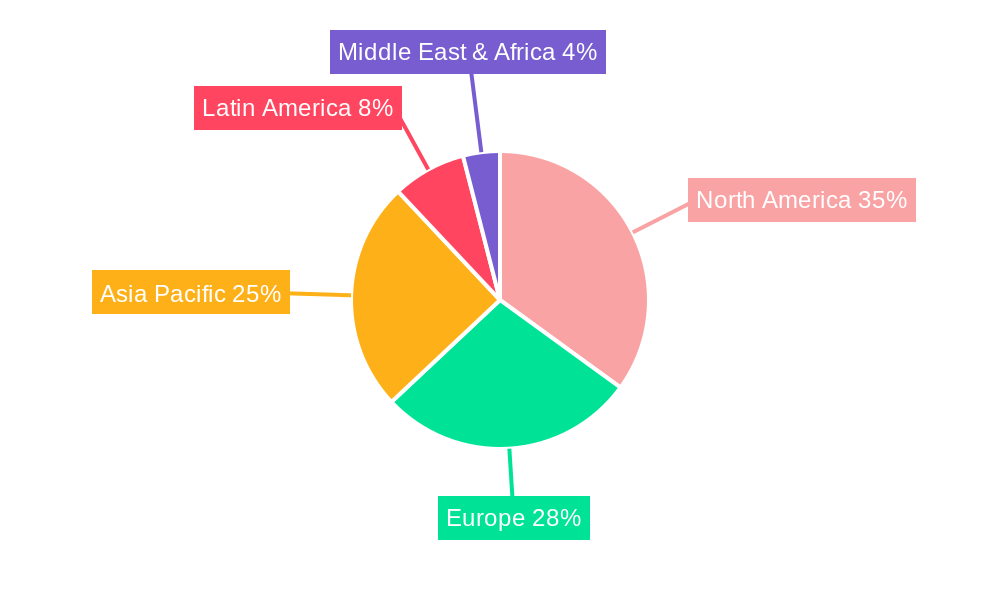
However, the market also faces certain challenges. High initial investment costs associated with implementing smart farming technologies can be a barrier for smaller farms. Moreover, the dependence on reliable internet connectivity and digital literacy among farmers presents an obstacle in some regions. Data security and privacy concerns also need addressing as the volume of sensitive agricultural data increases. Despite these restraints, the long-term prospects for the smart farm market remain positive, driven by continuous technological advancements and increasing farmer awareness of the benefits of precision agriculture. The market segmentation, while not explicitly detailed, likely includes various technologies (e.g., precision irrigation, drone-based monitoring, farm management software) and applications across different crop types and livestock sectors. The geographic distribution will show varied adoption rates, with developed nations in North America and Europe likely leading the way initially, followed by faster growth in emerging economies in Asia and Latin America.
Smart Farm Market Company Market Share
Smart Farm Market: A Comprehensive Market Report (2019-2033)
This comprehensive report provides an in-depth analysis of the Smart Farm Market, encompassing market size, growth projections, key players, technological advancements, and emerging trends from 2019 to 2033. The report leverages extensive data analysis and expert insights to offer actionable strategies for industry stakeholders. With a base year of 2025 and a forecast period of 2025-2033, this report is an invaluable resource for understanding the evolving landscape of precision agriculture. The total market value is estimated to reach xx Million by 2033.
Smart Farm Market Market Concentration & Innovation
This section analyzes the competitive landscape of the Smart Farm Market, exploring market concentration, innovation drivers, regulatory frameworks, product substitutes, end-user trends, and M&A activities. The market is characterized by a moderately concentrated landscape with key players holding significant market share, but with room for growth from smaller innovative companies.
Market Concentration: The top 5 players (Deere & Company, Trimble Inc, Topcon Positioning Systems, Allflex Livestock Intelligence, and Farmers Edge Inc) collectively hold an estimated xx% market share in 2025, with Deere & Company leading at approximately xx%. However, increased competition from smaller, specialized firms is anticipated.
Innovation Drivers: The primary drivers of innovation are the increasing demand for enhanced crop yields, improved resource management, and sustainable agricultural practices. Advancements in IoT, AI, and big data analytics are fueling the development of sophisticated smart farm solutions.
Regulatory Frameworks: Government regulations concerning data privacy, environmental sustainability, and food safety are increasingly influencing the development and adoption of smart farm technologies. Compliance requirements are driving innovation in data security and traceability solutions.
Product Substitutes: Traditional farming methods remain a significant substitute for smart farming solutions, particularly among smaller farms with limited resources. However, the increasing cost-effectiveness and demonstrable benefits of smart farm technologies are gradually shifting the balance.
End-User Trends: The increasing adoption of precision agriculture practices among large-scale commercial farms is driving market growth, while smaller farms are gradually adopting smart solutions due to decreasing costs and improved accessibility.
M&A Activities: The smart farm market has witnessed significant M&A activity in recent years, with deal values exceeding xx Million in the period 2019-2024. These activities reflect the industry's consolidation and the pursuit of technological synergies. Examples include [Insert Specific M&A Examples if available, otherwise state "Specific details on recent M&A activities are not publicly available"].
Smart Farm Market Industry Trends & Insights
This section delves into the key trends and insights shaping the Smart Farm Market, including market growth drivers, technological disruptions, consumer preferences, and competitive dynamics. The market is poised for significant growth, with a projected Compound Annual Growth Rate (CAGR) of xx% during the forecast period (2025-2033). Market penetration of smart farm technologies is expected to increase from xx% in 2025 to xx% by 2033.
[Insert 600 words discussing market growth drivers (e.g., rising food demand, government initiatives, technological advancements), technological disruptions (e.g., AI-powered analytics, IoT sensors, robotics), consumer preferences (e.g., demand for sustainable practices, higher-quality produce), and competitive dynamics (e.g., new entrants, strategic alliances, price competition).]
Dominant Markets & Segments in Smart Farm Market
This section identifies the leading regions, countries, or segments within the Smart Farm Market. [Insert dominant region/country analysis here, approximately 600 words. This should include a detailed analysis with paragraphs and bullet points for key drivers.] For example, North America might be a dominant region due to high adoption of technology and government support, while Asia-Pacific may experience rapid growth due to increasing agricultural output and investment in technology.
Smart Farm Market Product Developments
The Smart Farm Market is undergoing a rapid evolution, propelled by groundbreaking advancements in cutting-edge technologies. We are witnessing a surge in the development of intelligent solutions designed to revolutionize agricultural practices. New product launches are keenly focused on elevating crop monitoring with unparalleled accuracy, achieving peak resource optimization through sophisticated analytics, and dramatically boosting the overall efficiency and productivity of farming operations. These innovations are not only fostering deeper market penetration but are also accelerating the critical shift towards data-driven, evidence-based decision-making across the agricultural spectrum. Leading the charge are AI-powered crop monitoring systems that offer predictive insights, fully automated irrigation solutions that ensure precise water delivery, and advanced precision spraying technologies that minimize waste and environmental impact. Embracing these innovations provides farmers with a significant competitive edge, translating into demonstrably improved yields, substantial reductions in input costs, and a more robustly sustainable agricultural future.
Report Scope & Segmentation Analysis
This comprehensive report meticulously segments the Smart Farm Market across a diverse array of critical parameters, providing an in-depth and holistic understanding of its multifaceted landscape. The market is analyzed by Technology Type, encompassing the rapidly evolving categories of IoT sensors, sophisticated AI software, and advanced robotics, each contributing uniquely to farm automation and intelligence. Further segmentation is performed by Application, detailing the growth and impact within crop monitoring, livestock management, precision irrigation systems, and farm management software. We also examine the market by Farm Size, differentiating between the adoption rates and specific needs of small, medium, and large-scale agricultural enterprises. For each identified segment, the report provides detailed growth projections, current and future market sizes, and a thorough analysis of the prevailing competitive dynamics, offering valuable insights into market trends and opportunities.
Key Drivers of Smart Farm Market Growth
Several key factors are driving the growth of the Smart Farm Market. These include:
- Technological advancements: The development of AI, IoT, and big data analytics is revolutionizing agricultural practices, leading to increased efficiency and higher yields.
- Government initiatives: Government policies supporting sustainable agriculture and precision farming are fostering market growth through subsidies, grants, and other supportive programs.
- Rising food demand: The global population is growing rapidly, increasing the demand for food, which drives the need for more efficient and sustainable agricultural practices.
Challenges in the Smart Farm Market Sector
Despite its immense potential and promising trajectory, the Smart Farm Market is not without its hurdles. Several key challenges demand strategic attention and innovative solutions:
- High Initial Investment Costs: The procurement and implementation of advanced smart farm technologies often necessitate substantial upfront capital expenditures. This can present a significant barrier to entry, particularly for smaller-scale farmers and those operating with tighter budgets.
- Data Security and Privacy Concerns: As agricultural operations become increasingly reliant on the collection and analysis of vast amounts of data, robust security protocols become paramount. Concerns surrounding potential data breaches, unauthorized access, and ensuring the privacy of sensitive operational information require continuous vigilance and the deployment of sophisticated cybersecurity measures.
- Lack of Skilled Labor: The effective deployment, operation, and maintenance of sophisticated smart farm technologies necessitate a workforce possessing specialized skills. This creates a growing demand for trained professionals, from data scientists and agronomists to robotics technicians, highlighting a critical need for educational and training initiatives.
- Interoperability and Standardization: A lack of seamless integration between different smart farm technologies and platforms can hinder widespread adoption. Establishing industry-wide standards for data exchange and system compatibility is crucial for maximizing the benefits of a connected farm ecosystem.
Emerging Opportunities in Smart Farm Market
The Smart Farm Market is brimming with exciting and transformative opportunities that are poised to reshape the future of agriculture:
- Expansion into Developing Countries: Developing nations, characterized by their large agricultural sectors and growing populations, represent a vast and largely untapped market for smart farm solutions. Tailored, affordable, and accessible technologies can drive significant improvements in food security and farmer livelihoods in these regions.
- Integration with Blockchain Technology: The synergy between smart farming and blockchain technology offers profound advantages. Blockchain can dramatically enhance food traceability from farm to fork, streamline and secure supply chain management, and foster increased trust and transparency among consumers by providing verifiable information about food production.
- Development of Vertical Farming Solutions: Vertical farming, a revolutionary approach to agriculture, offers the potential to dramatically increase food production within urban environments, minimizing land use and reducing the environmental impact associated with traditional farming. These systems are ideal for localized food production and can contribute to greater food resilience.
- Focus on Sustainable and Regenerative Agriculture: As global awareness of climate change and environmental sustainability grows, there is a burgeoning demand for smart farm technologies that actively support and enhance sustainable and regenerative agricultural practices. Innovations that focus on soil health, biodiversity, and reduced chemical inputs are particularly promising.
Leading Players in the Smart Farm Market Market
- Deere & Company
- Trimble Inc
- Topcon Positioning Systems
- Allflex Livestock Intelligence
- Farmers Edge Inc
- Innovasea Systems Inc
- AgriData Incorporated
- AGCO Corporation
- Gamaya
- IBM Corporation
- Raven Industries
- CNH Industrial
- Valmont Industries
- Kubota Corporation
Key Developments in Smart Farm Market Industry
- January 2024: Deere & Company partnered with SpaceX to provide Starlink satellite communication services to agricultural producers, enhancing connectivity in rural areas.
- February 2024: AgriData Incorporated secured further investment to accelerate the development of its AI-powered crop monitoring technology for greenhouses.
Strategic Outlook for Smart Farm Market Market
The Smart Farm Market is poised for sustained growth, driven by technological advancements, rising food demand, and increasing government support. The integration of AI, IoT, and big data analytics will further revolutionize agricultural practices, leading to improved efficiency, sustainability, and profitability. The market presents significant opportunities for existing players and new entrants alike, paving the way for a more technologically advanced and sustainable food production system.
Smart Farm Market Segmentation
-
1. Offering
- 1.1. Hardware
- 1.2. Software
- 1.3. Services
-
2. Application
- 2.1. Precision Farming
- 2.2. Livestock Monitoring
- 2.3. Smart Greenhouse
- 2.4. Field Mapping
- 2.5. Farm Labour Management
- 2.6. Others
Smart Farm Market Segmentation By Geography
- 1. North America
- 2. Europe
- 3. Asia
- 4. Australia and New Zealand
- 5. Latin America
- 6. Middle East and Africa
Smart Farm Market Regional Market Share
Geographic Coverage of Smart Farm Market
Smart Farm Market REPORT HIGHLIGHTS
| Aspects | Details |
|---|---|
| Study Period | 2020-2034 |
| Base Year | 2025 |
| Estimated Year | 2026 |
| Forecast Period | 2026-2034 |
| Historical Period | 2020-2025 |
| Growth Rate | CAGR of 9.80% from 2020-2034 |
| Segmentation |
|
Table of Contents
- 1. Introduction
- 1.1. Research Scope
- 1.2. Market Segmentation
- 1.3. Research Objective
- 1.4. Definitions and Assumptions
- 2. Executive Summary
- 2.1. Market Snapshot
- 3. Market Dynamics
- 3.1. Market Drivers
- 3.2. Market Restrains
- 3.3. Market Trends
- 3.4. Market Opportunities
- 4. Market Factor Analysis
- 4.1. Porters Five Forces
- 4.1.1. Bargaining Power of Suppliers
- 4.1.2. Bargaining Power of Buyers
- 4.1.3. Threat of New Entrants
- 4.1.4. Threat of Substitutes
- 4.1.5. Competitive Rivalry
- 4.2. PESTEL analysis
- 4.3. BCG Analysis
- 4.3.1. Stars (High Growth, High Market Share)
- 4.3.2. Cash Cows (Low Growth, High Market Share)
- 4.3.3. Question Mark (High Growth, Low Market Share)
- 4.3.4. Dogs (Low Growth, Low Market Share)
- 4.4. Ansoff Matrix Analysis
- 4.5. Supply Chain Analysis
- 4.6. Regulatory Landscape
- 4.7. Current Market Potential and Opportunity Assessment (TAM–SAM–SOM Framework)
- 4.8. RAX Analyst Note
- 4.1. Porters Five Forces
- 5. Market Analysis, Insights and Forecast 2021-2033
- 5.1. Market Analysis, Insights and Forecast - by Offering
- 5.1.1. Hardware
- 5.1.2. Software
- 5.1.3. Services
- 5.2. Market Analysis, Insights and Forecast - by Application
- 5.2.1. Precision Farming
- 5.2.2. Livestock Monitoring
- 5.2.3. Smart Greenhouse
- 5.2.4. Field Mapping
- 5.2.5. Farm Labour Management
- 5.2.6. Others
- 5.3. Market Analysis, Insights and Forecast - by Region
- 5.3.1. North America
- 5.3.2. Europe
- 5.3.3. Asia
- 5.3.4. Australia and New Zealand
- 5.3.5. Latin America
- 5.3.6. Middle East and Africa
- 5.1. Market Analysis, Insights and Forecast - by Offering
- 6. Global Smart Farm Market Analysis, Insights and Forecast, 2021-2033
- 6.1. Market Analysis, Insights and Forecast - by Offering
- 6.1.1. Hardware
- 6.1.2. Software
- 6.1.3. Services
- 6.2. Market Analysis, Insights and Forecast - by Application
- 6.2.1. Precision Farming
- 6.2.2. Livestock Monitoring
- 6.2.3. Smart Greenhouse
- 6.2.4. Field Mapping
- 6.2.5. Farm Labour Management
- 6.2.6. Others
- 6.1. Market Analysis, Insights and Forecast - by Offering
- 7. North America Smart Farm Market Analysis, Insights and Forecast, 2020-2032
- 7.1. Market Analysis, Insights and Forecast - by Offering
- 7.1.1. Hardware
- 7.1.2. Software
- 7.1.3. Services
- 7.2. Market Analysis, Insights and Forecast - by Application
- 7.2.1. Precision Farming
- 7.2.2. Livestock Monitoring
- 7.2.3. Smart Greenhouse
- 7.2.4. Field Mapping
- 7.2.5. Farm Labour Management
- 7.2.6. Others
- 7.1. Market Analysis, Insights and Forecast - by Offering
- 8. Europe Smart Farm Market Analysis, Insights and Forecast, 2020-2032
- 8.1. Market Analysis, Insights and Forecast - by Offering
- 8.1.1. Hardware
- 8.1.2. Software
- 8.1.3. Services
- 8.2. Market Analysis, Insights and Forecast - by Application
- 8.2.1. Precision Farming
- 8.2.2. Livestock Monitoring
- 8.2.3. Smart Greenhouse
- 8.2.4. Field Mapping
- 8.2.5. Farm Labour Management
- 8.2.6. Others
- 8.1. Market Analysis, Insights and Forecast - by Offering
- 9. Asia Smart Farm Market Analysis, Insights and Forecast, 2020-2032
- 9.1. Market Analysis, Insights and Forecast - by Offering
- 9.1.1. Hardware
- 9.1.2. Software
- 9.1.3. Services
- 9.2. Market Analysis, Insights and Forecast - by Application
- 9.2.1. Precision Farming
- 9.2.2. Livestock Monitoring
- 9.2.3. Smart Greenhouse
- 9.2.4. Field Mapping
- 9.2.5. Farm Labour Management
- 9.2.6. Others
- 9.1. Market Analysis, Insights and Forecast - by Offering
- 10. Australia and New Zealand Smart Farm Market Analysis, Insights and Forecast, 2020-2032
- 10.1. Market Analysis, Insights and Forecast - by Offering
- 10.1.1. Hardware
- 10.1.2. Software
- 10.1.3. Services
- 10.2. Market Analysis, Insights and Forecast - by Application
- 10.2.1. Precision Farming
- 10.2.2. Livestock Monitoring
- 10.2.3. Smart Greenhouse
- 10.2.4. Field Mapping
- 10.2.5. Farm Labour Management
- 10.2.6. Others
- 10.1. Market Analysis, Insights and Forecast - by Offering
- 11. Latin America Smart Farm Market Analysis, Insights and Forecast, 2020-2032
- 11.1. Market Analysis, Insights and Forecast - by Offering
- 11.1.1. Hardware
- 11.1.2. Software
- 11.1.3. Services
- 11.2. Market Analysis, Insights and Forecast - by Application
- 11.2.1. Precision Farming
- 11.2.2. Livestock Monitoring
- 11.2.3. Smart Greenhouse
- 11.2.4. Field Mapping
- 11.2.5. Farm Labour Management
- 11.2.6. Others
- 11.1. Market Analysis, Insights and Forecast - by Offering
- 12. Middle East and Africa Smart Farm Market Analysis, Insights and Forecast, 2020-2032
- 12.1. Market Analysis, Insights and Forecast - by Offering
- 12.1.1. Hardware
- 12.1.2. Software
- 12.1.3. Services
- 12.2. Market Analysis, Insights and Forecast - by Application
- 12.2.1. Precision Farming
- 12.2.2. Livestock Monitoring
- 12.2.3. Smart Greenhouse
- 12.2.4. Field Mapping
- 12.2.5. Farm Labour Management
- 12.2.6. Others
- 12.1. Market Analysis, Insights and Forecast - by Offering
- 13. Competitive Analysis
- 13.1. Company Profiles
- 13.1.1 Deere & Company
- 13.1.1.1. Company Overview
- 13.1.1.2. Products
- 13.1.1.3. Company Financials
- 13.1.1.4. SWOT Analysis
- 13.1.2 Trimble Inc
- 13.1.2.1. Company Overview
- 13.1.2.2. Products
- 13.1.2.3. Company Financials
- 13.1.2.4. SWOT Analysis
- 13.1.3 Topcon Positioning Systems
- 13.1.3.1. Company Overview
- 13.1.3.2. Products
- 13.1.3.3. Company Financials
- 13.1.3.4. SWOT Analysis
- 13.1.4 Allflex Livestock Intelligence
- 13.1.4.1. Company Overview
- 13.1.4.2. Products
- 13.1.4.3. Company Financials
- 13.1.4.4. SWOT Analysis
- 13.1.5 Farmers Edge Inc
- 13.1.5.1. Company Overview
- 13.1.5.2. Products
- 13.1.5.3. Company Financials
- 13.1.5.4. SWOT Analysis
- 13.1.6 Innovasea Systems Inc
- 13.1.6.1. Company Overview
- 13.1.6.2. Products
- 13.1.6.3. Company Financials
- 13.1.6.4. SWOT Analysis
- 13.1.7 AgriData Incorporated
- 13.1.7.1. Company Overview
- 13.1.7.2. Products
- 13.1.7.3. Company Financials
- 13.1.7.4. SWOT Analysis
- 13.1.8 AGCO Corporation
- 13.1.8.1. Company Overview
- 13.1.8.2. Products
- 13.1.8.3. Company Financials
- 13.1.8.4. SWOT Analysis
- 13.1.9 Gamaya
- 13.1.9.1. Company Overview
- 13.1.9.2. Products
- 13.1.9.3. Company Financials
- 13.1.9.4. SWOT Analysis
- 13.1.10 IBM Corporatio
- 13.1.10.1. Company Overview
- 13.1.10.2. Products
- 13.1.10.3. Company Financials
- 13.1.10.4. SWOT Analysis
- 13.1.1 Deere & Company
- 13.2. Market Entropy
- 13.2.1 Company's Key Areas Served
- 13.2.2 Recent Developments
- 13.3. Company Market Share Analysis 2025
- 13.3.1 Top 5 Companies Market Share Analysis
- 13.3.2 Top 3 Companies Market Share Analysis
- 13.4. List of Potential Customers
- 14. Research Methodology
List of Figures
- Figure 1: Global Smart Farm Market Revenue Breakdown (Million, %) by Region 2025 & 2033
- Figure 2: Global Smart Farm Market Volume Breakdown (Billion, %) by Region 2025 & 2033
- Figure 3: North America Smart Farm Market Revenue (Million), by Offering 2025 & 2033
- Figure 4: North America Smart Farm Market Volume (Billion), by Offering 2025 & 2033
- Figure 5: North America Smart Farm Market Revenue Share (%), by Offering 2025 & 2033
- Figure 6: North America Smart Farm Market Volume Share (%), by Offering 2025 & 2033
- Figure 7: North America Smart Farm Market Revenue (Million), by Application 2025 & 2033
- Figure 8: North America Smart Farm Market Volume (Billion), by Application 2025 & 2033
- Figure 9: North America Smart Farm Market Revenue Share (%), by Application 2025 & 2033
- Figure 10: North America Smart Farm Market Volume Share (%), by Application 2025 & 2033
- Figure 11: North America Smart Farm Market Revenue (Million), by Country 2025 & 2033
- Figure 12: North America Smart Farm Market Volume (Billion), by Country 2025 & 2033
- Figure 13: North America Smart Farm Market Revenue Share (%), by Country 2025 & 2033
- Figure 14: North America Smart Farm Market Volume Share (%), by Country 2025 & 2033
- Figure 15: Europe Smart Farm Market Revenue (Million), by Offering 2025 & 2033
- Figure 16: Europe Smart Farm Market Volume (Billion), by Offering 2025 & 2033
- Figure 17: Europe Smart Farm Market Revenue Share (%), by Offering 2025 & 2033
- Figure 18: Europe Smart Farm Market Volume Share (%), by Offering 2025 & 2033
- Figure 19: Europe Smart Farm Market Revenue (Million), by Application 2025 & 2033
- Figure 20: Europe Smart Farm Market Volume (Billion), by Application 2025 & 2033
- Figure 21: Europe Smart Farm Market Revenue Share (%), by Application 2025 & 2033
- Figure 22: Europe Smart Farm Market Volume Share (%), by Application 2025 & 2033
- Figure 23: Europe Smart Farm Market Revenue (Million), by Country 2025 & 2033
- Figure 24: Europe Smart Farm Market Volume (Billion), by Country 2025 & 2033
- Figure 25: Europe Smart Farm Market Revenue Share (%), by Country 2025 & 2033
- Figure 26: Europe Smart Farm Market Volume Share (%), by Country 2025 & 2033
- Figure 27: Asia Smart Farm Market Revenue (Million), by Offering 2025 & 2033
- Figure 28: Asia Smart Farm Market Volume (Billion), by Offering 2025 & 2033
- Figure 29: Asia Smart Farm Market Revenue Share (%), by Offering 2025 & 2033
- Figure 30: Asia Smart Farm Market Volume Share (%), by Offering 2025 & 2033
- Figure 31: Asia Smart Farm Market Revenue (Million), by Application 2025 & 2033
- Figure 32: Asia Smart Farm Market Volume (Billion), by Application 2025 & 2033
- Figure 33: Asia Smart Farm Market Revenue Share (%), by Application 2025 & 2033
- Figure 34: Asia Smart Farm Market Volume Share (%), by Application 2025 & 2033
- Figure 35: Asia Smart Farm Market Revenue (Million), by Country 2025 & 2033
- Figure 36: Asia Smart Farm Market Volume (Billion), by Country 2025 & 2033
- Figure 37: Asia Smart Farm Market Revenue Share (%), by Country 2025 & 2033
- Figure 38: Asia Smart Farm Market Volume Share (%), by Country 2025 & 2033
- Figure 39: Australia and New Zealand Smart Farm Market Revenue (Million), by Offering 2025 & 2033
- Figure 40: Australia and New Zealand Smart Farm Market Volume (Billion), by Offering 2025 & 2033
- Figure 41: Australia and New Zealand Smart Farm Market Revenue Share (%), by Offering 2025 & 2033
- Figure 42: Australia and New Zealand Smart Farm Market Volume Share (%), by Offering 2025 & 2033
- Figure 43: Australia and New Zealand Smart Farm Market Revenue (Million), by Application 2025 & 2033
- Figure 44: Australia and New Zealand Smart Farm Market Volume (Billion), by Application 2025 & 2033
- Figure 45: Australia and New Zealand Smart Farm Market Revenue Share (%), by Application 2025 & 2033
- Figure 46: Australia and New Zealand Smart Farm Market Volume Share (%), by Application 2025 & 2033
- Figure 47: Australia and New Zealand Smart Farm Market Revenue (Million), by Country 2025 & 2033
- Figure 48: Australia and New Zealand Smart Farm Market Volume (Billion), by Country 2025 & 2033
- Figure 49: Australia and New Zealand Smart Farm Market Revenue Share (%), by Country 2025 & 2033
- Figure 50: Australia and New Zealand Smart Farm Market Volume Share (%), by Country 2025 & 2033
- Figure 51: Latin America Smart Farm Market Revenue (Million), by Offering 2025 & 2033
- Figure 52: Latin America Smart Farm Market Volume (Billion), by Offering 2025 & 2033
- Figure 53: Latin America Smart Farm Market Revenue Share (%), by Offering 2025 & 2033
- Figure 54: Latin America Smart Farm Market Volume Share (%), by Offering 2025 & 2033
- Figure 55: Latin America Smart Farm Market Revenue (Million), by Application 2025 & 2033
- Figure 56: Latin America Smart Farm Market Volume (Billion), by Application 2025 & 2033
- Figure 57: Latin America Smart Farm Market Revenue Share (%), by Application 2025 & 2033
- Figure 58: Latin America Smart Farm Market Volume Share (%), by Application 2025 & 2033
- Figure 59: Latin America Smart Farm Market Revenue (Million), by Country 2025 & 2033
- Figure 60: Latin America Smart Farm Market Volume (Billion), by Country 2025 & 2033
- Figure 61: Latin America Smart Farm Market Revenue Share (%), by Country 2025 & 2033
- Figure 62: Latin America Smart Farm Market Volume Share (%), by Country 2025 & 2033
- Figure 63: Middle East and Africa Smart Farm Market Revenue (Million), by Offering 2025 & 2033
- Figure 64: Middle East and Africa Smart Farm Market Volume (Billion), by Offering 2025 & 2033
- Figure 65: Middle East and Africa Smart Farm Market Revenue Share (%), by Offering 2025 & 2033
- Figure 66: Middle East and Africa Smart Farm Market Volume Share (%), by Offering 2025 & 2033
- Figure 67: Middle East and Africa Smart Farm Market Revenue (Million), by Application 2025 & 2033
- Figure 68: Middle East and Africa Smart Farm Market Volume (Billion), by Application 2025 & 2033
- Figure 69: Middle East and Africa Smart Farm Market Revenue Share (%), by Application 2025 & 2033
- Figure 70: Middle East and Africa Smart Farm Market Volume Share (%), by Application 2025 & 2033
- Figure 71: Middle East and Africa Smart Farm Market Revenue (Million), by Country 2025 & 2033
- Figure 72: Middle East and Africa Smart Farm Market Volume (Billion), by Country 2025 & 2033
- Figure 73: Middle East and Africa Smart Farm Market Revenue Share (%), by Country 2025 & 2033
- Figure 74: Middle East and Africa Smart Farm Market Volume Share (%), by Country 2025 & 2033
List of Tables
- Table 1: Global Smart Farm Market Revenue Million Forecast, by Offering 2020 & 2033
- Table 2: Global Smart Farm Market Volume Billion Forecast, by Offering 2020 & 2033
- Table 3: Global Smart Farm Market Revenue Million Forecast, by Application 2020 & 2033
- Table 4: Global Smart Farm Market Volume Billion Forecast, by Application 2020 & 2033
- Table 5: Global Smart Farm Market Revenue Million Forecast, by Region 2020 & 2033
- Table 6: Global Smart Farm Market Volume Billion Forecast, by Region 2020 & 2033
- Table 7: Global Smart Farm Market Revenue Million Forecast, by Offering 2020 & 2033
- Table 8: Global Smart Farm Market Volume Billion Forecast, by Offering 2020 & 2033
- Table 9: Global Smart Farm Market Revenue Million Forecast, by Application 2020 & 2033
- Table 10: Global Smart Farm Market Volume Billion Forecast, by Application 2020 & 2033
- Table 11: Global Smart Farm Market Revenue Million Forecast, by Country 2020 & 2033
- Table 12: Global Smart Farm Market Volume Billion Forecast, by Country 2020 & 2033
- Table 13: Global Smart Farm Market Revenue Million Forecast, by Offering 2020 & 2033
- Table 14: Global Smart Farm Market Volume Billion Forecast, by Offering 2020 & 2033
- Table 15: Global Smart Farm Market Revenue Million Forecast, by Application 2020 & 2033
- Table 16: Global Smart Farm Market Volume Billion Forecast, by Application 2020 & 2033
- Table 17: Global Smart Farm Market Revenue Million Forecast, by Country 2020 & 2033
- Table 18: Global Smart Farm Market Volume Billion Forecast, by Country 2020 & 2033
- Table 19: Global Smart Farm Market Revenue Million Forecast, by Offering 2020 & 2033
- Table 20: Global Smart Farm Market Volume Billion Forecast, by Offering 2020 & 2033
- Table 21: Global Smart Farm Market Revenue Million Forecast, by Application 2020 & 2033
- Table 22: Global Smart Farm Market Volume Billion Forecast, by Application 2020 & 2033
- Table 23: Global Smart Farm Market Revenue Million Forecast, by Country 2020 & 2033
- Table 24: Global Smart Farm Market Volume Billion Forecast, by Country 2020 & 2033
- Table 25: Global Smart Farm Market Revenue Million Forecast, by Offering 2020 & 2033
- Table 26: Global Smart Farm Market Volume Billion Forecast, by Offering 2020 & 2033
- Table 27: Global Smart Farm Market Revenue Million Forecast, by Application 2020 & 2033
- Table 28: Global Smart Farm Market Volume Billion Forecast, by Application 2020 & 2033
- Table 29: Global Smart Farm Market Revenue Million Forecast, by Country 2020 & 2033
- Table 30: Global Smart Farm Market Volume Billion Forecast, by Country 2020 & 2033
- Table 31: Global Smart Farm Market Revenue Million Forecast, by Offering 2020 & 2033
- Table 32: Global Smart Farm Market Volume Billion Forecast, by Offering 2020 & 2033
- Table 33: Global Smart Farm Market Revenue Million Forecast, by Application 2020 & 2033
- Table 34: Global Smart Farm Market Volume Billion Forecast, by Application 2020 & 2033
- Table 35: Global Smart Farm Market Revenue Million Forecast, by Country 2020 & 2033
- Table 36: Global Smart Farm Market Volume Billion Forecast, by Country 2020 & 2033
- Table 37: Global Smart Farm Market Revenue Million Forecast, by Offering 2020 & 2033
- Table 38: Global Smart Farm Market Volume Billion Forecast, by Offering 2020 & 2033
- Table 39: Global Smart Farm Market Revenue Million Forecast, by Application 2020 & 2033
- Table 40: Global Smart Farm Market Volume Billion Forecast, by Application 2020 & 2033
- Table 41: Global Smart Farm Market Revenue Million Forecast, by Country 2020 & 2033
- Table 42: Global Smart Farm Market Volume Billion Forecast, by Country 2020 & 2033
Frequently Asked Questions
1. What is the projected Compound Annual Growth Rate (CAGR) of the Smart Farm Market?
The projected CAGR is approximately 9.80%.
2. Which companies are prominent players in the Smart Farm Market?
Key companies in the market include Deere & Company, Trimble Inc, Topcon Positioning Systems, Allflex Livestock Intelligence, Farmers Edge Inc, Innovasea Systems Inc, AgriData Incorporated, AGCO Corporation, Gamaya, IBM Corporatio.
3. What are the main segments of the Smart Farm Market?
The market segments include Offering, Application.
4. Can you provide details about the market size?
The market size is estimated to be USD 16.82 Million as of 2022.
5. What are some drivers contributing to market growth?
Increasing Adoption of Advanced Farming Technologies; Rising Government Initiative to Boost the Agriculture Industry in Emerging Economies.
6. What are the notable trends driving market growth?
Precision Farming is Expected to Hold Major Market Share.
7. Are there any restraints impacting market growth?
Increasing Adoption of Advanced Farming Technologies; Rising Government Initiative to Boost the Agriculture Industry in Emerging Economies.
8. Can you provide examples of recent developments in the market?
February 2024 - AgriData revealed that its innovative solutions improve agricultural practices for growers by utilizing AI-powered crop monitoring technology specifically tailored for greenhouses. The company obtained further investment from its existing investors. This influx of capital enables the company to accelerate its market’s growth and enhance the development of its camera systems and computer vision software.
9. What pricing options are available for accessing the report?
Pricing options include single-user, multi-user, and enterprise licenses priced at USD 4750, USD 5250, and USD 8750 respectively.
10. Is the market size provided in terms of value or volume?
The market size is provided in terms of value, measured in Million and volume, measured in Billion.
11. Are there any specific market keywords associated with the report?
Yes, the market keyword associated with the report is "Smart Farm Market," which aids in identifying and referencing the specific market segment covered.
12. How do I determine which pricing option suits my needs best?
The pricing options vary based on user requirements and access needs. Individual users may opt for single-user licenses, while businesses requiring broader access may choose multi-user or enterprise licenses for cost-effective access to the report.
13. Are there any additional resources or data provided in the Smart Farm Market report?
While the report offers comprehensive insights, it's advisable to review the specific contents or supplementary materials provided to ascertain if additional resources or data are available.
14. How can I stay updated on further developments or reports in the Smart Farm Market?
To stay informed about further developments, trends, and reports in the Smart Farm Market, consider subscribing to industry newsletters, following relevant companies and organizations, or regularly checking reputable industry news sources and publications.
Methodology
Step 1 - Identification of Relevant Samples Size from Population Database


Step 2 - Approaches for Defining Global Market Size (Value, Volume* & Price*)

Note*: In applicable scenarios
Step 3 - Data Sources
Primary Research
- Web Analytics
- Survey Reports
- Research Institute
- Latest Research Reports
- Opinion Leaders
Secondary Research
- Annual Reports
- White Paper
- Latest Press Release
- Industry Association
- Paid Database
- Investor Presentations

Step 4 - Data Triangulation
Involves using different sources of information in order to increase the validity of a study
These sources are likely to be stakeholders in a program - participants, other researchers, program staff, other community members, and so on.
Then we put all data in single framework & apply various statistical tools to find out the dynamic on the market.
During the analysis stage, feedback from the stakeholder groups would be compared to determine areas of agreement as well as areas of divergence