
Key Insights
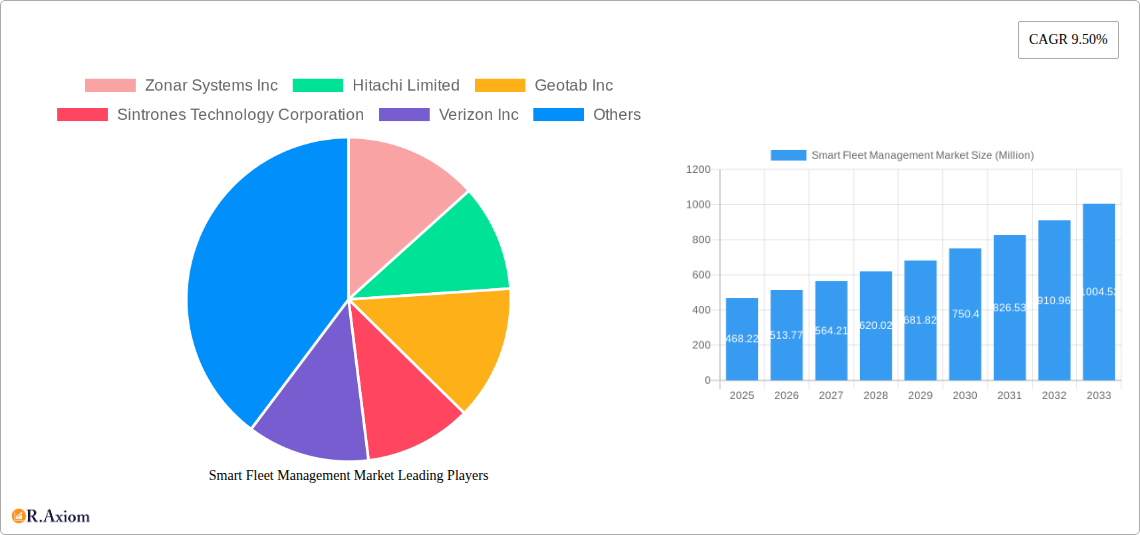
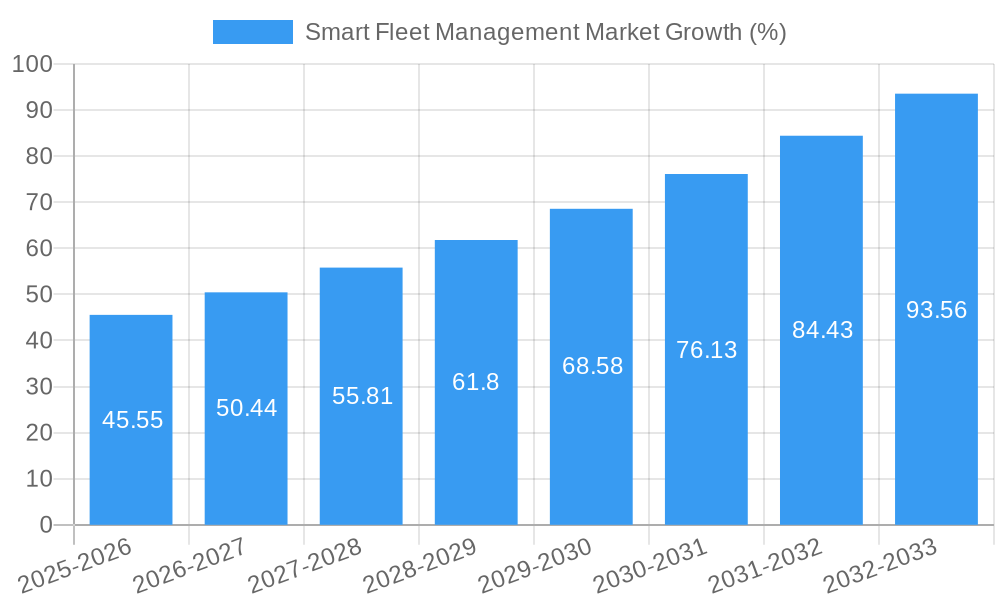
The Smart Fleet Management market is experiencing robust growth, projected to reach \$468.22 million in 2025 and maintain a Compound Annual Growth Rate (CAGR) of 9.50% from 2025 to 2033. This expansion is driven by several key factors. Increasing fuel costs and the need for enhanced operational efficiency are compelling businesses across various sectors – transportation, logistics, and construction – to adopt smart fleet management solutions. These solutions offer real-time vehicle tracking, driver behavior monitoring, predictive maintenance alerts, and fuel optimization tools, leading to significant cost savings and improved productivity. Furthermore, the growing adoption of connected vehicles and the increasing availability of advanced technologies like IoT sensors, AI-powered analytics, and 5G connectivity are fueling market growth. Government regulations promoting safety and environmental sustainability are also contributing to the wider acceptance of smart fleet management systems.
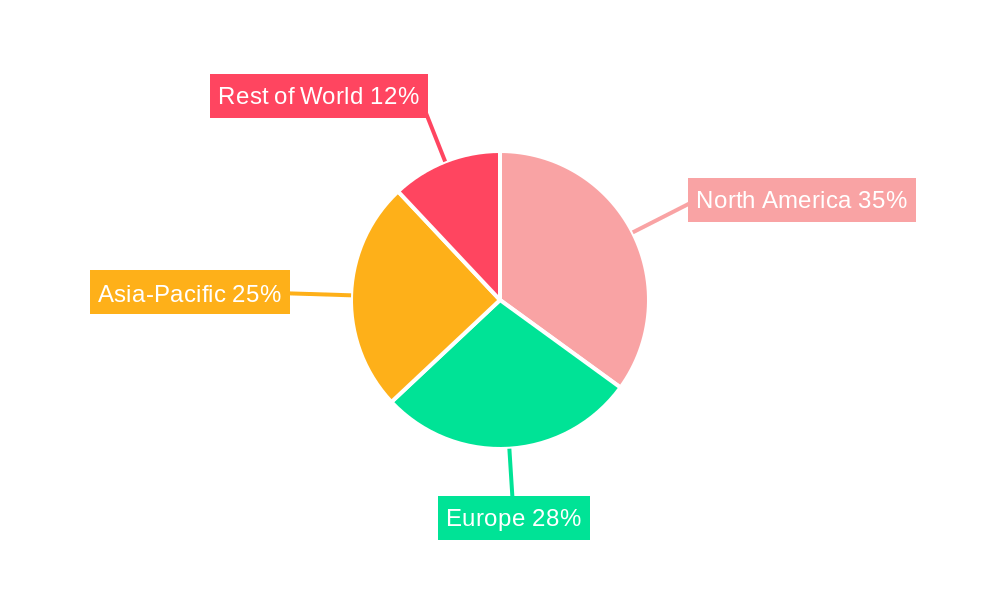
Competition in the market is intense, with established players like Zonar Systems Inc, Hitachi Limited, Geotab Inc, and newer entrants vying for market share. The market is segmented based on various factors, including deployment type (cloud-based, on-premise), solution type (fleet tracking, driver behavior monitoring, maintenance management), and vehicle type (light commercial vehicles, heavy commercial vehicles). While detailed regional data is not provided, considering global trends, we can anticipate strong growth across North America and Europe, driven by higher adoption rates and technological advancements. Asia-Pacific is expected to show significant growth potential in the coming years, driven by increasing infrastructure development and a burgeoning logistics sector. The market's future growth will depend on technological innovation, expansion into emerging markets, and the continuous development of user-friendly and cost-effective solutions.
Smart Fleet Management Market: A Comprehensive Report (2019-2033)
This in-depth report provides a comprehensive analysis of the Smart Fleet Management Market, offering actionable insights for industry stakeholders. Covering the period from 2019 to 2033, with a base year of 2025 and a forecast period of 2025-2033, this report leverages extensive data and analysis to present a clear picture of market dynamics, growth drivers, challenges, and emerging opportunities. The report analyzes market concentration, innovation, industry trends, dominant segments, and key players, providing a detailed understanding of this rapidly evolving sector. The market is projected to reach xx Million by 2033, exhibiting a CAGR of xx% during the forecast period.
Smart Fleet Management Market Market Concentration & Innovation
The Smart Fleet Management market exhibits a moderately concentrated landscape, with several major players commanding significant market share. However, the presence of numerous smaller, specialized companies indicates a dynamic and competitive environment. Key players like Zonar Systems Inc, Hitachi Limited, Geotab Inc, and Samsara Inc., control a significant portion (xx%) of the market, while others including Sintrones Technology Corporation, Verizon Inc, Teletrac Navman US Limited, Inseego Corporation, Sierra Wireless Inc, and Continental AG contribute to the remaining share. Market share fluctuations are influenced by factors such as technological advancements, strategic partnerships, and mergers and acquisitions (M&A). Innovation is a crucial driver, with companies constantly developing solutions incorporating AI, IoT, and big data analytics. Regulatory frameworks, particularly those focused on data privacy and security, significantly influence market dynamics. The emergence of alternative solutions, such as traditional fleet management methods, presents some level of substitution pressure, but their limitations in data analysis and efficiency are diminishing their market share. End-user preferences are shifting towards integrated, cloud-based systems offering real-time data and advanced analytics. Recent M&A activity reflects strategic efforts by larger players to expand their market reach and enhance their technological capabilities. The total value of M&A deals in the last five years is estimated at xx Million, highlighting the intense consolidation underway.
- Market Concentration: Moderately concentrated, with top 5 players holding xx% market share.
- Innovation Drivers: AI, IoT, Big Data analytics, Cloud Computing
- Regulatory Factors: Data privacy regulations (GDPR, CCPA), cybersecurity standards
- Product Substitutes: Traditional fleet management systems
- End-User Trends: Demand for integrated, cloud-based solutions with real-time data.
- M&A Activity: xx Million in M&A deal value over the past five years.
Smart Fleet Management Market Industry Trends & Insights
The Smart Fleet Management market is experiencing robust growth, driven by increasing demand for enhanced fleet efficiency, improved safety measures, reduced operational costs, and the growing adoption of telematics technologies. The market is witnessing significant technological disruptions, with the integration of AI, machine learning, and predictive analytics enhancing fleet optimization and risk management capabilities. Consumer preferences are shifting towards solutions offering greater flexibility, scalability, and ease of integration with existing systems. The competitive landscape is highly dynamic, characterized by intense competition among established players and emerging startups. This intense competition is spurring innovation and driving down prices, making the technology more accessible to a wider range of businesses. The market is exhibiting significant regional variations in growth rates, with North America and Europe currently leading in adoption. The overall market is projected to achieve a Compound Annual Growth Rate (CAGR) of xx% during the forecast period, signifying considerable market expansion. Market penetration is currently at xx%, with significant growth potential in untapped markets.
Dominant Markets & Segments in Smart Fleet Management Market
The North American region currently dominates the Smart Fleet Management market, fueled by high technological adoption, robust infrastructure, and stringent regulatory standards. Within North America, the United States holds the largest market share. Key drivers contributing to this dominance include:
- Advanced Technological Infrastructure: Extensive network connectivity and readily available technology support.
- Stringent Safety and Compliance Regulations: Government mandates drive adoption of smart fleet solutions.
- High Vehicle Density and Logistics Activity: The large number of commercial vehicles necessitates efficient management solutions.
- Early Adoption of Telematics and IoT Technologies: Greater familiarity and acceptance of these technologies among businesses.
Other regions, including Europe and Asia Pacific, are also experiencing significant growth, but their overall market share remains lower than North America due to factors such as varied technological adoption rates, and varying levels of regulatory support and infrastructure development.
Smart Fleet Management Market Product Developments
Recent product innovations focus on improving data analytics capabilities, enhancing user interfaces, and integrating advanced features like AI-powered predictive maintenance and driver behavior monitoring. These developments aim to optimize fleet operations, improve safety, and reduce overall costs. The market is witnessing a trend toward cloud-based, Software-as-a-Service (SaaS) solutions, offering greater flexibility and scalability. The competitive advantage is increasingly centered on data analytics capabilities, integration with third-party systems, and the ability to provide actionable insights to clients.
Report Scope & Segmentation Analysis
This report segments the Smart Fleet Management market based on several key parameters:
By Vehicle Type: This segment includes passenger cars, light commercial vehicles, heavy commercial vehicles, and others. Growth in heavy commercial vehicle segments is higher due to the increasing pressure on optimizing their efficiency. The market size for each segment varies, with heavy commercial vehicles representing the largest segment due to high operational costs and efficiency needs.
By Solution: This segment includes hardware (GPS trackers, sensors), software (fleet management software, route optimization software), and services (installation, maintenance, support). Software solutions are exhibiting faster growth due to increased demand for data analytics and insights.
By Deployment: This includes cloud-based and on-premise deployments. Cloud-based solutions are gaining traction because of scalability and cost-effectiveness.
By End-user: This segment comprises transportation and logistics, construction, and other industries. Transportation and logistics dominate the market due to large fleet sizes.
Key Drivers of Smart Fleet Management Market Growth
Several factors propel the growth of the Smart Fleet Management market:
- Increasing Fuel Costs and Operational Efficiency: Businesses are seeking ways to optimize fuel consumption and reduce operational expenses.
- Stringent Regulatory Compliance: Regulations mandating fleet safety and emission standards drive adoption.
- Technological Advancements: The continuous integration of AI, IoT, and Big Data analytics enhances capabilities.
- Improved Driver Safety and Reduced Accidents: Smart fleet management solutions contribute to improved driver behavior and reduced accidents.
Challenges in the Smart Fleet Management Market Sector
Despite its growth potential, the Smart Fleet Management market faces several challenges:
- High Initial Investment Costs: The implementation of smart fleet management systems can require significant upfront investments.
- Data Security and Privacy Concerns: Protecting sensitive data related to fleet operations and driver information is paramount.
- Integration Complexity: Integrating various systems and platforms can be technically complex and time-consuming.
- Lack of Skilled Workforce: The market needs trained professionals to manage and interpret data from smart fleet systems.
Emerging Opportunities in Smart Fleet Management Market
Emerging trends present exciting opportunities:
- Expansion into Untapped Markets: Developing economies offer significant growth potential for smart fleet management solutions.
- Integration of Advanced Technologies: Advancements in AI, machine learning, and autonomous driving will further enhance market capabilities.
- Focus on Sustainability: Demand for solutions supporting fuel efficiency and emissions reduction will drive adoption.
- Development of Specialized Solutions: Tailored solutions for specific industries will offer significant growth potential.
Leading Players in the Smart Fleet Management Market Market
- Zonar Systems Inc
- Hitachi Limited
- Geotab Inc
- Sintrones Technology Corporation
- Verizon Inc
- Teletrac Navman US Limited
- Inseego Corporation
- Sierra Wireless Inc
- Samsara Inc
- Continental AG
- *List Not Exhaustive
Key Developments in Smart Fleet Management Industry
- June 2024: Spinergie's smart fleet management solution adopted by AsianBulk Logistics (ABL) for enhanced global transshipment operations. This highlights the increasing adoption of smart fleet solutions in the maritime sector.
- April 2024: Seaward Services implements Spinergie's solution across its fleet of offshore service vessels, demonstrating the expansion of smart fleet management into the offshore wind energy sector.
Strategic Outlook for Smart Fleet Management Market Market
The Smart Fleet Management market is poised for continued strong growth, driven by technological advancements, increasing demand for operational efficiency, and the growing need for enhanced safety and compliance. Future market potential lies in the expansion into emerging markets, the integration of advanced technologies, and the development of specialized solutions for various industry sectors. The market's growth will be significantly influenced by regulatory developments and the pace of technological innovation. The strategic focus for market players will be on developing robust data analytics capabilities, enhancing user experience, and fostering strategic partnerships to expand their market reach.
Smart Fleet Management Market Segmentation
-
1. Transporation Mode
- 1.1. Marine
- 1.2. Rolling Stock
- 1.3. Automotive
- 1.4. Other Modes
-
2. Solution
- 2.1. Tracking and Monitoring
- 2.2. Route Optimization
- 2.3. ADAS
- 2.4. Remote Diagnostics
- 2.5. Telematics
- 2.6. Other Solutions
-
3. Hardware
- 3.1. Onboard Diagnostics (OBD)
- 3.2. Cameras
- 3.3. Sensors
- 3.4. GPS Devices
Smart Fleet Management Market Segmentation By Geography
- 1. North America
- 2. Europe
- 3. Asia
- 4. Latin America
- 5. Middle East and Africa
Smart Fleet Management Market REPORT HIGHLIGHTS
| Aspects | Details |
|---|---|
| Study Period | 2019-2033 |
| Base Year | 2024 |
| Estimated Year | 2025 |
| Forecast Period | 2025-2033 |
| Historical Period | 2019-2024 |
| Growth Rate | CAGR of 9.50% from 2019-2033 |
| Segmentation |
|
Table of Contents
- 1. Introduction
- 1.1. Research Scope
- 1.2. Market Segmentation
- 1.3. Research Methodology
- 1.4. Definitions and Assumptions
- 2. Executive Summary
- 2.1. Introduction
- 3. Market Dynamics
- 3.1. Introduction
- 3.2. Market Drivers
- 3.2.1. Telematics and IoT Integration; Regulatory Compliance and Safety Standards
- 3.3. Market Restrains
- 3.3.1. Telematics and IoT Integration; Regulatory Compliance and Safety Standards
- 3.4. Market Trends
- 3.4.1. Tracking and Monitoring is Expected to Witness a Significant Growth
- 4. Market Factor Analysis
- 4.1. Porters Five Forces
- 4.2. Supply/Value Chain
- 4.3. PESTEL analysis
- 4.4. Market Entropy
- 4.5. Patent/Trademark Analysis
- 5. Global Smart Fleet Management Market Analysis, Insights and Forecast, 2019-2031
- 5.1. Market Analysis, Insights and Forecast - by Transporation Mode
- 5.1.1. Marine
- 5.1.2. Rolling Stock
- 5.1.3. Automotive
- 5.1.4. Other Modes
- 5.2. Market Analysis, Insights and Forecast - by Solution
- 5.2.1. Tracking and Monitoring
- 5.2.2. Route Optimization
- 5.2.3. ADAS
- 5.2.4. Remote Diagnostics
- 5.2.5. Telematics
- 5.2.6. Other Solutions
- 5.3. Market Analysis, Insights and Forecast - by Hardware
- 5.3.1. Onboard Diagnostics (OBD)
- 5.3.2. Cameras
- 5.3.3. Sensors
- 5.3.4. GPS Devices
- 5.4. Market Analysis, Insights and Forecast - by Region
- 5.4.1. North America
- 5.4.2. Europe
- 5.4.3. Asia
- 5.4.4. Latin America
- 5.4.5. Middle East and Africa
- 5.1. Market Analysis, Insights and Forecast - by Transporation Mode
- 6. North America Smart Fleet Management Market Analysis, Insights and Forecast, 2019-2031
- 6.1. Market Analysis, Insights and Forecast - by Transporation Mode
- 6.1.1. Marine
- 6.1.2. Rolling Stock
- 6.1.3. Automotive
- 6.1.4. Other Modes
- 6.2. Market Analysis, Insights and Forecast - by Solution
- 6.2.1. Tracking and Monitoring
- 6.2.2. Route Optimization
- 6.2.3. ADAS
- 6.2.4. Remote Diagnostics
- 6.2.5. Telematics
- 6.2.6. Other Solutions
- 6.3. Market Analysis, Insights and Forecast - by Hardware
- 6.3.1. Onboard Diagnostics (OBD)
- 6.3.2. Cameras
- 6.3.3. Sensors
- 6.3.4. GPS Devices
- 6.1. Market Analysis, Insights and Forecast - by Transporation Mode
- 7. Europe Smart Fleet Management Market Analysis, Insights and Forecast, 2019-2031
- 7.1. Market Analysis, Insights and Forecast - by Transporation Mode
- 7.1.1. Marine
- 7.1.2. Rolling Stock
- 7.1.3. Automotive
- 7.1.4. Other Modes
- 7.2. Market Analysis, Insights and Forecast - by Solution
- 7.2.1. Tracking and Monitoring
- 7.2.2. Route Optimization
- 7.2.3. ADAS
- 7.2.4. Remote Diagnostics
- 7.2.5. Telematics
- 7.2.6. Other Solutions
- 7.3. Market Analysis, Insights and Forecast - by Hardware
- 7.3.1. Onboard Diagnostics (OBD)
- 7.3.2. Cameras
- 7.3.3. Sensors
- 7.3.4. GPS Devices
- 7.1. Market Analysis, Insights and Forecast - by Transporation Mode
- 8. Asia Smart Fleet Management Market Analysis, Insights and Forecast, 2019-2031
- 8.1. Market Analysis, Insights and Forecast - by Transporation Mode
- 8.1.1. Marine
- 8.1.2. Rolling Stock
- 8.1.3. Automotive
- 8.1.4. Other Modes
- 8.2. Market Analysis, Insights and Forecast - by Solution
- 8.2.1. Tracking and Monitoring
- 8.2.2. Route Optimization
- 8.2.3. ADAS
- 8.2.4. Remote Diagnostics
- 8.2.5. Telematics
- 8.2.6. Other Solutions
- 8.3. Market Analysis, Insights and Forecast - by Hardware
- 8.3.1. Onboard Diagnostics (OBD)
- 8.3.2. Cameras
- 8.3.3. Sensors
- 8.3.4. GPS Devices
- 8.1. Market Analysis, Insights and Forecast - by Transporation Mode
- 9. Latin America Smart Fleet Management Market Analysis, Insights and Forecast, 2019-2031
- 9.1. Market Analysis, Insights and Forecast - by Transporation Mode
- 9.1.1. Marine
- 9.1.2. Rolling Stock
- 9.1.3. Automotive
- 9.1.4. Other Modes
- 9.2. Market Analysis, Insights and Forecast - by Solution
- 9.2.1. Tracking and Monitoring
- 9.2.2. Route Optimization
- 9.2.3. ADAS
- 9.2.4. Remote Diagnostics
- 9.2.5. Telematics
- 9.2.6. Other Solutions
- 9.3. Market Analysis, Insights and Forecast - by Hardware
- 9.3.1. Onboard Diagnostics (OBD)
- 9.3.2. Cameras
- 9.3.3. Sensors
- 9.3.4. GPS Devices
- 9.1. Market Analysis, Insights and Forecast - by Transporation Mode
- 10. Middle East and Africa Smart Fleet Management Market Analysis, Insights and Forecast, 2019-2031
- 10.1. Market Analysis, Insights and Forecast - by Transporation Mode
- 10.1.1. Marine
- 10.1.2. Rolling Stock
- 10.1.3. Automotive
- 10.1.4. Other Modes
- 10.2. Market Analysis, Insights and Forecast - by Solution
- 10.2.1. Tracking and Monitoring
- 10.2.2. Route Optimization
- 10.2.3. ADAS
- 10.2.4. Remote Diagnostics
- 10.2.5. Telematics
- 10.2.6. Other Solutions
- 10.3. Market Analysis, Insights and Forecast - by Hardware
- 10.3.1. Onboard Diagnostics (OBD)
- 10.3.2. Cameras
- 10.3.3. Sensors
- 10.3.4. GPS Devices
- 10.1. Market Analysis, Insights and Forecast - by Transporation Mode
- 11. Competitive Analysis
- 11.1. Global Market Share Analysis 2024
- 11.2. Company Profiles
- 11.2.1 Zonar Systems Inc
- 11.2.1.1. Overview
- 11.2.1.2. Products
- 11.2.1.3. SWOT Analysis
- 11.2.1.4. Recent Developments
- 11.2.1.5. Financials (Based on Availability)
- 11.2.2 Hitachi Limited
- 11.2.2.1. Overview
- 11.2.2.2. Products
- 11.2.2.3. SWOT Analysis
- 11.2.2.4. Recent Developments
- 11.2.2.5. Financials (Based on Availability)
- 11.2.3 Geotab Inc
- 11.2.3.1. Overview
- 11.2.3.2. Products
- 11.2.3.3. SWOT Analysis
- 11.2.3.4. Recent Developments
- 11.2.3.5. Financials (Based on Availability)
- 11.2.4 Sintrones Technology Corporation
- 11.2.4.1. Overview
- 11.2.4.2. Products
- 11.2.4.3. SWOT Analysis
- 11.2.4.4. Recent Developments
- 11.2.4.5. Financials (Based on Availability)
- 11.2.5 Verizon Inc
- 11.2.5.1. Overview
- 11.2.5.2. Products
- 11.2.5.3. SWOT Analysis
- 11.2.5.4. Recent Developments
- 11.2.5.5. Financials (Based on Availability)
- 11.2.6 Teletrac Navman US Limited
- 11.2.6.1. Overview
- 11.2.6.2. Products
- 11.2.6.3. SWOT Analysis
- 11.2.6.4. Recent Developments
- 11.2.6.5. Financials (Based on Availability)
- 11.2.7 Inseego Corporation
- 11.2.7.1. Overview
- 11.2.7.2. Products
- 11.2.7.3. SWOT Analysis
- 11.2.7.4. Recent Developments
- 11.2.7.5. Financials (Based on Availability)
- 11.2.8 Sierra Wireless Inc
- 11.2.8.1. Overview
- 11.2.8.2. Products
- 11.2.8.3. SWOT Analysis
- 11.2.8.4. Recent Developments
- 11.2.8.5. Financials (Based on Availability)
- 11.2.9 Samsara Inc
- 11.2.9.1. Overview
- 11.2.9.2. Products
- 11.2.9.3. SWOT Analysis
- 11.2.9.4. Recent Developments
- 11.2.9.5. Financials (Based on Availability)
- 11.2.10 Continental AG*List Not Exhaustive
- 11.2.10.1. Overview
- 11.2.10.2. Products
- 11.2.10.3. SWOT Analysis
- 11.2.10.4. Recent Developments
- 11.2.10.5. Financials (Based on Availability)
- 11.2.1 Zonar Systems Inc
List of Figures
- Figure 1: Global Smart Fleet Management Market Revenue Breakdown (Million, %) by Region 2024 & 2032
- Figure 2: Global Smart Fleet Management Market Volume Breakdown (Billion, %) by Region 2024 & 2032
- Figure 3: North America Smart Fleet Management Market Revenue (Million), by Transporation Mode 2024 & 2032
- Figure 4: North America Smart Fleet Management Market Volume (Billion), by Transporation Mode 2024 & 2032
- Figure 5: North America Smart Fleet Management Market Revenue Share (%), by Transporation Mode 2024 & 2032
- Figure 6: North America Smart Fleet Management Market Volume Share (%), by Transporation Mode 2024 & 2032
- Figure 7: North America Smart Fleet Management Market Revenue (Million), by Solution 2024 & 2032
- Figure 8: North America Smart Fleet Management Market Volume (Billion), by Solution 2024 & 2032
- Figure 9: North America Smart Fleet Management Market Revenue Share (%), by Solution 2024 & 2032
- Figure 10: North America Smart Fleet Management Market Volume Share (%), by Solution 2024 & 2032
- Figure 11: North America Smart Fleet Management Market Revenue (Million), by Hardware 2024 & 2032
- Figure 12: North America Smart Fleet Management Market Volume (Billion), by Hardware 2024 & 2032
- Figure 13: North America Smart Fleet Management Market Revenue Share (%), by Hardware 2024 & 2032
- Figure 14: North America Smart Fleet Management Market Volume Share (%), by Hardware 2024 & 2032
- Figure 15: North America Smart Fleet Management Market Revenue (Million), by Country 2024 & 2032
- Figure 16: North America Smart Fleet Management Market Volume (Billion), by Country 2024 & 2032
- Figure 17: North America Smart Fleet Management Market Revenue Share (%), by Country 2024 & 2032
- Figure 18: North America Smart Fleet Management Market Volume Share (%), by Country 2024 & 2032
- Figure 19: Europe Smart Fleet Management Market Revenue (Million), by Transporation Mode 2024 & 2032
- Figure 20: Europe Smart Fleet Management Market Volume (Billion), by Transporation Mode 2024 & 2032
- Figure 21: Europe Smart Fleet Management Market Revenue Share (%), by Transporation Mode 2024 & 2032
- Figure 22: Europe Smart Fleet Management Market Volume Share (%), by Transporation Mode 2024 & 2032
- Figure 23: Europe Smart Fleet Management Market Revenue (Million), by Solution 2024 & 2032
- Figure 24: Europe Smart Fleet Management Market Volume (Billion), by Solution 2024 & 2032
- Figure 25: Europe Smart Fleet Management Market Revenue Share (%), by Solution 2024 & 2032
- Figure 26: Europe Smart Fleet Management Market Volume Share (%), by Solution 2024 & 2032
- Figure 27: Europe Smart Fleet Management Market Revenue (Million), by Hardware 2024 & 2032
- Figure 28: Europe Smart Fleet Management Market Volume (Billion), by Hardware 2024 & 2032
- Figure 29: Europe Smart Fleet Management Market Revenue Share (%), by Hardware 2024 & 2032
- Figure 30: Europe Smart Fleet Management Market Volume Share (%), by Hardware 2024 & 2032
- Figure 31: Europe Smart Fleet Management Market Revenue (Million), by Country 2024 & 2032
- Figure 32: Europe Smart Fleet Management Market Volume (Billion), by Country 2024 & 2032
- Figure 33: Europe Smart Fleet Management Market Revenue Share (%), by Country 2024 & 2032
- Figure 34: Europe Smart Fleet Management Market Volume Share (%), by Country 2024 & 2032
- Figure 35: Asia Smart Fleet Management Market Revenue (Million), by Transporation Mode 2024 & 2032
- Figure 36: Asia Smart Fleet Management Market Volume (Billion), by Transporation Mode 2024 & 2032
- Figure 37: Asia Smart Fleet Management Market Revenue Share (%), by Transporation Mode 2024 & 2032
- Figure 38: Asia Smart Fleet Management Market Volume Share (%), by Transporation Mode 2024 & 2032
- Figure 39: Asia Smart Fleet Management Market Revenue (Million), by Solution 2024 & 2032
- Figure 40: Asia Smart Fleet Management Market Volume (Billion), by Solution 2024 & 2032
- Figure 41: Asia Smart Fleet Management Market Revenue Share (%), by Solution 2024 & 2032
- Figure 42: Asia Smart Fleet Management Market Volume Share (%), by Solution 2024 & 2032
- Figure 43: Asia Smart Fleet Management Market Revenue (Million), by Hardware 2024 & 2032
- Figure 44: Asia Smart Fleet Management Market Volume (Billion), by Hardware 2024 & 2032
- Figure 45: Asia Smart Fleet Management Market Revenue Share (%), by Hardware 2024 & 2032
- Figure 46: Asia Smart Fleet Management Market Volume Share (%), by Hardware 2024 & 2032
- Figure 47: Asia Smart Fleet Management Market Revenue (Million), by Country 2024 & 2032
- Figure 48: Asia Smart Fleet Management Market Volume (Billion), by Country 2024 & 2032
- Figure 49: Asia Smart Fleet Management Market Revenue Share (%), by Country 2024 & 2032
- Figure 50: Asia Smart Fleet Management Market Volume Share (%), by Country 2024 & 2032
- Figure 51: Latin America Smart Fleet Management Market Revenue (Million), by Transporation Mode 2024 & 2032
- Figure 52: Latin America Smart Fleet Management Market Volume (Billion), by Transporation Mode 2024 & 2032
- Figure 53: Latin America Smart Fleet Management Market Revenue Share (%), by Transporation Mode 2024 & 2032
- Figure 54: Latin America Smart Fleet Management Market Volume Share (%), by Transporation Mode 2024 & 2032
- Figure 55: Latin America Smart Fleet Management Market Revenue (Million), by Solution 2024 & 2032
- Figure 56: Latin America Smart Fleet Management Market Volume (Billion), by Solution 2024 & 2032
- Figure 57: Latin America Smart Fleet Management Market Revenue Share (%), by Solution 2024 & 2032
- Figure 58: Latin America Smart Fleet Management Market Volume Share (%), by Solution 2024 & 2032
- Figure 59: Latin America Smart Fleet Management Market Revenue (Million), by Hardware 2024 & 2032
- Figure 60: Latin America Smart Fleet Management Market Volume (Billion), by Hardware 2024 & 2032
- Figure 61: Latin America Smart Fleet Management Market Revenue Share (%), by Hardware 2024 & 2032
- Figure 62: Latin America Smart Fleet Management Market Volume Share (%), by Hardware 2024 & 2032
- Figure 63: Latin America Smart Fleet Management Market Revenue (Million), by Country 2024 & 2032
- Figure 64: Latin America Smart Fleet Management Market Volume (Billion), by Country 2024 & 2032
- Figure 65: Latin America Smart Fleet Management Market Revenue Share (%), by Country 2024 & 2032
- Figure 66: Latin America Smart Fleet Management Market Volume Share (%), by Country 2024 & 2032
- Figure 67: Middle East and Africa Smart Fleet Management Market Revenue (Million), by Transporation Mode 2024 & 2032
- Figure 68: Middle East and Africa Smart Fleet Management Market Volume (Billion), by Transporation Mode 2024 & 2032
- Figure 69: Middle East and Africa Smart Fleet Management Market Revenue Share (%), by Transporation Mode 2024 & 2032
- Figure 70: Middle East and Africa Smart Fleet Management Market Volume Share (%), by Transporation Mode 2024 & 2032
- Figure 71: Middle East and Africa Smart Fleet Management Market Revenue (Million), by Solution 2024 & 2032
- Figure 72: Middle East and Africa Smart Fleet Management Market Volume (Billion), by Solution 2024 & 2032
- Figure 73: Middle East and Africa Smart Fleet Management Market Revenue Share (%), by Solution 2024 & 2032
- Figure 74: Middle East and Africa Smart Fleet Management Market Volume Share (%), by Solution 2024 & 2032
- Figure 75: Middle East and Africa Smart Fleet Management Market Revenue (Million), by Hardware 2024 & 2032
- Figure 76: Middle East and Africa Smart Fleet Management Market Volume (Billion), by Hardware 2024 & 2032
- Figure 77: Middle East and Africa Smart Fleet Management Market Revenue Share (%), by Hardware 2024 & 2032
- Figure 78: Middle East and Africa Smart Fleet Management Market Volume Share (%), by Hardware 2024 & 2032
- Figure 79: Middle East and Africa Smart Fleet Management Market Revenue (Million), by Country 2024 & 2032
- Figure 80: Middle East and Africa Smart Fleet Management Market Volume (Billion), by Country 2024 & 2032
- Figure 81: Middle East and Africa Smart Fleet Management Market Revenue Share (%), by Country 2024 & 2032
- Figure 82: Middle East and Africa Smart Fleet Management Market Volume Share (%), by Country 2024 & 2032
List of Tables
- Table 1: Global Smart Fleet Management Market Revenue Million Forecast, by Region 2019 & 2032
- Table 2: Global Smart Fleet Management Market Volume Billion Forecast, by Region 2019 & 2032
- Table 3: Global Smart Fleet Management Market Revenue Million Forecast, by Transporation Mode 2019 & 2032
- Table 4: Global Smart Fleet Management Market Volume Billion Forecast, by Transporation Mode 2019 & 2032
- Table 5: Global Smart Fleet Management Market Revenue Million Forecast, by Solution 2019 & 2032
- Table 6: Global Smart Fleet Management Market Volume Billion Forecast, by Solution 2019 & 2032
- Table 7: Global Smart Fleet Management Market Revenue Million Forecast, by Hardware 2019 & 2032
- Table 8: Global Smart Fleet Management Market Volume Billion Forecast, by Hardware 2019 & 2032
- Table 9: Global Smart Fleet Management Market Revenue Million Forecast, by Region 2019 & 2032
- Table 10: Global Smart Fleet Management Market Volume Billion Forecast, by Region 2019 & 2032
- Table 11: Global Smart Fleet Management Market Revenue Million Forecast, by Transporation Mode 2019 & 2032
- Table 12: Global Smart Fleet Management Market Volume Billion Forecast, by Transporation Mode 2019 & 2032
- Table 13: Global Smart Fleet Management Market Revenue Million Forecast, by Solution 2019 & 2032
- Table 14: Global Smart Fleet Management Market Volume Billion Forecast, by Solution 2019 & 2032
- Table 15: Global Smart Fleet Management Market Revenue Million Forecast, by Hardware 2019 & 2032
- Table 16: Global Smart Fleet Management Market Volume Billion Forecast, by Hardware 2019 & 2032
- Table 17: Global Smart Fleet Management Market Revenue Million Forecast, by Country 2019 & 2032
- Table 18: Global Smart Fleet Management Market Volume Billion Forecast, by Country 2019 & 2032
- Table 19: Global Smart Fleet Management Market Revenue Million Forecast, by Transporation Mode 2019 & 2032
- Table 20: Global Smart Fleet Management Market Volume Billion Forecast, by Transporation Mode 2019 & 2032
- Table 21: Global Smart Fleet Management Market Revenue Million Forecast, by Solution 2019 & 2032
- Table 22: Global Smart Fleet Management Market Volume Billion Forecast, by Solution 2019 & 2032
- Table 23: Global Smart Fleet Management Market Revenue Million Forecast, by Hardware 2019 & 2032
- Table 24: Global Smart Fleet Management Market Volume Billion Forecast, by Hardware 2019 & 2032
- Table 25: Global Smart Fleet Management Market Revenue Million Forecast, by Country 2019 & 2032
- Table 26: Global Smart Fleet Management Market Volume Billion Forecast, by Country 2019 & 2032
- Table 27: Global Smart Fleet Management Market Revenue Million Forecast, by Transporation Mode 2019 & 2032
- Table 28: Global Smart Fleet Management Market Volume Billion Forecast, by Transporation Mode 2019 & 2032
- Table 29: Global Smart Fleet Management Market Revenue Million Forecast, by Solution 2019 & 2032
- Table 30: Global Smart Fleet Management Market Volume Billion Forecast, by Solution 2019 & 2032
- Table 31: Global Smart Fleet Management Market Revenue Million Forecast, by Hardware 2019 & 2032
- Table 32: Global Smart Fleet Management Market Volume Billion Forecast, by Hardware 2019 & 2032
- Table 33: Global Smart Fleet Management Market Revenue Million Forecast, by Country 2019 & 2032
- Table 34: Global Smart Fleet Management Market Volume Billion Forecast, by Country 2019 & 2032
- Table 35: Global Smart Fleet Management Market Revenue Million Forecast, by Transporation Mode 2019 & 2032
- Table 36: Global Smart Fleet Management Market Volume Billion Forecast, by Transporation Mode 2019 & 2032
- Table 37: Global Smart Fleet Management Market Revenue Million Forecast, by Solution 2019 & 2032
- Table 38: Global Smart Fleet Management Market Volume Billion Forecast, by Solution 2019 & 2032
- Table 39: Global Smart Fleet Management Market Revenue Million Forecast, by Hardware 2019 & 2032
- Table 40: Global Smart Fleet Management Market Volume Billion Forecast, by Hardware 2019 & 2032
- Table 41: Global Smart Fleet Management Market Revenue Million Forecast, by Country 2019 & 2032
- Table 42: Global Smart Fleet Management Market Volume Billion Forecast, by Country 2019 & 2032
- Table 43: Global Smart Fleet Management Market Revenue Million Forecast, by Transporation Mode 2019 & 2032
- Table 44: Global Smart Fleet Management Market Volume Billion Forecast, by Transporation Mode 2019 & 2032
- Table 45: Global Smart Fleet Management Market Revenue Million Forecast, by Solution 2019 & 2032
- Table 46: Global Smart Fleet Management Market Volume Billion Forecast, by Solution 2019 & 2032
- Table 47: Global Smart Fleet Management Market Revenue Million Forecast, by Hardware 2019 & 2032
- Table 48: Global Smart Fleet Management Market Volume Billion Forecast, by Hardware 2019 & 2032
- Table 49: Global Smart Fleet Management Market Revenue Million Forecast, by Country 2019 & 2032
- Table 50: Global Smart Fleet Management Market Volume Billion Forecast, by Country 2019 & 2032
Frequently Asked Questions
1. What is the projected Compound Annual Growth Rate (CAGR) of the Smart Fleet Management Market?
The projected CAGR is approximately 9.50%.
2. Which companies are prominent players in the Smart Fleet Management Market?
Key companies in the market include Zonar Systems Inc, Hitachi Limited, Geotab Inc, Sintrones Technology Corporation, Verizon Inc, Teletrac Navman US Limited, Inseego Corporation, Sierra Wireless Inc, Samsara Inc, Continental AG*List Not Exhaustive.
3. What are the main segments of the Smart Fleet Management Market?
The market segments include Transporation Mode, Solution, Hardware.
4. Can you provide details about the market size?
The market size is estimated to be USD 468.22 Million as of 2022.
5. What are some drivers contributing to market growth?
Telematics and IoT Integration; Regulatory Compliance and Safety Standards.
6. What are the notable trends driving market growth?
Tracking and Monitoring is Expected to Witness a Significant Growth.
7. Are there any restraints impacting market growth?
Telematics and IoT Integration; Regulatory Compliance and Safety Standards.
8. Can you provide examples of recent developments in the market?
June 2024: Spinergie, a specialist in maritime data integration and analytics, revealed that AsianBulk Logistics (ABL), known for its integrated logistics services and infrastructure solutions for bulk commodities, opted for smart fleet management. This choice aims to refine ABL's global transshipment operations. The centralized digital solution promises to simplify onboard reporting for bulk cargo transfers, bolster activity tracking throughout ABL's fleet, and facilitate efficient oversight of remote offshore project zones. Through the Spinergie solution, ABL now leverages automated outgoing reports derived from digital Daily Reports (DRs) filled out by captains.April 2024: Seaward Services, a subsidiary of Hornblower Group, is implementing Spinergie Inc.'s smart fleet management solution across its fleet. This fleet includes Jones Act-compliant offshore service vessels, multipurpose service vessels (MPSVs), and crew transfer vessels (CTVs) actively engaged in offshore wind operations along the US East Coast. Spinergie's customizable smart fleet management solution consolidates various systems into a unified analytics platform, enabling shoreside operations personnel to manage the fleet remotely.
9. What pricing options are available for accessing the report?
Pricing options include single-user, multi-user, and enterprise licenses priced at USD 4750, USD 5250, and USD 8750 respectively.
10. Is the market size provided in terms of value or volume?
The market size is provided in terms of value, measured in Million and volume, measured in Billion.
11. Are there any specific market keywords associated with the report?
Yes, the market keyword associated with the report is "Smart Fleet Management Market," which aids in identifying and referencing the specific market segment covered.
12. How do I determine which pricing option suits my needs best?
The pricing options vary based on user requirements and access needs. Individual users may opt for single-user licenses, while businesses requiring broader access may choose multi-user or enterprise licenses for cost-effective access to the report.
13. Are there any additional resources or data provided in the Smart Fleet Management Market report?
While the report offers comprehensive insights, it's advisable to review the specific contents or supplementary materials provided to ascertain if additional resources or data are available.
14. How can I stay updated on further developments or reports in the Smart Fleet Management Market?
To stay informed about further developments, trends, and reports in the Smart Fleet Management Market, consider subscribing to industry newsletters, following relevant companies and organizations, or regularly checking reputable industry news sources and publications.
Methodology
Step 1 - Identification of Relevant Samples Size from Population Database


Step 2 - Approaches for Defining Global Market Size (Value, Volume* & Price*)

Note*: In applicable scenarios
Step 3 - Data Sources
Primary Research
- Web Analytics
- Survey Reports
- Research Institute
- Latest Research Reports
- Opinion Leaders
Secondary Research
- Annual Reports
- White Paper
- Latest Press Release
- Industry Association
- Paid Database
- Investor Presentations

Step 4 - Data Triangulation
Involves using different sources of information in order to increase the validity of a study
These sources are likely to be stakeholders in a program - participants, other researchers, program staff, other community members, and so on.
Then we put all data in single framework & apply various statistical tools to find out the dynamic on the market.
During the analysis stage, feedback from the stakeholder groups would be compared to determine areas of agreement as well as areas of divergence


