
Key Insights
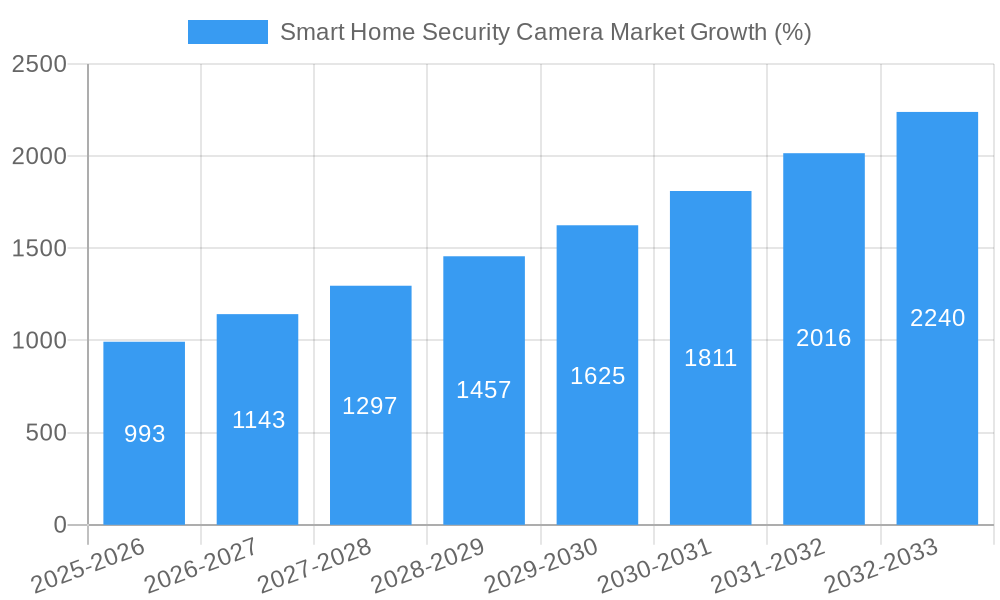
The global smart home security camera market, valued at $7.80 billion in 2025, is experiencing robust growth, projected to expand at a Compound Annual Growth Rate (CAGR) of 12.78% from 2025 to 2033. This surge is fueled by several key drivers. Increased consumer awareness of home security threats, coupled with the rising affordability and accessibility of smart home devices, are significantly boosting market adoption. The integration of advanced features such as AI-powered object detection, facial recognition, and cloud storage capabilities further enhances the value proposition for consumers, driving demand. Moreover, the seamless integration with other smart home ecosystems, creating centralized control and automation, is a significant factor contributing to market expansion. The market is witnessing a shift towards subscription-based services, offering features like professional monitoring and enhanced cloud storage, contributing to higher average revenue per user (ARPU). Competitive landscape is dynamic with key players like Hangzhou Hikvision, Honeywell, SimpliSafe, ADT, and Arlo continuously innovating and expanding their product portfolios to cater to the evolving consumer needs.
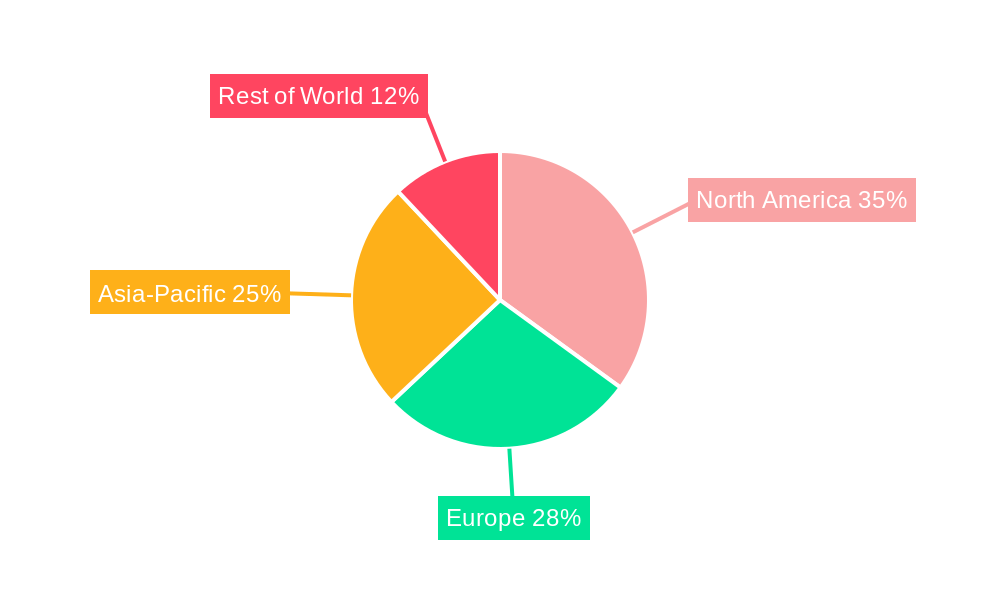
Despite the promising growth trajectory, the market faces certain challenges. Concerns regarding data privacy and security remain a significant restraint, as consumers become increasingly aware of potential vulnerabilities. High initial investment costs for comprehensive smart home security systems can also limit accessibility for some segments of the population. Furthermore, the market is susceptible to technological advancements, requiring continuous product updates and innovation to maintain competitiveness. Nevertheless, the overall market outlook remains positive, driven by strong consumer demand for enhanced home security solutions and technological advancements which address current limitations. The continued integration of smart home security cameras with broader IoT ecosystems will further fuel market growth in the coming years. Regional growth will be uneven, with North America and Europe expected to maintain a significant market share due to high adoption rates and strong consumer awareness. Asia-Pacific is likely to show significant growth potential due to increasing disposable incomes and rising urbanization.

Smart Home Security Camera Market: A Comprehensive Report (2019-2033)
This detailed report provides a comprehensive analysis of the global Smart Home Security Camera Market, offering invaluable insights for industry stakeholders, investors, and strategic decision-makers. Covering the period from 2019 to 2033, with a focus on 2025, this report dissects market trends, competitive dynamics, and future growth potential. The study period is 2019-2033, with 2025 as the base and estimated year, and 2025-2033 as the forecast period. The historical period covers 2019-2024. The report utilizes detailed market sizing and forecasting data, along with qualitative analysis, to present a holistic view of this rapidly evolving market.
Smart Home Security Camera Market Market Concentration & Innovation
The smart home security camera market exhibits a moderately concentrated landscape, with key players like Hangzhou Hikvision Digital Technology Co Ltd, Honeywell International Inc, and ADT Corporation holding significant market share. However, the market is also characterized by a high degree of innovation, fueled by continuous advancements in areas such as AI-powered analytics, cloud storage solutions, and improved video quality. Regulatory frameworks, particularly around data privacy and cybersecurity, are increasingly influencing market dynamics. The emergence of smart home ecosystems and the increasing integration of security cameras with other smart home devices represent significant growth drivers. Product substitution is evident with the rise of alternative solutions like professional monitoring services. M&A activity is relatively frequent, with deal values ranging from xx Million to xx Million in recent years, reflecting consolidation and expansion strategies among market players. End-user trends show a growing preference for wireless, easily-installable, and cost-effective solutions with advanced features such as two-way audio and smart home integration.
- Market Concentration: High (Top 5 players hold xx% market share)
- Innovation Drivers: AI, cloud storage, improved video quality, smart home integration
- Regulatory Frameworks: Data privacy, cybersecurity
- M&A Activity: xx deals over the past 5 years with an aggregate value of xx Million.
Smart Home Security Camera Market Industry Trends & Insights
The global smart home security camera market is experiencing robust growth, driven by factors such as rising consumer awareness regarding home security, increasing adoption of smart home technologies, and the affordability of these devices. The market is witnessing a significant shift towards advanced features like AI-powered object recognition, improved night vision capabilities, and enhanced cloud storage options. Technological disruptions, specifically in areas of AI and machine learning, are driving the development of more sophisticated security features and user-friendly interfaces. Consumer preferences are leaning towards wireless and battery-powered cameras for ease of installation and flexibility. Competitive dynamics are intensifying with the entry of new players and the ongoing innovation efforts of established brands. The market is expected to exhibit a CAGR of xx% during the forecast period (2025-2033), reaching a market size of xx Million by 2033. Market penetration is increasing, particularly in developed economies.
Dominant Markets & Segments in Smart Home Security Camera Market
North America currently dominates the smart home security camera market, driven by high disposable incomes, advanced technological infrastructure, and increased awareness of home security threats. Factors contributing to this dominance include:
- Strong consumer demand: Driven by rising crime rates and security concerns.
- Technological advancements: fostering innovation and product diversity.
- Established smart home ecosystem: facilitating seamless integration.
- Robust retail channels: providing easy access to products.
In contrast, the Asia-Pacific region is experiencing rapid growth, exhibiting high growth potential driven by:
- Rising disposable incomes: enabling greater spending on consumer electronics.
- Increasing urbanization: leading to higher security needs in densely populated areas.
- Government initiatives: promoting smart city development and adoption of smart home technologies.
Other regions, like Europe, are also witnessing healthy growth, albeit at a slower pace, shaped by local regulatory frameworks and consumer preferences.
Smart Home Security Camera Market Product Developments
Recent product innovations focus on enhancing features like AI-powered facial recognition, improved night vision, and seamless integration with other smart home devices. Cameras are becoming smaller, more stylish, and easier to install. The competitive advantage lies in offering a combination of high-quality video, advanced features, and user-friendly interfaces at a competitive price point. Technological trends indicate a movement towards increased use of edge computing for faster processing and enhanced privacy features. The market fit for these innovations is strong, as consumers increasingly demand advanced features and seamless connectivity within their smart homes.
Report Scope & Segmentation Analysis
This report segments the smart home security camera market based on several key parameters:
By Product Type: This includes indoor cameras, outdoor cameras, and specialized cameras (e.g., doorbell cameras, baby monitors). Each segment exhibits varying growth projections and competitive dynamics, reflecting different technological advancements and consumer preferences.
By Technology: This includes wired and wireless cameras, along with variations in video resolution and data storage solutions. This segmentation highlights technology-driven trends and their impact on the market.
By Application: This focuses on residential and commercial applications of smart home security cameras, with separate analysis based on unique security and monitoring needs within each segment.
By Region: This includes North America, Europe, Asia-Pacific, Middle East & Africa, and South America, with market size projections and growth analyses unique to each region.
Key Drivers of Smart Home Security Camera Market Growth
Several factors drive the growth of the smart home security camera market:
- Rising security concerns: increasing crime rates and public safety concerns are key drivers.
- Technological advancements: AI, improved image quality, and smart home integration.
- Affordability: decreasing costs are making smart home security solutions accessible to a wider audience.
- Ease of installation and use: user-friendly interfaces and wireless connectivity.
Challenges in the Smart Home Security Camera Market Sector
The smart home security camera market faces several challenges:
- Data privacy and security concerns: increasing regulations and user sensitivity regarding data protection are significant hurdles.
- Cybersecurity risks: vulnerabilities in connected devices can lead to significant security breaches.
- Supply chain disruptions: impacting production and availability of components.
- Competitive pressures: intense rivalry amongst established and emerging players.
Emerging Opportunities in Smart Home Security Camera Market
Emerging opportunities include:
- Integration with other smart home devices: creating holistic security ecosystems.
- Expansion into developing markets: untapped market potential in emerging economies.
- Development of new technologies: including advanced analytics and proactive security features.
- Enhanced cybersecurity solutions: addressing user anxieties regarding data security.
Leading Players in the Smart Home Security Camera Market Market
- Hangzhou Hikvision Digital Technology Co Ltd
- FrontPoint Security Solutions Inc
- Honeywell International Inc
- SimpliSafe Inc
- ADT Corporation
- Vivint Inc
- Netgear Inc
- Abode Systems Inc
- Panasonic Corporation
- Brinks Home Security
- Samsung Electronics Co Ltd
- Arlo Inc
- Wyze Labs Inc
- Philips Inc
- Logitech Inc
- Amcrest Industries LLC
- Lorex Corporation
- Somfy Inc
Key Developments in Smart Home Security Camera Market Industry
May 2024: Yale (ASSA ABLOY) launched its Yale Smart Indoor Camera and Yale Smart Outdoor Camera, featuring 1080p Full HD resolution, a 154° field of view, and superior color night vision. This expands the company's smart home security product portfolio.
January 2024: Xiaomi introduced the 360 Home Security Camera 2K, offering 2K HD video, a 3-megapixel camera, 360-degree panoramic view, and AI human detection. This enhances Xiaomi's presence in the smart home security market.
Strategic Outlook for Smart Home Security Camera Market Market
The future of the smart home security camera market is promising. Continued technological advancements, increasing consumer adoption of smart home technologies, and rising security concerns will drive substantial market growth. Opportunities lie in developing innovative products with enhanced features, improving data security, and expanding into new markets. Strategic partnerships and collaborations will play a crucial role in driving market consolidation and innovation. The focus on integrating security cameras within broader smart home ecosystems will be a key differentiator for market success.
Smart Home Security Camera Market Segmentation
-
1. Type
- 1.1. Analog Camera
-
1.2. IP Camera
- 1.2.1. PTZ Camera
-
2. Resolution
- 2.1. HD
- 2.2. Full HD
-
3. Location
- 3.1. Indoor
- 3.2. Outdoor
-
4. Shape
- 4.1. Bullet
- 4.2. Dome
- 4.3. Pan
- 4.4. Other Shapes
Smart Home Security Camera Market Segmentation By Geography
- 1. North America
- 2. Europe
- 3. Asia Pacific
- 4. Latin America
- 5. Middle East and Africa
Smart Home Security Camera Market REPORT HIGHLIGHTS
| Aspects | Details |
|---|---|
| Study Period | 2019-2033 |
| Base Year | 2024 |
| Estimated Year | 2025 |
| Forecast Period | 2025-2033 |
| Historical Period | 2019-2024 |
| Growth Rate | CAGR of 12.78% from 2019-2033 |
| Segmentation |
|
Table of Contents
- 1. Introduction
- 1.1. Research Scope
- 1.2. Market Segmentation
- 1.3. Research Methodology
- 1.4. Definitions and Assumptions
- 2. Executive Summary
- 2.1. Introduction
- 3. Market Dynamics
- 3.1. Introduction
- 3.2. Market Drivers
- 3.2.1 Increase in Concern Regarding Home Safety and Security; Growing Concerns About Safety
- 3.2.2 Evidenced by a Rise in Thefts and Crimes Related to Property.
- 3.3. Market Restrains
- 3.3.1 Increase in Concern Regarding Home Safety and Security; Growing Concerns About Safety
- 3.3.2 Evidenced by a Rise in Thefts and Crimes Related to Property.
- 3.4. Market Trends
- 3.4.1. Indoor Cameras is Expected to Witness a Significant Growth
- 4. Market Factor Analysis
- 4.1. Porters Five Forces
- 4.2. Supply/Value Chain
- 4.3. PESTEL analysis
- 4.4. Market Entropy
- 4.5. Patent/Trademark Analysis
- 5. Global Smart Home Security Camera Market Analysis, Insights and Forecast, 2019-2031
- 5.1. Market Analysis, Insights and Forecast - by Type
- 5.1.1. Analog Camera
- 5.1.2. IP Camera
- 5.1.2.1. PTZ Camera
- 5.2. Market Analysis, Insights and Forecast - by Resolution
- 5.2.1. HD
- 5.2.2. Full HD
- 5.3. Market Analysis, Insights and Forecast - by Location
- 5.3.1. Indoor
- 5.3.2. Outdoor
- 5.4. Market Analysis, Insights and Forecast - by Shape
- 5.4.1. Bullet
- 5.4.2. Dome
- 5.4.3. Pan
- 5.4.4. Other Shapes
- 5.5. Market Analysis, Insights and Forecast - by Region
- 5.5.1. North America
- 5.5.2. Europe
- 5.5.3. Asia Pacific
- 5.5.4. Latin America
- 5.5.5. Middle East and Africa
- 5.1. Market Analysis, Insights and Forecast - by Type
- 6. North America Smart Home Security Camera Market Analysis, Insights and Forecast, 2019-2031
- 6.1. Market Analysis, Insights and Forecast - by Type
- 6.1.1. Analog Camera
- 6.1.2. IP Camera
- 6.1.2.1. PTZ Camera
- 6.2. Market Analysis, Insights and Forecast - by Resolution
- 6.2.1. HD
- 6.2.2. Full HD
- 6.3. Market Analysis, Insights and Forecast - by Location
- 6.3.1. Indoor
- 6.3.2. Outdoor
- 6.4. Market Analysis, Insights and Forecast - by Shape
- 6.4.1. Bullet
- 6.4.2. Dome
- 6.4.3. Pan
- 6.4.4. Other Shapes
- 6.1. Market Analysis, Insights and Forecast - by Type
- 7. Europe Smart Home Security Camera Market Analysis, Insights and Forecast, 2019-2031
- 7.1. Market Analysis, Insights and Forecast - by Type
- 7.1.1. Analog Camera
- 7.1.2. IP Camera
- 7.1.2.1. PTZ Camera
- 7.2. Market Analysis, Insights and Forecast - by Resolution
- 7.2.1. HD
- 7.2.2. Full HD
- 7.3. Market Analysis, Insights and Forecast - by Location
- 7.3.1. Indoor
- 7.3.2. Outdoor
- 7.4. Market Analysis, Insights and Forecast - by Shape
- 7.4.1. Bullet
- 7.4.2. Dome
- 7.4.3. Pan
- 7.4.4. Other Shapes
- 7.1. Market Analysis, Insights and Forecast - by Type
- 8. Asia Pacific Smart Home Security Camera Market Analysis, Insights and Forecast, 2019-2031
- 8.1. Market Analysis, Insights and Forecast - by Type
- 8.1.1. Analog Camera
- 8.1.2. IP Camera
- 8.1.2.1. PTZ Camera
- 8.2. Market Analysis, Insights and Forecast - by Resolution
- 8.2.1. HD
- 8.2.2. Full HD
- 8.3. Market Analysis, Insights and Forecast - by Location
- 8.3.1. Indoor
- 8.3.2. Outdoor
- 8.4. Market Analysis, Insights and Forecast - by Shape
- 8.4.1. Bullet
- 8.4.2. Dome
- 8.4.3. Pan
- 8.4.4. Other Shapes
- 8.1. Market Analysis, Insights and Forecast - by Type
- 9. Latin America Smart Home Security Camera Market Analysis, Insights and Forecast, 2019-2031
- 9.1. Market Analysis, Insights and Forecast - by Type
- 9.1.1. Analog Camera
- 9.1.2. IP Camera
- 9.1.2.1. PTZ Camera
- 9.2. Market Analysis, Insights and Forecast - by Resolution
- 9.2.1. HD
- 9.2.2. Full HD
- 9.3. Market Analysis, Insights and Forecast - by Location
- 9.3.1. Indoor
- 9.3.2. Outdoor
- 9.4. Market Analysis, Insights and Forecast - by Shape
- 9.4.1. Bullet
- 9.4.2. Dome
- 9.4.3. Pan
- 9.4.4. Other Shapes
- 9.1. Market Analysis, Insights and Forecast - by Type
- 10. Middle East and Africa Smart Home Security Camera Market Analysis, Insights and Forecast, 2019-2031
- 10.1. Market Analysis, Insights and Forecast - by Type
- 10.1.1. Analog Camera
- 10.1.2. IP Camera
- 10.1.2.1. PTZ Camera
- 10.2. Market Analysis, Insights and Forecast - by Resolution
- 10.2.1. HD
- 10.2.2. Full HD
- 10.3. Market Analysis, Insights and Forecast - by Location
- 10.3.1. Indoor
- 10.3.2. Outdoor
- 10.4. Market Analysis, Insights and Forecast - by Shape
- 10.4.1. Bullet
- 10.4.2. Dome
- 10.4.3. Pan
- 10.4.4. Other Shapes
- 10.1. Market Analysis, Insights and Forecast - by Type
- 11. Competitive Analysis
- 11.1. Global Market Share Analysis 2024
- 11.2. Company Profiles
- 11.2.1 Hangzhou Hikvision Digital Technology Co Ltd
- 11.2.1.1. Overview
- 11.2.1.2. Products
- 11.2.1.3. SWOT Analysis
- 11.2.1.4. Recent Developments
- 11.2.1.5. Financials (Based on Availability)
- 11.2.2 FrontPoint Security Solutions Inc
- 11.2.2.1. Overview
- 11.2.2.2. Products
- 11.2.2.3. SWOT Analysis
- 11.2.2.4. Recent Developments
- 11.2.2.5. Financials (Based on Availability)
- 11.2.3 Honeywell International Inc
- 11.2.3.1. Overview
- 11.2.3.2. Products
- 11.2.3.3. SWOT Analysis
- 11.2.3.4. Recent Developments
- 11.2.3.5. Financials (Based on Availability)
- 11.2.4 SimpliSafe Inc
- 11.2.4.1. Overview
- 11.2.4.2. Products
- 11.2.4.3. SWOT Analysis
- 11.2.4.4. Recent Developments
- 11.2.4.5. Financials (Based on Availability)
- 11.2.5 ADT Corporation
- 11.2.5.1. Overview
- 11.2.5.2. Products
- 11.2.5.3. SWOT Analysis
- 11.2.5.4. Recent Developments
- 11.2.5.5. Financials (Based on Availability)
- 11.2.6 Vivint Inc
- 11.2.6.1. Overview
- 11.2.6.2. Products
- 11.2.6.3. SWOT Analysis
- 11.2.6.4. Recent Developments
- 11.2.6.5. Financials (Based on Availability)
- 11.2.7 Netgear Inc
- 11.2.7.1. Overview
- 11.2.7.2. Products
- 11.2.7.3. SWOT Analysis
- 11.2.7.4. Recent Developments
- 11.2.7.5. Financials (Based on Availability)
- 11.2.8 Abode Systems Inc
- 11.2.8.1. Overview
- 11.2.8.2. Products
- 11.2.8.3. SWOT Analysis
- 11.2.8.4. Recent Developments
- 11.2.8.5. Financials (Based on Availability)
- 11.2.9 Panasonic Corporation
- 11.2.9.1. Overview
- 11.2.9.2. Products
- 11.2.9.3. SWOT Analysis
- 11.2.9.4. Recent Developments
- 11.2.9.5. Financials (Based on Availability)
- 11.2.10 Brinks Home Security
- 11.2.10.1. Overview
- 11.2.10.2. Products
- 11.2.10.3. SWOT Analysis
- 11.2.10.4. Recent Developments
- 11.2.10.5. Financials (Based on Availability)
- 11.2.11 Samsung Electronics Co Ltd
- 11.2.11.1. Overview
- 11.2.11.2. Products
- 11.2.11.3. SWOT Analysis
- 11.2.11.4. Recent Developments
- 11.2.11.5. Financials (Based on Availability)
- 11.2.12 Arlo Inc
- 11.2.12.1. Overview
- 11.2.12.2. Products
- 11.2.12.3. SWOT Analysis
- 11.2.12.4. Recent Developments
- 11.2.12.5. Financials (Based on Availability)
- 11.2.13 Wyze Labs Inc
- 11.2.13.1. Overview
- 11.2.13.2. Products
- 11.2.13.3. SWOT Analysis
- 11.2.13.4. Recent Developments
- 11.2.13.5. Financials (Based on Availability)
- 11.2.14 Philips Inc
- 11.2.14.1. Overview
- 11.2.14.2. Products
- 11.2.14.3. SWOT Analysis
- 11.2.14.4. Recent Developments
- 11.2.14.5. Financials (Based on Availability)
- 11.2.15 Logitech Inc
- 11.2.15.1. Overview
- 11.2.15.2. Products
- 11.2.15.3. SWOT Analysis
- 11.2.15.4. Recent Developments
- 11.2.15.5. Financials (Based on Availability)
- 11.2.16 Amcrest Industries LLC
- 11.2.16.1. Overview
- 11.2.16.2. Products
- 11.2.16.3. SWOT Analysis
- 11.2.16.4. Recent Developments
- 11.2.16.5. Financials (Based on Availability)
- 11.2.17 Lorex Corporation
- 11.2.17.1. Overview
- 11.2.17.2. Products
- 11.2.17.3. SWOT Analysis
- 11.2.17.4. Recent Developments
- 11.2.17.5. Financials (Based on Availability)
- 11.2.18 Somfy Inc
- 11.2.18.1. Overview
- 11.2.18.2. Products
- 11.2.18.3. SWOT Analysis
- 11.2.18.4. Recent Developments
- 11.2.18.5. Financials (Based on Availability)
- 11.2.1 Hangzhou Hikvision Digital Technology Co Ltd
List of Figures
- Figure 1: Global Smart Home Security Camera Market Revenue Breakdown (Million, %) by Region 2024 & 2032
- Figure 2: Global Smart Home Security Camera Market Volume Breakdown (Billion, %) by Region 2024 & 2032
- Figure 3: North America Smart Home Security Camera Market Revenue (Million), by Type 2024 & 2032
- Figure 4: North America Smart Home Security Camera Market Volume (Billion), by Type 2024 & 2032
- Figure 5: North America Smart Home Security Camera Market Revenue Share (%), by Type 2024 & 2032
- Figure 6: North America Smart Home Security Camera Market Volume Share (%), by Type 2024 & 2032
- Figure 7: North America Smart Home Security Camera Market Revenue (Million), by Resolution 2024 & 2032
- Figure 8: North America Smart Home Security Camera Market Volume (Billion), by Resolution 2024 & 2032
- Figure 9: North America Smart Home Security Camera Market Revenue Share (%), by Resolution 2024 & 2032
- Figure 10: North America Smart Home Security Camera Market Volume Share (%), by Resolution 2024 & 2032
- Figure 11: North America Smart Home Security Camera Market Revenue (Million), by Location 2024 & 2032
- Figure 12: North America Smart Home Security Camera Market Volume (Billion), by Location 2024 & 2032
- Figure 13: North America Smart Home Security Camera Market Revenue Share (%), by Location 2024 & 2032
- Figure 14: North America Smart Home Security Camera Market Volume Share (%), by Location 2024 & 2032
- Figure 15: North America Smart Home Security Camera Market Revenue (Million), by Shape 2024 & 2032
- Figure 16: North America Smart Home Security Camera Market Volume (Billion), by Shape 2024 & 2032
- Figure 17: North America Smart Home Security Camera Market Revenue Share (%), by Shape 2024 & 2032
- Figure 18: North America Smart Home Security Camera Market Volume Share (%), by Shape 2024 & 2032
- Figure 19: North America Smart Home Security Camera Market Revenue (Million), by Country 2024 & 2032
- Figure 20: North America Smart Home Security Camera Market Volume (Billion), by Country 2024 & 2032
- Figure 21: North America Smart Home Security Camera Market Revenue Share (%), by Country 2024 & 2032
- Figure 22: North America Smart Home Security Camera Market Volume Share (%), by Country 2024 & 2032
- Figure 23: Europe Smart Home Security Camera Market Revenue (Million), by Type 2024 & 2032
- Figure 24: Europe Smart Home Security Camera Market Volume (Billion), by Type 2024 & 2032
- Figure 25: Europe Smart Home Security Camera Market Revenue Share (%), by Type 2024 & 2032
- Figure 26: Europe Smart Home Security Camera Market Volume Share (%), by Type 2024 & 2032
- Figure 27: Europe Smart Home Security Camera Market Revenue (Million), by Resolution 2024 & 2032
- Figure 28: Europe Smart Home Security Camera Market Volume (Billion), by Resolution 2024 & 2032
- Figure 29: Europe Smart Home Security Camera Market Revenue Share (%), by Resolution 2024 & 2032
- Figure 30: Europe Smart Home Security Camera Market Volume Share (%), by Resolution 2024 & 2032
- Figure 31: Europe Smart Home Security Camera Market Revenue (Million), by Location 2024 & 2032
- Figure 32: Europe Smart Home Security Camera Market Volume (Billion), by Location 2024 & 2032
- Figure 33: Europe Smart Home Security Camera Market Revenue Share (%), by Location 2024 & 2032
- Figure 34: Europe Smart Home Security Camera Market Volume Share (%), by Location 2024 & 2032
- Figure 35: Europe Smart Home Security Camera Market Revenue (Million), by Shape 2024 & 2032
- Figure 36: Europe Smart Home Security Camera Market Volume (Billion), by Shape 2024 & 2032
- Figure 37: Europe Smart Home Security Camera Market Revenue Share (%), by Shape 2024 & 2032
- Figure 38: Europe Smart Home Security Camera Market Volume Share (%), by Shape 2024 & 2032
- Figure 39: Europe Smart Home Security Camera Market Revenue (Million), by Country 2024 & 2032
- Figure 40: Europe Smart Home Security Camera Market Volume (Billion), by Country 2024 & 2032
- Figure 41: Europe Smart Home Security Camera Market Revenue Share (%), by Country 2024 & 2032
- Figure 42: Europe Smart Home Security Camera Market Volume Share (%), by Country 2024 & 2032
- Figure 43: Asia Pacific Smart Home Security Camera Market Revenue (Million), by Type 2024 & 2032
- Figure 44: Asia Pacific Smart Home Security Camera Market Volume (Billion), by Type 2024 & 2032
- Figure 45: Asia Pacific Smart Home Security Camera Market Revenue Share (%), by Type 2024 & 2032
- Figure 46: Asia Pacific Smart Home Security Camera Market Volume Share (%), by Type 2024 & 2032
- Figure 47: Asia Pacific Smart Home Security Camera Market Revenue (Million), by Resolution 2024 & 2032
- Figure 48: Asia Pacific Smart Home Security Camera Market Volume (Billion), by Resolution 2024 & 2032
- Figure 49: Asia Pacific Smart Home Security Camera Market Revenue Share (%), by Resolution 2024 & 2032
- Figure 50: Asia Pacific Smart Home Security Camera Market Volume Share (%), by Resolution 2024 & 2032
- Figure 51: Asia Pacific Smart Home Security Camera Market Revenue (Million), by Location 2024 & 2032
- Figure 52: Asia Pacific Smart Home Security Camera Market Volume (Billion), by Location 2024 & 2032
- Figure 53: Asia Pacific Smart Home Security Camera Market Revenue Share (%), by Location 2024 & 2032
- Figure 54: Asia Pacific Smart Home Security Camera Market Volume Share (%), by Location 2024 & 2032
- Figure 55: Asia Pacific Smart Home Security Camera Market Revenue (Million), by Shape 2024 & 2032
- Figure 56: Asia Pacific Smart Home Security Camera Market Volume (Billion), by Shape 2024 & 2032
- Figure 57: Asia Pacific Smart Home Security Camera Market Revenue Share (%), by Shape 2024 & 2032
- Figure 58: Asia Pacific Smart Home Security Camera Market Volume Share (%), by Shape 2024 & 2032
- Figure 59: Asia Pacific Smart Home Security Camera Market Revenue (Million), by Country 2024 & 2032
- Figure 60: Asia Pacific Smart Home Security Camera Market Volume (Billion), by Country 2024 & 2032
- Figure 61: Asia Pacific Smart Home Security Camera Market Revenue Share (%), by Country 2024 & 2032
- Figure 62: Asia Pacific Smart Home Security Camera Market Volume Share (%), by Country 2024 & 2032
- Figure 63: Latin America Smart Home Security Camera Market Revenue (Million), by Type 2024 & 2032
- Figure 64: Latin America Smart Home Security Camera Market Volume (Billion), by Type 2024 & 2032
- Figure 65: Latin America Smart Home Security Camera Market Revenue Share (%), by Type 2024 & 2032
- Figure 66: Latin America Smart Home Security Camera Market Volume Share (%), by Type 2024 & 2032
- Figure 67: Latin America Smart Home Security Camera Market Revenue (Million), by Resolution 2024 & 2032
- Figure 68: Latin America Smart Home Security Camera Market Volume (Billion), by Resolution 2024 & 2032
- Figure 69: Latin America Smart Home Security Camera Market Revenue Share (%), by Resolution 2024 & 2032
- Figure 70: Latin America Smart Home Security Camera Market Volume Share (%), by Resolution 2024 & 2032
- Figure 71: Latin America Smart Home Security Camera Market Revenue (Million), by Location 2024 & 2032
- Figure 72: Latin America Smart Home Security Camera Market Volume (Billion), by Location 2024 & 2032
- Figure 73: Latin America Smart Home Security Camera Market Revenue Share (%), by Location 2024 & 2032
- Figure 74: Latin America Smart Home Security Camera Market Volume Share (%), by Location 2024 & 2032
- Figure 75: Latin America Smart Home Security Camera Market Revenue (Million), by Shape 2024 & 2032
- Figure 76: Latin America Smart Home Security Camera Market Volume (Billion), by Shape 2024 & 2032
- Figure 77: Latin America Smart Home Security Camera Market Revenue Share (%), by Shape 2024 & 2032
- Figure 78: Latin America Smart Home Security Camera Market Volume Share (%), by Shape 2024 & 2032
- Figure 79: Latin America Smart Home Security Camera Market Revenue (Million), by Country 2024 & 2032
- Figure 80: Latin America Smart Home Security Camera Market Volume (Billion), by Country 2024 & 2032
- Figure 81: Latin America Smart Home Security Camera Market Revenue Share (%), by Country 2024 & 2032
- Figure 82: Latin America Smart Home Security Camera Market Volume Share (%), by Country 2024 & 2032
- Figure 83: Middle East and Africa Smart Home Security Camera Market Revenue (Million), by Type 2024 & 2032
- Figure 84: Middle East and Africa Smart Home Security Camera Market Volume (Billion), by Type 2024 & 2032
- Figure 85: Middle East and Africa Smart Home Security Camera Market Revenue Share (%), by Type 2024 & 2032
- Figure 86: Middle East and Africa Smart Home Security Camera Market Volume Share (%), by Type 2024 & 2032
- Figure 87: Middle East and Africa Smart Home Security Camera Market Revenue (Million), by Resolution 2024 & 2032
- Figure 88: Middle East and Africa Smart Home Security Camera Market Volume (Billion), by Resolution 2024 & 2032
- Figure 89: Middle East and Africa Smart Home Security Camera Market Revenue Share (%), by Resolution 2024 & 2032
- Figure 90: Middle East and Africa Smart Home Security Camera Market Volume Share (%), by Resolution 2024 & 2032
- Figure 91: Middle East and Africa Smart Home Security Camera Market Revenue (Million), by Location 2024 & 2032
- Figure 92: Middle East and Africa Smart Home Security Camera Market Volume (Billion), by Location 2024 & 2032
- Figure 93: Middle East and Africa Smart Home Security Camera Market Revenue Share (%), by Location 2024 & 2032
- Figure 94: Middle East and Africa Smart Home Security Camera Market Volume Share (%), by Location 2024 & 2032
- Figure 95: Middle East and Africa Smart Home Security Camera Market Revenue (Million), by Shape 2024 & 2032
- Figure 96: Middle East and Africa Smart Home Security Camera Market Volume (Billion), by Shape 2024 & 2032
- Figure 97: Middle East and Africa Smart Home Security Camera Market Revenue Share (%), by Shape 2024 & 2032
- Figure 98: Middle East and Africa Smart Home Security Camera Market Volume Share (%), by Shape 2024 & 2032
- Figure 99: Middle East and Africa Smart Home Security Camera Market Revenue (Million), by Country 2024 & 2032
- Figure 100: Middle East and Africa Smart Home Security Camera Market Volume (Billion), by Country 2024 & 2032
- Figure 101: Middle East and Africa Smart Home Security Camera Market Revenue Share (%), by Country 2024 & 2032
- Figure 102: Middle East and Africa Smart Home Security Camera Market Volume Share (%), by Country 2024 & 2032
List of Tables
- Table 1: Global Smart Home Security Camera Market Revenue Million Forecast, by Region 2019 & 2032
- Table 2: Global Smart Home Security Camera Market Volume Billion Forecast, by Region 2019 & 2032
- Table 3: Global Smart Home Security Camera Market Revenue Million Forecast, by Type 2019 & 2032
- Table 4: Global Smart Home Security Camera Market Volume Billion Forecast, by Type 2019 & 2032
- Table 5: Global Smart Home Security Camera Market Revenue Million Forecast, by Resolution 2019 & 2032
- Table 6: Global Smart Home Security Camera Market Volume Billion Forecast, by Resolution 2019 & 2032
- Table 7: Global Smart Home Security Camera Market Revenue Million Forecast, by Location 2019 & 2032
- Table 8: Global Smart Home Security Camera Market Volume Billion Forecast, by Location 2019 & 2032
- Table 9: Global Smart Home Security Camera Market Revenue Million Forecast, by Shape 2019 & 2032
- Table 10: Global Smart Home Security Camera Market Volume Billion Forecast, by Shape 2019 & 2032
- Table 11: Global Smart Home Security Camera Market Revenue Million Forecast, by Region 2019 & 2032
- Table 12: Global Smart Home Security Camera Market Volume Billion Forecast, by Region 2019 & 2032
- Table 13: Global Smart Home Security Camera Market Revenue Million Forecast, by Type 2019 & 2032
- Table 14: Global Smart Home Security Camera Market Volume Billion Forecast, by Type 2019 & 2032
- Table 15: Global Smart Home Security Camera Market Revenue Million Forecast, by Resolution 2019 & 2032
- Table 16: Global Smart Home Security Camera Market Volume Billion Forecast, by Resolution 2019 & 2032
- Table 17: Global Smart Home Security Camera Market Revenue Million Forecast, by Location 2019 & 2032
- Table 18: Global Smart Home Security Camera Market Volume Billion Forecast, by Location 2019 & 2032
- Table 19: Global Smart Home Security Camera Market Revenue Million Forecast, by Shape 2019 & 2032
- Table 20: Global Smart Home Security Camera Market Volume Billion Forecast, by Shape 2019 & 2032
- Table 21: Global Smart Home Security Camera Market Revenue Million Forecast, by Country 2019 & 2032
- Table 22: Global Smart Home Security Camera Market Volume Billion Forecast, by Country 2019 & 2032
- Table 23: Global Smart Home Security Camera Market Revenue Million Forecast, by Type 2019 & 2032
- Table 24: Global Smart Home Security Camera Market Volume Billion Forecast, by Type 2019 & 2032
- Table 25: Global Smart Home Security Camera Market Revenue Million Forecast, by Resolution 2019 & 2032
- Table 26: Global Smart Home Security Camera Market Volume Billion Forecast, by Resolution 2019 & 2032
- Table 27: Global Smart Home Security Camera Market Revenue Million Forecast, by Location 2019 & 2032
- Table 28: Global Smart Home Security Camera Market Volume Billion Forecast, by Location 2019 & 2032
- Table 29: Global Smart Home Security Camera Market Revenue Million Forecast, by Shape 2019 & 2032
- Table 30: Global Smart Home Security Camera Market Volume Billion Forecast, by Shape 2019 & 2032
- Table 31: Global Smart Home Security Camera Market Revenue Million Forecast, by Country 2019 & 2032
- Table 32: Global Smart Home Security Camera Market Volume Billion Forecast, by Country 2019 & 2032
- Table 33: Global Smart Home Security Camera Market Revenue Million Forecast, by Type 2019 & 2032
- Table 34: Global Smart Home Security Camera Market Volume Billion Forecast, by Type 2019 & 2032
- Table 35: Global Smart Home Security Camera Market Revenue Million Forecast, by Resolution 2019 & 2032
- Table 36: Global Smart Home Security Camera Market Volume Billion Forecast, by Resolution 2019 & 2032
- Table 37: Global Smart Home Security Camera Market Revenue Million Forecast, by Location 2019 & 2032
- Table 38: Global Smart Home Security Camera Market Volume Billion Forecast, by Location 2019 & 2032
- Table 39: Global Smart Home Security Camera Market Revenue Million Forecast, by Shape 2019 & 2032
- Table 40: Global Smart Home Security Camera Market Volume Billion Forecast, by Shape 2019 & 2032
- Table 41: Global Smart Home Security Camera Market Revenue Million Forecast, by Country 2019 & 2032
- Table 42: Global Smart Home Security Camera Market Volume Billion Forecast, by Country 2019 & 2032
- Table 43: Global Smart Home Security Camera Market Revenue Million Forecast, by Type 2019 & 2032
- Table 44: Global Smart Home Security Camera Market Volume Billion Forecast, by Type 2019 & 2032
- Table 45: Global Smart Home Security Camera Market Revenue Million Forecast, by Resolution 2019 & 2032
- Table 46: Global Smart Home Security Camera Market Volume Billion Forecast, by Resolution 2019 & 2032
- Table 47: Global Smart Home Security Camera Market Revenue Million Forecast, by Location 2019 & 2032
- Table 48: Global Smart Home Security Camera Market Volume Billion Forecast, by Location 2019 & 2032
- Table 49: Global Smart Home Security Camera Market Revenue Million Forecast, by Shape 2019 & 2032
- Table 50: Global Smart Home Security Camera Market Volume Billion Forecast, by Shape 2019 & 2032
- Table 51: Global Smart Home Security Camera Market Revenue Million Forecast, by Country 2019 & 2032
- Table 52: Global Smart Home Security Camera Market Volume Billion Forecast, by Country 2019 & 2032
- Table 53: Global Smart Home Security Camera Market Revenue Million Forecast, by Type 2019 & 2032
- Table 54: Global Smart Home Security Camera Market Volume Billion Forecast, by Type 2019 & 2032
- Table 55: Global Smart Home Security Camera Market Revenue Million Forecast, by Resolution 2019 & 2032
- Table 56: Global Smart Home Security Camera Market Volume Billion Forecast, by Resolution 2019 & 2032
- Table 57: Global Smart Home Security Camera Market Revenue Million Forecast, by Location 2019 & 2032
- Table 58: Global Smart Home Security Camera Market Volume Billion Forecast, by Location 2019 & 2032
- Table 59: Global Smart Home Security Camera Market Revenue Million Forecast, by Shape 2019 & 2032
- Table 60: Global Smart Home Security Camera Market Volume Billion Forecast, by Shape 2019 & 2032
- Table 61: Global Smart Home Security Camera Market Revenue Million Forecast, by Country 2019 & 2032
- Table 62: Global Smart Home Security Camera Market Volume Billion Forecast, by Country 2019 & 2032
Frequently Asked Questions
1. What is the projected Compound Annual Growth Rate (CAGR) of the Smart Home Security Camera Market?
The projected CAGR is approximately 12.78%.
2. Which companies are prominent players in the Smart Home Security Camera Market?
Key companies in the market include Hangzhou Hikvision Digital Technology Co Ltd, FrontPoint Security Solutions Inc, Honeywell International Inc, SimpliSafe Inc, ADT Corporation, Vivint Inc, Netgear Inc, Abode Systems Inc, Panasonic Corporation, Brinks Home Security, Samsung Electronics Co Ltd, Arlo Inc, Wyze Labs Inc, Philips Inc, Logitech Inc, Amcrest Industries LLC, Lorex Corporation, Somfy Inc.
3. What are the main segments of the Smart Home Security Camera Market?
The market segments include Type, Resolution, Location, Shape.
4. Can you provide details about the market size?
The market size is estimated to be USD 7.80 Million as of 2022.
5. What are some drivers contributing to market growth?
Increase in Concern Regarding Home Safety and Security; Growing Concerns About Safety. Evidenced by a Rise in Thefts and Crimes Related to Property..
6. What are the notable trends driving market growth?
Indoor Cameras is Expected to Witness a Significant Growth.
7. Are there any restraints impacting market growth?
Increase in Concern Regarding Home Safety and Security; Growing Concerns About Safety. Evidenced by a Rise in Thefts and Crimes Related to Property..
8. Can you provide examples of recent developments in the market?
May 2024: Yale, a subsidiary of ASSA ABLOY, has introduced its much anticipated Yale Smart Indoor Camera and Yale Smart Outdoor Camera. These new smart devices come equipped with advanced features, ensuring seamless control and compatibility with other Yale products, thereby simplifying smart home security for users. With the Yale Smart Outdoor Camera, homeowners can monitor their property virtually anywhere. The camera boasts 1080p Full HD resolution, an industry-leading 154° field of view, and superior color night vision.
9. What pricing options are available for accessing the report?
Pricing options include single-user, multi-user, and enterprise licenses priced at USD 4750, USD 5250, and USD 8750 respectively.
10. Is the market size provided in terms of value or volume?
The market size is provided in terms of value, measured in Million and volume, measured in Billion.
11. Are there any specific market keywords associated with the report?
Yes, the market keyword associated with the report is "Smart Home Security Camera Market," which aids in identifying and referencing the specific market segment covered.
12. How do I determine which pricing option suits my needs best?
The pricing options vary based on user requirements and access needs. Individual users may opt for single-user licenses, while businesses requiring broader access may choose multi-user or enterprise licenses for cost-effective access to the report.
13. Are there any additional resources or data provided in the Smart Home Security Camera Market report?
While the report offers comprehensive insights, it's advisable to review the specific contents or supplementary materials provided to ascertain if additional resources or data are available.
14. How can I stay updated on further developments or reports in the Smart Home Security Camera Market?
To stay informed about further developments, trends, and reports in the Smart Home Security Camera Market, consider subscribing to industry newsletters, following relevant companies and organizations, or regularly checking reputable industry news sources and publications.
Methodology
Step 1 - Identification of Relevant Samples Size from Population Database


Step 2 - Approaches for Defining Global Market Size (Value, Volume* & Price*)

Note*: In applicable scenarios
Step 3 - Data Sources
Primary Research
- Web Analytics
- Survey Reports
- Research Institute
- Latest Research Reports
- Opinion Leaders
Secondary Research
- Annual Reports
- White Paper
- Latest Press Release
- Industry Association
- Paid Database
- Investor Presentations

Step 4 - Data Triangulation
Involves using different sources of information in order to increase the validity of a study
These sources are likely to be stakeholders in a program - participants, other researchers, program staff, other community members, and so on.
Then we put all data in single framework & apply various statistical tools to find out the dynamic on the market.
During the analysis stage, feedback from the stakeholder groups would be compared to determine areas of agreement as well as areas of divergence


