


Key Insights into the Smart Manufacturing Market
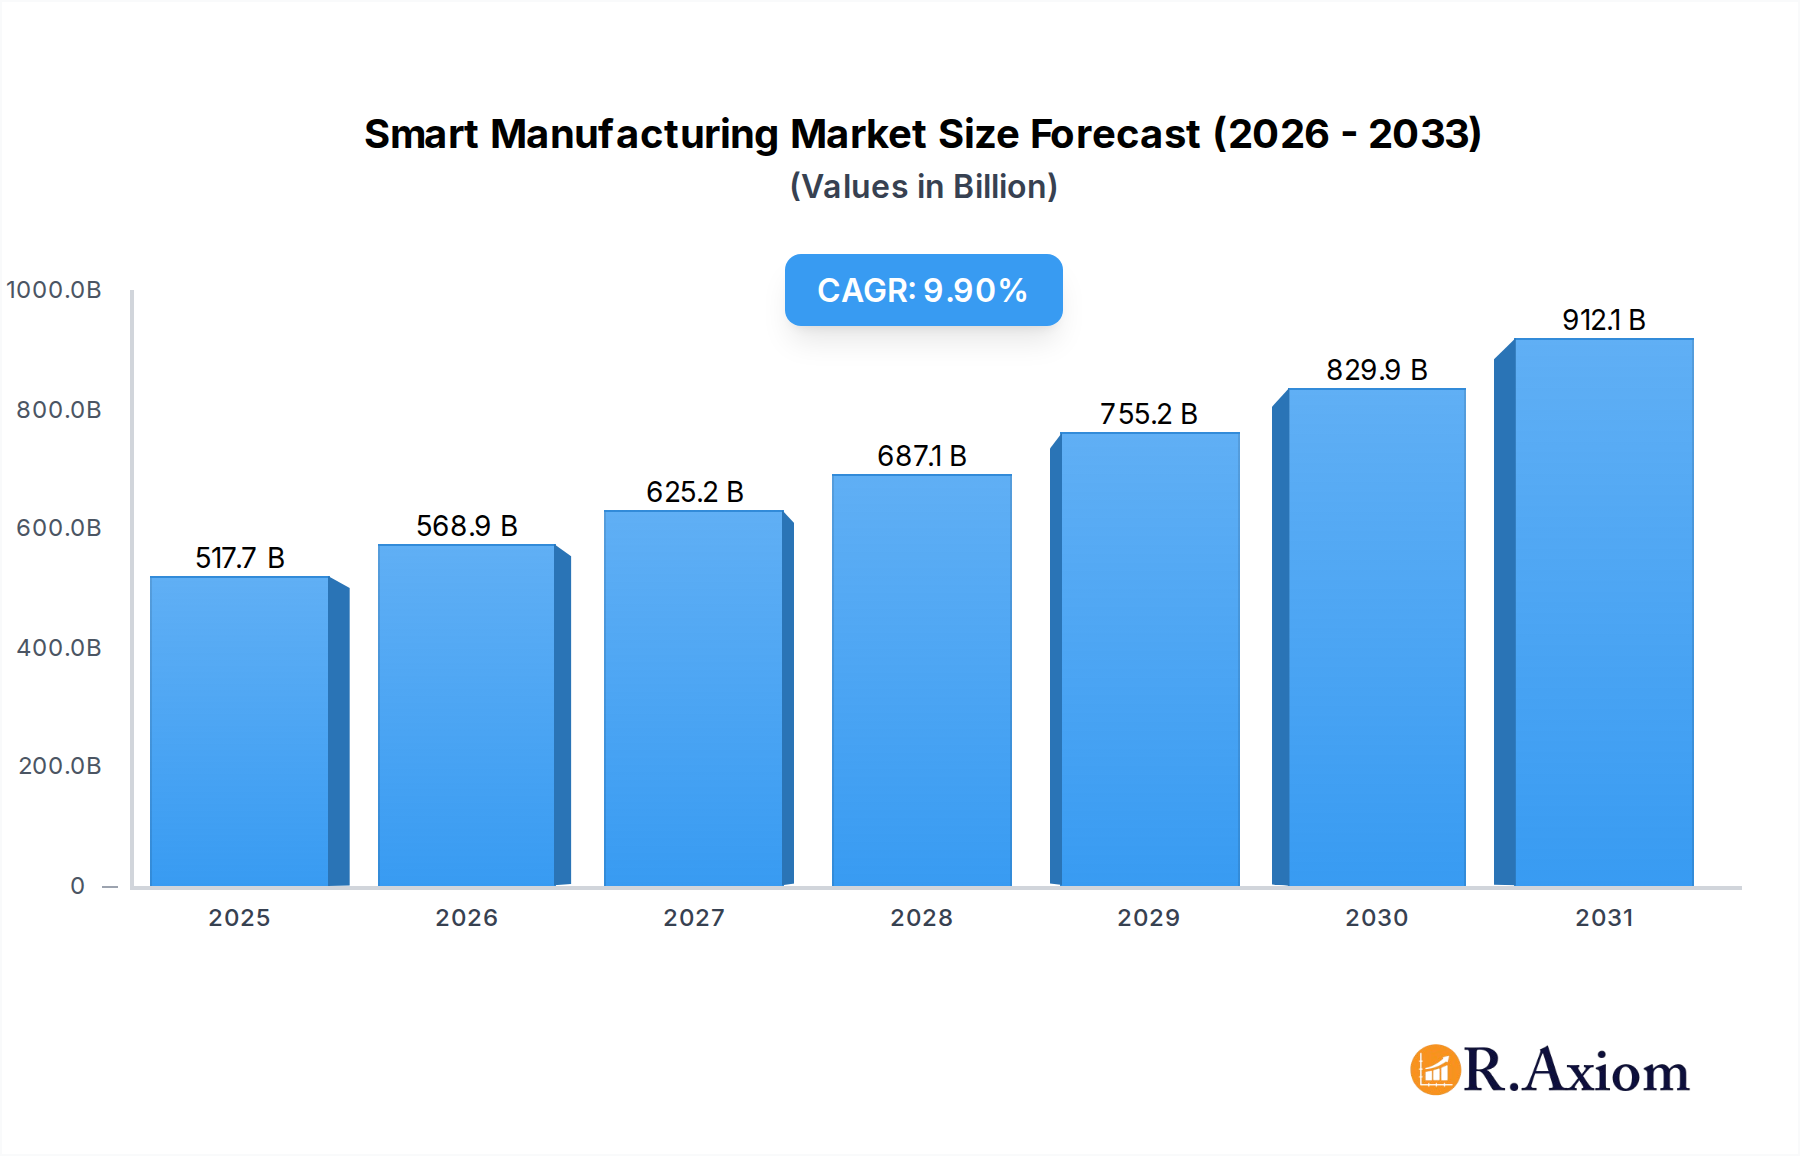
The Smart Manufacturing Market is undergoing a transformative expansion, driven by the pervasive integration of advanced digital technologies across industrial operations. Valued at an estimated USD 471,040 million in 2025, the market is poised for robust growth, projecting a substantial compound annual growth rate (CAGR) of 9.9% through 2034. This trajectory is anticipated to culminate in a global valuation of approximately USD 1,115,861 million by the end of the forecast period. The fundamental impetus behind this accelerated growth is the increasing imperative for operational efficiency, cost reduction, and enhanced productivity amidst rising global competition and fluctuating supply chains. Key demand drivers include the escalating adoption of Industry 4.0 paradigms, the urgent need for real-time data analytics for informed decision-making, and the growing complexity of global manufacturing ecosystems. Macro tailwinds such as supportive government initiatives for digital transformation, rapid advancements in artificial intelligence (AI) and machine learning (ML), and the declining cost of sophisticated sensing and processing hardware are significantly propelling market expansion. The convergence of IT (Information Technology) and OT (Operational Technology) is a critical enabler, facilitating seamless data flow and process optimization from the shop floor to enterprise-level systems. Furthermore, the rising focus on sustainability and energy efficiency within industrial processes is driving investments into smart solutions that can monitor and optimize resource consumption. The demand for customized products and shorter product life cycles necessitate agile and adaptable manufacturing processes, capabilities inherently offered by smart manufacturing solutions. This extensive adoption is significantly shaping the broader Industrial Automation Market, where smart solutions are becoming the de facto standard for optimizing production lines. The integration of advanced analytics further amplifies capabilities, moving beyond traditional automation to predictive and prescriptive operational models. The momentum in the Smart Manufacturing Market is also evident in the robust expansion of the Industrial IoT Market, providing the foundational connectivity and data acquisition layers necessary for intelligent operations.
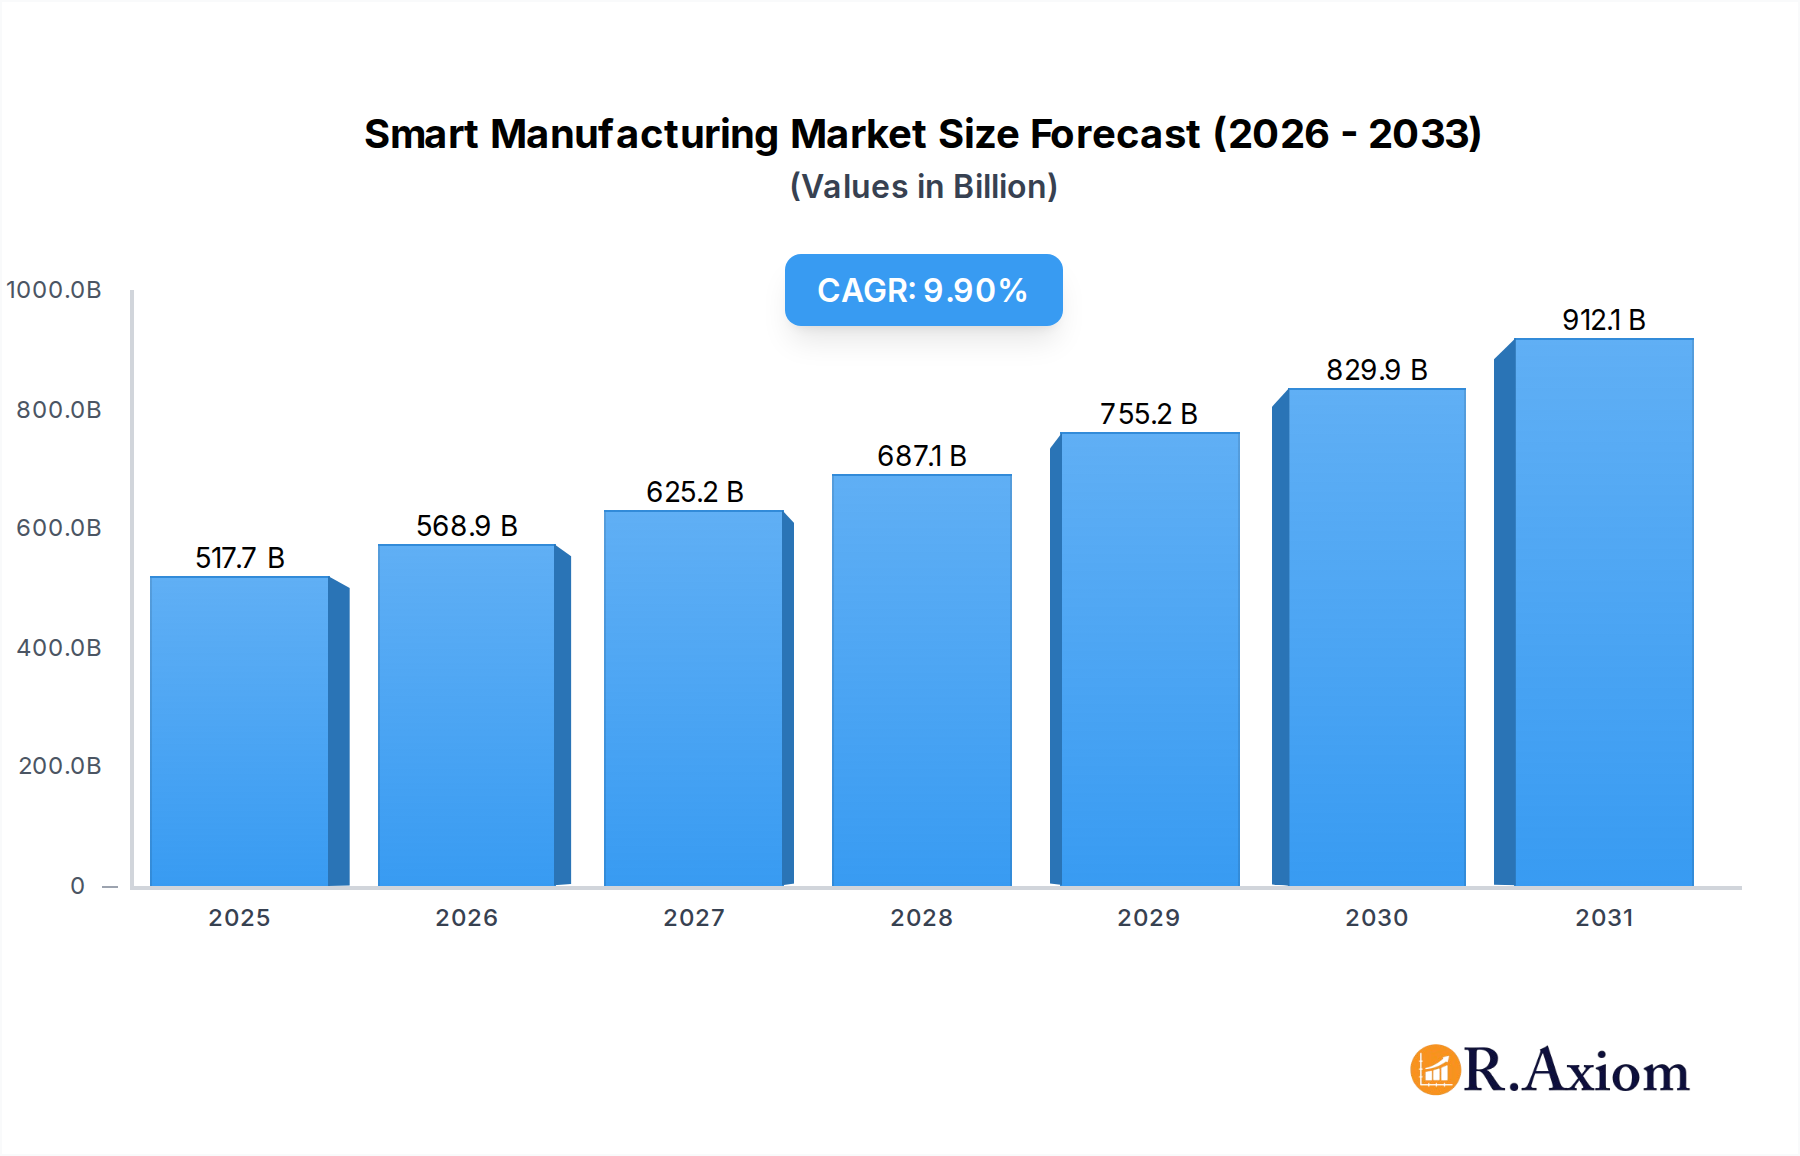
Smart Manufacturing Market Size (In Billion)

Dominant Software Segment in Smart Manufacturing Market
The Software segment emerges as the single largest and most influential component within the Smart Manufacturing Market, underpinning the intelligence and interconnectedness that define modern industrial operations. While hardware provides the physical infrastructure and services facilitate implementation and maintenance, it is the sophisticated software solutions that integrate, analyze, and optimize processes across the entire manufacturing value chain. This dominance is attributed to several factors: software’s ability to drive complex analytics, enable real-time decision-making, facilitate remote monitoring and control, and provide the interface for human-machine interaction. From Manufacturing Execution Systems (MES) and Enterprise Resource Planning (ERP) to advanced analytics platforms, Artificial Intelligence (AI) algorithms, and Machine Learning (ML) applications, software acts as the central nervous system of a smart factory. The demand for advanced Manufacturing Software Market solutions continues to surge as companies seek to harness the vast amounts of data generated by connected sensors and machines to derive actionable insights, predict equipment failures, and optimize production schedules. This is crucial for applications in the Digital Twin Market, where virtual models are simulated and optimized using extensive software capabilities before physical implementation. Leading players in this space, such as SAP, Oracle, Siemens, and Rockwell Automation, are continually investing in R&D to enhance their software offerings, incorporating capabilities like cloud computing, edge analytics, and cybersecurity features tailored for industrial environments. The recurring revenue models associated with software licenses, subscriptions, and updates further solidify its dominant market share compared to the more cyclical nature of hardware procurement. The critical role of software in integrating diverse hardware components, such as those within the Robotics Market and the Industrial Sensors Market, ensures seamless data flow and coordinated operations. Without robust software, the potential of advanced robotics, sensor networks, and other smart hardware remains largely untapped. Furthermore, the agility of software allows for quicker updates and adaptations to evolving manufacturing demands and technological advancements, providing a flexible foundation for continuous improvement. As manufacturers increasingly transition towards data-driven operations, the value proposition of specialized software that can interpret, visualize, and act upon this data becomes indispensable. The ongoing evolution towards more modular, AI-driven, and cloud-native software architectures is expected to further consolidate the segment's leadership, propelling innovation and efficiency across the Smart Manufacturing Market.
Smart Manufacturing Company Market Share
Advancing Market Drivers and Constraints in Smart Manufacturing Market
The Smart Manufacturing Market is propelled by a confluence of potent drivers, yet it also navigates significant constraints. A primary driver is the accelerating global adoption of Industry 4.0 principles, evidenced by a significant year-over-year increase in digital transformation spending across manufacturing enterprises, with investments growing by an estimated 15-20% annually in key regions. This trend reflects a strategic shift towards integrated, data-driven production systems. Another crucial driver is the imperative for enhanced operational efficiency and cost reduction. For instance, the implementation of Predictive Maintenance Market solutions can reduce unscheduled downtime by 20-50% and cut maintenance costs by 10-40%, directly impacting profitability. This is supported by data from various industrial reports highlighting significant savings in operational expenditures for early adopters. The increasing demand for product customization and shorter product lifecycles also acts as a catalyst, necessitating flexible and agile production lines that can quickly adapt to changing market requirements. Smart factories, enabled by advanced analytics and modular systems, can achieve product changeover times up to 30% faster than traditional setups. Furthermore, the growing focus on supply chain resilience, exacerbated by recent global disruptions, is driving investment in smart manufacturing to create more transparent, responsive, and robust supply networks. Technologies like Digital Twin Market are instrumental here, allowing for virtual simulation and optimization of supply chain logistics before physical deployment. Conversely, several constraints impede the market’s full potential. The high initial capital expenditure associated with implementing smart manufacturing solutions, which can range from several hundred thousand to millions of dollars depending on scale, poses a significant barrier, particularly for Small & Medium Enterprises (SMEs). Another critical constraint is the cybersecurity risk inherent in highly interconnected systems. As operational technology (OT) networks become more integrated with IT infrastructure, the attack surface expands, leading to concerns about data breaches, intellectual property theft, and operational disruption. Reports indicate that industrial control systems (ICS) face an escalating number of cyber threats, requiring substantial investment in robust security protocols. Furthermore, a persistent shortage of skilled personnel capable of deploying, managing, and maintaining complex smart manufacturing systems, including expertise in AI, data science, and advanced robotics, slows adoption. These factors collectively shape the growth trajectory of the Smart Manufacturing Market.
Competitive Ecosystem of Smart Manufacturing Market
The competitive landscape of the Smart Manufacturing Market is characterized by a blend of established industrial conglomerates, enterprise software giants, and specialized technology providers, all vying for market share through innovation, strategic partnerships, and comprehensive solution offerings. These players are focused on delivering integrated platforms that cover everything from sensor-level data acquisition to enterprise-wide analytics and control.
- GE: A multinational conglomerate, GE leverages its extensive industrial domain expertise and digital capabilities through its Predix platform, focusing on asset performance management and operational efficiency solutions for heavy industries.
- ABB: A leader in power and automation technologies, ABB provides a broad portfolio of robotics, industrial automation, and electrification products, integrating them with software solutions for smart factory optimization.
- Siemens: A dominant force, Siemens offers an unparalleled suite of hardware and software for industrial automation, including its Digital Enterprise portfolio that encompasses PLM, MES, and IIoT platforms, driving efficiency across manufacturing processes.
- SAP: As a global leader in enterprise software, SAP provides critical ERP and manufacturing execution systems (MES) that integrate shop floor operations with business processes, essential for data-driven decision-making in smart factories.
- Schneider: Specializing in energy management and automation, Schneider Electric delivers comprehensive solutions for industrial control, software, and services, focusing on sustainability and efficiency in smart operations.
- Emerson: Emerson offers a wide array of automation solutions, including control systems, software, and measurement technologies, primarily serving process industries and focusing on reliability and operational performance.
- Oracle: A key player in enterprise software, Oracle provides cloud-based applications and platforms that support manufacturing operations, supply chain management, and data analytics, crucial for modern smart factories.
- IBM: Leveraging its AI and cloud computing prowess, IBM offers solutions for industrial IoT, data analytics, and blockchain for supply chain transparency, driving intelligent operations and predictive capabilities.
- Honeywell: Honeywell provides a diverse range of industrial automation and control systems, software solutions, and advanced materials, with a strong focus on safety, security, and productivity across various sectors.
- Cisco: A networking hardware and software giant, Cisco plays a vital role in providing the secure and robust network infrastructure necessary for connecting devices and systems within smart manufacturing environments.
- Rockwell: Specializing in industrial automation and information solutions, Rockwell Automation offers a comprehensive portfolio of control systems, software, and services designed to enhance manufacturing productivity and agility.
- NVIDIA: A leader in GPU technology, NVIDIA provides crucial hardware and software platforms for AI, machine learning, and simulation, enabling advanced robotics, computer vision, and Digital Twin Market applications in manufacturing.
- 3D Systems: A pioneer in additive manufacturing, 3D Systems offers 3D printers, materials, and software, enabling rapid prototyping, tooling, and direct part production for agile smart manufacturing processes.
- Daifuku: A global leader in material handling systems, Daifuku provides automated storage and retrieval systems (AS/RS), conveyors, and AGVs, critical components for optimizing logistics and throughput in smart factories.
Recent Developments & Milestones in Smart Manufacturing Market
Recent years have seen a flurry of strategic activities and technological breakthroughs in the Smart Manufacturing Market, reflecting an accelerating pace of innovation and collaboration:
- March 2024: Siemens announced a new partnership with NVIDIA to expand its industrial metaverse offerings, integrating NVIDIA Omniverse with the Siemens Xcelerator platform to accelerate the development of industrial Digital Twin Market solutions and enhance factory design and simulation capabilities.
- January 2024: Rockwell Automation completed the acquisition of Verve Industrial Protection, strengthening its portfolio in industrial cybersecurity services, a critical area for safeguarding interconnected smart manufacturing environments.
- November 2023: ABB launched its new modular robotics application for advanced packaging, enabling greater flexibility and speed for consumer goods manufacturers seeking to implement more agile and automated production lines. This directly impacts the Robotics Market.
- September 2023: GE Digital unveiled an enhanced version of its Proficy Operations Hub, providing a unified operations visualization and analysis platform designed to improve decision-making and efficiency across disparate manufacturing systems.
- July 2023: SAP introduced new AI-powered capabilities across its manufacturing software suite, aiming to provide predictive insights and automated decision support for production planning and execution, reinforcing its position in the Manufacturing Software Market.
- April 2023: The Industrial Internet Consortium (IIC) published a new framework for trusted Industrial IoT Market deployments, offering guidance on security, privacy, and interoperability for complex smart factory ecosystems.
- February 2023: A consortium of leading automotive manufacturers, including BMW and General Motors, announced a joint initiative to standardize data exchange protocols for the Automotive Manufacturing Market, aiming to enhance interoperability within their smart supply chains.
Regional Market Breakdown for Smart Manufacturing Market
The Smart Manufacturing Market exhibits distinct regional dynamics, influenced by varying levels of industrial maturity, government support, and technological adoption rates. Asia Pacific stands out as the fastest-growing region, projected to achieve a CAGR exceeding 11.5% over the forecast period and commanding a significant revenue share, estimated at approximately 40% of the global market. This rapid expansion is primarily driven by extensive industrialization in China and India, coupled with significant investments in smart factory initiatives and digital transformation by established manufacturing hubs like Japan and South Korea. Government-backed programs, such as China's 'Made in China 2025' and India's 'Make in India,' actively promote the adoption of advanced manufacturing technologies, further fueling demand for solutions in the Industrial Automation Market and Industrial IoT Market. North America, while a more mature market, continues to hold a substantial revenue share, estimated around 25%, with a projected CAGR of approximately 8.5%. The region's growth is driven by a strong focus on reshoring manufacturing, increasing labor costs, and a high rate of technological innovation, particularly in the United States. Key demand drivers include the modernization of existing infrastructure and the widespread adoption of AI and advanced robotics across sectors like the Automotive Manufacturing Market and Electronics Manufacturing Market. Europe accounts for an estimated 20% of the global market, with a CAGR similar to North America, around 8.0-9.0%. Countries like Germany, with its 'Industry 4.0' initiative, are at the forefront of smart manufacturing adoption, driven by stringent regulatory environments for quality and efficiency, and a robust industrial base. The region's emphasis on sustainable manufacturing also promotes smart solutions for energy optimization and waste reduction. The Middle East & Africa (MEA) and Latin America regions collectively represent the remaining market share, characterized by emerging growth and significant potential. MEA, particularly the GCC countries, is witnessing increasing investments in industrial diversification, driving demand for new smart factory setups. Latin America is also gradually embracing smart manufacturing, with Brazil and Mexico leading the adoption in select industries. These regions are poised for accelerated growth as digital infrastructure improves and awareness of smart manufacturing benefits increases, contributing to a diverse global Smart Manufacturing Market landscape.
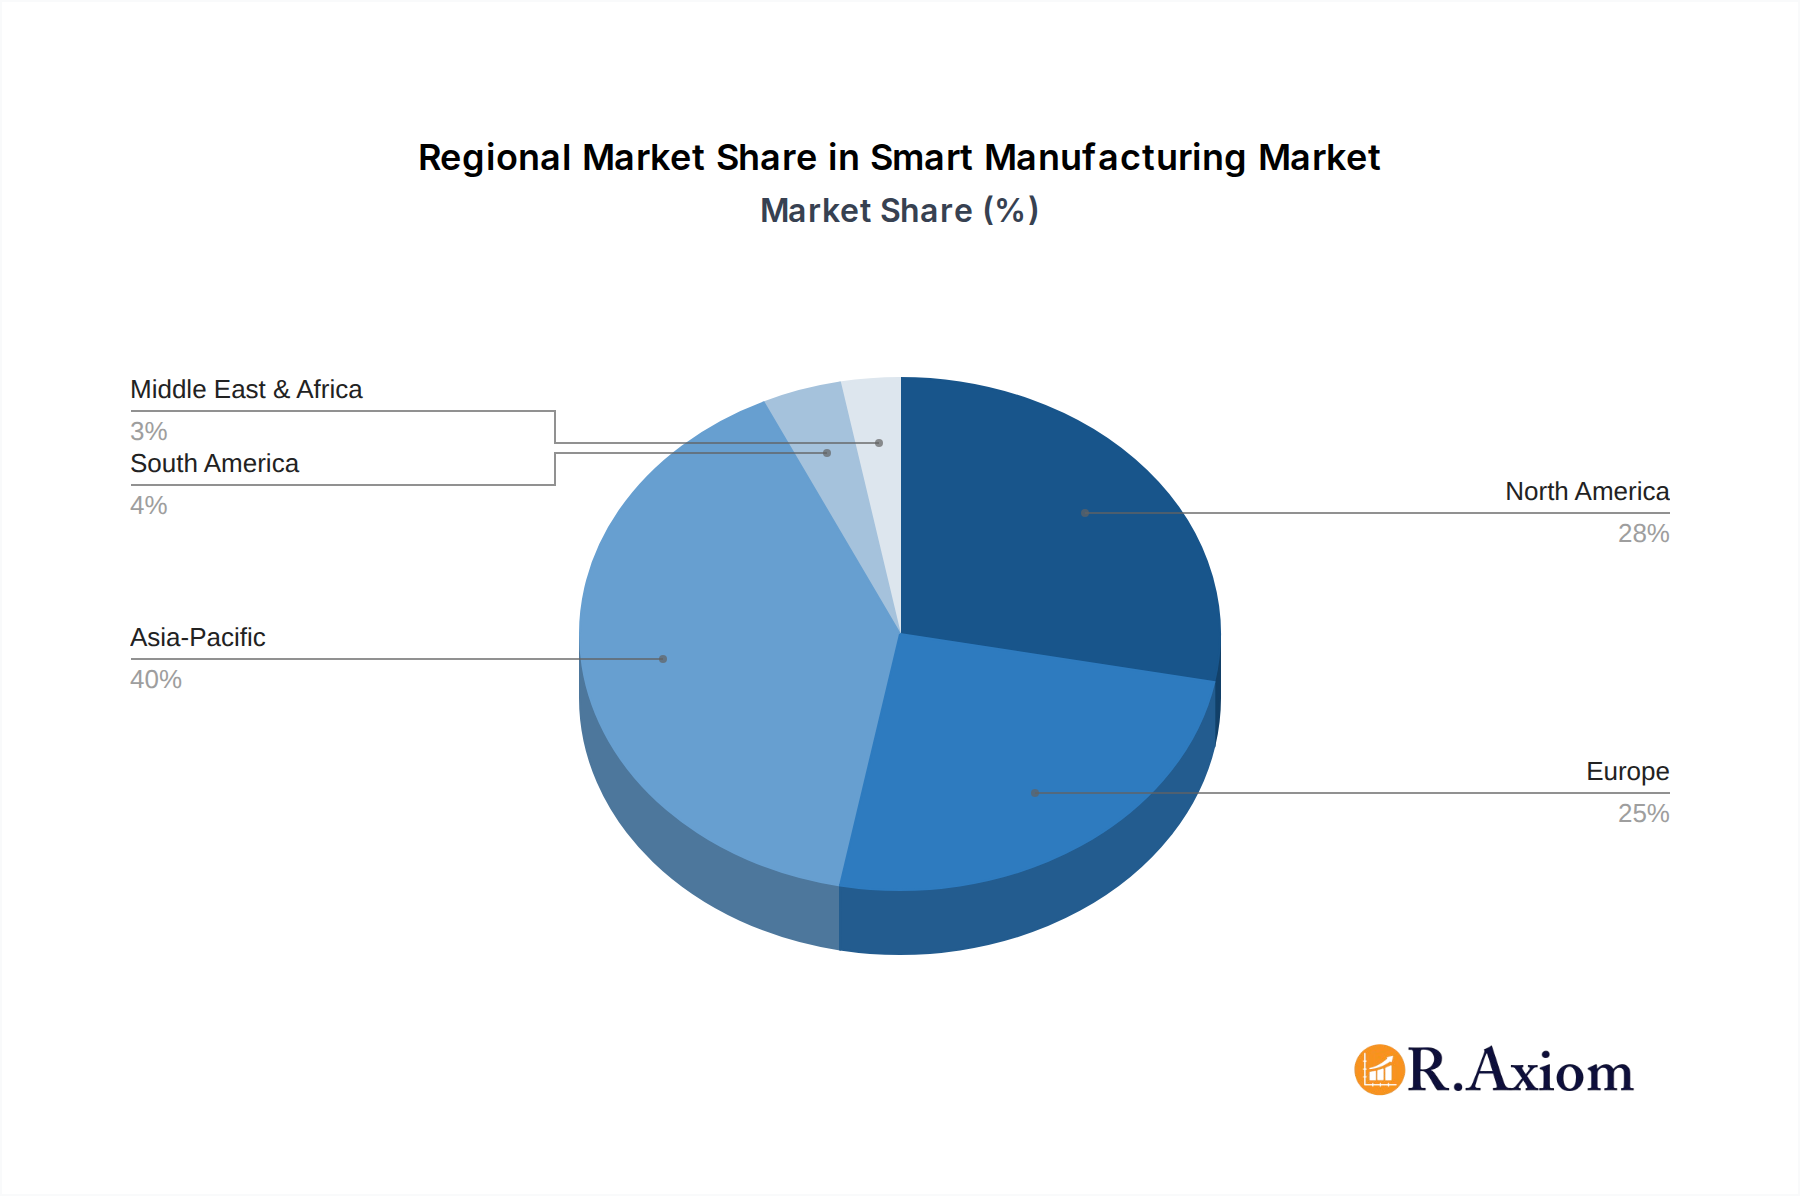
Smart Manufacturing Regional Market Share
Pricing Dynamics & Margin Pressure in Smart Manufacturing Market
The pricing dynamics within the Smart Manufacturing Market are complex, influenced by the interplay of technology innovation, solution complexity, customization requirements, and competitive intensity. Average selling prices (ASPs) for foundational hardware components, such as Industrial Sensors Market and basic controllers, have shown a moderate decline over recent years due to economies of scale and increased competition, making entry-level smart solutions more accessible. However, ASPs for sophisticated software platforms, advanced analytics, and specialized Artificial Intelligence (AI) modules, especially those critical for the Digital Twin Market or Predictive Maintenance Market, remain robust, reflecting the high value-add and intellectual property embedded within these offerings. Margin structures across the value chain vary significantly. Hardware providers typically operate on thinner margins, driven by production costs and competitive pressures. Software and services providers, conversely, often enjoy higher gross margins due to lower variable costs and the recurring revenue nature of subscriptions and maintenance contracts. This disparity encourages a strategic shift among traditional hardware-centric companies towards integrated software and service portfolios to capture greater value. Key cost levers in smart manufacturing implementation include the initial capital expenditure for hardware and integration, ongoing software licensing and subscription fees, and the cost of training skilled personnel. Commodity cycles, particularly for critical electronic components and rare earth minerals used in advanced Robotics Market, can exert upward pressure on hardware costs, impacting overall solution pricing. Furthermore, the intense competitive landscape, characterized by numerous global players offering similar functionalities, places continuous margin pressure on vendors, compelling them to differentiate through superior technology, tailored solutions, and value-added services. The custom nature of many smart manufacturing deployments, requiring significant engineering and integration efforts, also influences pricing, often moving towards project-based fees rather than standardized product pricing. As the market matures, standardization efforts and modular solution designs may lead to some price rationalization, but the demand for bespoke, high-performance systems will likely maintain premium pricing for advanced capabilities.
Supply Chain & Raw Material Dynamics for Smart Manufacturing Market
The Smart Manufacturing Market is inherently reliant on a complex and global supply chain, involving a diverse array of upstream dependencies for its various components. Key inputs include semiconductors and microcontrollers for the processing units of industrial IoT devices and controllers, specialized metals and alloys for robust Robotics Market components and industrial machinery, and various electronic components for sensors and communication modules. The sourcing risks associated with these raw materials are substantial, particularly for rare earth elements essential for advanced magnets in motors, and for silicon wafers in semiconductor manufacturing, which are often concentrated in specific geopolitical regions. Price volatility of these key inputs has been a significant concern, with semiconductor shortages, for instance, causing widespread disruptions and cost increases across multiple industries, including the Automotive Manufacturing Market and Electronics Manufacturing Market, in recent years. This volatility can directly impact the cost of smart manufacturing solutions, affecting vendor margins and end-user investment decisions. Historical supply chain disruptions, such as those caused by the COVID-19 pandemic, geopolitical tensions, and natural disasters, have profoundly affected the Smart Manufacturing Market. These events highlighted vulnerabilities, including over-reliance on single-source suppliers and lack of real-time visibility into the extended supply chain. For example, factory shutdowns in specific regions led to significant delays in the delivery of Industrial Sensors Market, controllers, and other critical hardware, impeding smart factory deployments globally. In response, manufacturers and solution providers are increasingly focusing on building more resilient supply chains through diversification of sourcing, regionalization of production, and the adoption of digital tools for enhanced transparency and risk management. Furthermore, the push for sustainable manufacturing is also influencing raw material dynamics, with a growing emphasis on recycled content, ethical sourcing, and circular economy principles. Overall, navigating the intricacies of raw material procurement and mitigating supply chain risks remains a critical strategic imperative for the sustained growth and stability of the Smart Manufacturing Market.
Smart Manufacturing Segmentation
-
1. Component
- 1.1. Hardware
- 1.2. Software
- 1.3. Services
-
2. Manufacturing Process
- 2.1. Discrete Manufacturing
- 2.2. Process Manufacturing
- 2.3. Hybrid Manufacturing
-
3. Enterprise Size
- 3.1. Large Enterprises
- 3.2. Small & Medium Enterprises (SMEs)
-
4. End User Industry
- 4.1. Automotive
- 4.2. Electronics & Semiconductors
- 4.3. Machinery & Industrial Equipment
- 4.4. Aerospace & Defense
- 4.5. Chemicals & Petrochemicals
- 4.6. Pharmaceuticals & Biotechnology
- 4.7. Food & Beverage
- 4.8. Metals & Mining
- 4.9. Energy & Power
- 4.10. Textiles & Apparel
- 4.11. Consumer Goods
- 4.12. Others
Smart Manufacturing Segmentation By Geography
-
1. North America
- 1.1. United States
- 1.2. Canada
- 1.3. Mexico
-
2. South America
- 2.1. Brazil
- 2.2. Argentina
- 2.3. Rest of South America
-
3. Europe
- 3.1. United Kingdom
- 3.2. Germany
- 3.3. France
- 3.4. Italy
- 3.5. Spain
- 3.6. Russia
- 3.7. Benelux
- 3.8. Nordics
- 3.9. Rest of Europe
-
4. Middle East & Africa
- 4.1. Turkey
- 4.2. Israel
- 4.3. GCC
- 4.4. North Africa
- 4.5. South Africa
- 4.6. Rest of Middle East & Africa
-
5. Asia Pacific
- 5.1. China
- 5.2. India
- 5.3. Japan
- 5.4. South Korea
- 5.5. ASEAN
- 5.6. Oceania
- 5.7. Rest of Asia Pacific
Smart Manufacturing Regional Market Share
Geographic Coverage of Smart Manufacturing
Smart Manufacturing REPORT HIGHLIGHTS
| Aspects | Details |
|---|---|
| Study Period | 2020-2034 |
| Base Year | 2025 |
| Estimated Year | 2026 |
| Forecast Period | 2026-2034 |
| Historical Period | 2020-2025 |
| Growth Rate | CAGR of 9.9% from 2020-2034 |
| Segmentation |
|
Table of Contents
- 1. Introduction
- 1.1. Research Scope
- 1.2. Market Segmentation
- 1.3. Research Objective
- 1.4. Definitions and Assumptions
- 2. Executive Summary
- 2.1. Market Snapshot
- 3. Market Dynamics
- 3.1. Market Drivers
- 3.2. Market Restrains
- 3.3. Market Trends
- 3.4. Market Opportunities
- 4. Market Factor Analysis
- 4.1. Porters Five Forces
- 4.1.1. Bargaining Power of Suppliers
- 4.1.2. Bargaining Power of Buyers
- 4.1.3. Threat of New Entrants
- 4.1.4. Threat of Substitutes
- 4.1.5. Competitive Rivalry
- 4.2. PESTEL analysis
- 4.3. BCG Analysis
- 4.3.1. Stars (High Growth, High Market Share)
- 4.3.2. Cash Cows (Low Growth, High Market Share)
- 4.3.3. Question Mark (High Growth, Low Market Share)
- 4.3.4. Dogs (Low Growth, Low Market Share)
- 4.4. Ansoff Matrix Analysis
- 4.5. Supply Chain Analysis
- 4.6. Regulatory Landscape
- 4.7. Current Market Potential and Opportunity Assessment (TAM–SAM–SOM Framework)
- 4.8. RAX Analyst Note
- 4.1. Porters Five Forces
- 5. Market Analysis, Insights and Forecast 2021-2033
- 5.1. Market Analysis, Insights and Forecast - by Component
- 5.1.1. Hardware
- 5.1.2. Software
- 5.1.3. Services
- 5.2. Market Analysis, Insights and Forecast - by Manufacturing Process
- 5.2.1. Discrete Manufacturing
- 5.2.2. Process Manufacturing
- 5.2.3. Hybrid Manufacturing
- 5.3. Market Analysis, Insights and Forecast - by Enterprise Size
- 5.3.1. Large Enterprises
- 5.3.2. Small & Medium Enterprises (SMEs)
- 5.4. Market Analysis, Insights and Forecast - by End User Industry
- 5.4.1. Automotive
- 5.4.2. Electronics & Semiconductors
- 5.4.3. Machinery & Industrial Equipment
- 5.4.4. Aerospace & Defense
- 5.4.5. Chemicals & Petrochemicals
- 5.4.6. Pharmaceuticals & Biotechnology
- 5.4.7. Food & Beverage
- 5.4.8. Metals & Mining
- 5.4.9. Energy & Power
- 5.4.10. Textiles & Apparel
- 5.4.11. Consumer Goods
- 5.4.12. Others
- 5.5. Market Analysis, Insights and Forecast - by Region
- 5.5.1. North America
- 5.5.2. South America
- 5.5.3. Europe
- 5.5.4. Middle East & Africa
- 5.5.5. Asia Pacific
- 5.1. Market Analysis, Insights and Forecast - by Component
- 6. Global Smart Manufacturing Analysis, Insights and Forecast, 2021-2033
- 6.1. Market Analysis, Insights and Forecast - by Component
- 6.1.1. Hardware
- 6.1.2. Software
- 6.1.3. Services
- 6.2. Market Analysis, Insights and Forecast - by Manufacturing Process
- 6.2.1. Discrete Manufacturing
- 6.2.2. Process Manufacturing
- 6.2.3. Hybrid Manufacturing
- 6.3. Market Analysis, Insights and Forecast - by Enterprise Size
- 6.3.1. Large Enterprises
- 6.3.2. Small & Medium Enterprises (SMEs)
- 6.4. Market Analysis, Insights and Forecast - by End User Industry
- 6.4.1. Automotive
- 6.4.2. Electronics & Semiconductors
- 6.4.3. Machinery & Industrial Equipment
- 6.4.4. Aerospace & Defense
- 6.4.5. Chemicals & Petrochemicals
- 6.4.6. Pharmaceuticals & Biotechnology
- 6.4.7. Food & Beverage
- 6.4.8. Metals & Mining
- 6.4.9. Energy & Power
- 6.4.10. Textiles & Apparel
- 6.4.11. Consumer Goods
- 6.4.12. Others
- 6.1. Market Analysis, Insights and Forecast - by Component
- 7. North America Smart Manufacturing Analysis, Insights and Forecast, 2020-2032
- 7.1. Market Analysis, Insights and Forecast - by Component
- 7.1.1. Hardware
- 7.1.2. Software
- 7.1.3. Services
- 7.2. Market Analysis, Insights and Forecast - by Manufacturing Process
- 7.2.1. Discrete Manufacturing
- 7.2.2. Process Manufacturing
- 7.2.3. Hybrid Manufacturing
- 7.3. Market Analysis, Insights and Forecast - by Enterprise Size
- 7.3.1. Large Enterprises
- 7.3.2. Small & Medium Enterprises (SMEs)
- 7.4. Market Analysis, Insights and Forecast - by End User Industry
- 7.4.1. Automotive
- 7.4.2. Electronics & Semiconductors
- 7.4.3. Machinery & Industrial Equipment
- 7.4.4. Aerospace & Defense
- 7.4.5. Chemicals & Petrochemicals
- 7.4.6. Pharmaceuticals & Biotechnology
- 7.4.7. Food & Beverage
- 7.4.8. Metals & Mining
- 7.4.9. Energy & Power
- 7.4.10. Textiles & Apparel
- 7.4.11. Consumer Goods
- 7.4.12. Others
- 7.1. Market Analysis, Insights and Forecast - by Component
- 8. South America Smart Manufacturing Analysis, Insights and Forecast, 2020-2032
- 8.1. Market Analysis, Insights and Forecast - by Component
- 8.1.1. Hardware
- 8.1.2. Software
- 8.1.3. Services
- 8.2. Market Analysis, Insights and Forecast - by Manufacturing Process
- 8.2.1. Discrete Manufacturing
- 8.2.2. Process Manufacturing
- 8.2.3. Hybrid Manufacturing
- 8.3. Market Analysis, Insights and Forecast - by Enterprise Size
- 8.3.1. Large Enterprises
- 8.3.2. Small & Medium Enterprises (SMEs)
- 8.4. Market Analysis, Insights and Forecast - by End User Industry
- 8.4.1. Automotive
- 8.4.2. Electronics & Semiconductors
- 8.4.3. Machinery & Industrial Equipment
- 8.4.4. Aerospace & Defense
- 8.4.5. Chemicals & Petrochemicals
- 8.4.6. Pharmaceuticals & Biotechnology
- 8.4.7. Food & Beverage
- 8.4.8. Metals & Mining
- 8.4.9. Energy & Power
- 8.4.10. Textiles & Apparel
- 8.4.11. Consumer Goods
- 8.4.12. Others
- 8.1. Market Analysis, Insights and Forecast - by Component
- 9. Europe Smart Manufacturing Analysis, Insights and Forecast, 2020-2032
- 9.1. Market Analysis, Insights and Forecast - by Component
- 9.1.1. Hardware
- 9.1.2. Software
- 9.1.3. Services
- 9.2. Market Analysis, Insights and Forecast - by Manufacturing Process
- 9.2.1. Discrete Manufacturing
- 9.2.2. Process Manufacturing
- 9.2.3. Hybrid Manufacturing
- 9.3. Market Analysis, Insights and Forecast - by Enterprise Size
- 9.3.1. Large Enterprises
- 9.3.2. Small & Medium Enterprises (SMEs)
- 9.4. Market Analysis, Insights and Forecast - by End User Industry
- 9.4.1. Automotive
- 9.4.2. Electronics & Semiconductors
- 9.4.3. Machinery & Industrial Equipment
- 9.4.4. Aerospace & Defense
- 9.4.5. Chemicals & Petrochemicals
- 9.4.6. Pharmaceuticals & Biotechnology
- 9.4.7. Food & Beverage
- 9.4.8. Metals & Mining
- 9.4.9. Energy & Power
- 9.4.10. Textiles & Apparel
- 9.4.11. Consumer Goods
- 9.4.12. Others
- 9.1. Market Analysis, Insights and Forecast - by Component
- 10. Middle East & Africa Smart Manufacturing Analysis, Insights and Forecast, 2020-2032
- 10.1. Market Analysis, Insights and Forecast - by Component
- 10.1.1. Hardware
- 10.1.2. Software
- 10.1.3. Services
- 10.2. Market Analysis, Insights and Forecast - by Manufacturing Process
- 10.2.1. Discrete Manufacturing
- 10.2.2. Process Manufacturing
- 10.2.3. Hybrid Manufacturing
- 10.3. Market Analysis, Insights and Forecast - by Enterprise Size
- 10.3.1. Large Enterprises
- 10.3.2. Small & Medium Enterprises (SMEs)
- 10.4. Market Analysis, Insights and Forecast - by End User Industry
- 10.4.1. Automotive
- 10.4.2. Electronics & Semiconductors
- 10.4.3. Machinery & Industrial Equipment
- 10.4.4. Aerospace & Defense
- 10.4.5. Chemicals & Petrochemicals
- 10.4.6. Pharmaceuticals & Biotechnology
- 10.4.7. Food & Beverage
- 10.4.8. Metals & Mining
- 10.4.9. Energy & Power
- 10.4.10. Textiles & Apparel
- 10.4.11. Consumer Goods
- 10.4.12. Others
- 10.1. Market Analysis, Insights and Forecast - by Component
- 11. Asia Pacific Smart Manufacturing Analysis, Insights and Forecast, 2020-2032
- 11.1. Market Analysis, Insights and Forecast - by Component
- 11.1.1. Hardware
- 11.1.2. Software
- 11.1.3. Services
- 11.2. Market Analysis, Insights and Forecast - by Manufacturing Process
- 11.2.1. Discrete Manufacturing
- 11.2.2. Process Manufacturing
- 11.2.3. Hybrid Manufacturing
- 11.3. Market Analysis, Insights and Forecast - by Enterprise Size
- 11.3.1. Large Enterprises
- 11.3.2. Small & Medium Enterprises (SMEs)
- 11.4. Market Analysis, Insights and Forecast - by End User Industry
- 11.4.1. Automotive
- 11.4.2. Electronics & Semiconductors
- 11.4.3. Machinery & Industrial Equipment
- 11.4.4. Aerospace & Defense
- 11.4.5. Chemicals & Petrochemicals
- 11.4.6. Pharmaceuticals & Biotechnology
- 11.4.7. Food & Beverage
- 11.4.8. Metals & Mining
- 11.4.9. Energy & Power
- 11.4.10. Textiles & Apparel
- 11.4.11. Consumer Goods
- 11.4.12. Others
- 11.1. Market Analysis, Insights and Forecast - by Component
- 12. Competitive Analysis
- 12.1. Company Profiles
- 12.1.1 GE
- 12.1.1.1. Company Overview
- 12.1.1.2. Products
- 12.1.1.3. Company Financials
- 12.1.1.4. SWOT Analysis
- 12.1.2 ABB
- 12.1.2.1. Company Overview
- 12.1.2.2. Products
- 12.1.2.3. Company Financials
- 12.1.2.4. SWOT Analysis
- 12.1.3 Siemens
- 12.1.3.1. Company Overview
- 12.1.3.2. Products
- 12.1.3.3. Company Financials
- 12.1.3.4. SWOT Analysis
- 12.1.4 SAP
- 12.1.4.1. Company Overview
- 12.1.4.2. Products
- 12.1.4.3. Company Financials
- 12.1.4.4. SWOT Analysis
- 12.1.5 Schneider
- 12.1.5.1. Company Overview
- 12.1.5.2. Products
- 12.1.5.3. Company Financials
- 12.1.5.4. SWOT Analysis
- 12.1.6 Emerson
- 12.1.6.1. Company Overview
- 12.1.6.2. Products
- 12.1.6.3. Company Financials
- 12.1.6.4. SWOT Analysis
- 12.1.7 Oracle
- 12.1.7.1. Company Overview
- 12.1.7.2. Products
- 12.1.7.3. Company Financials
- 12.1.7.4. SWOT Analysis
- 12.1.8 IBM
- 12.1.8.1. Company Overview
- 12.1.8.2. Products
- 12.1.8.3. Company Financials
- 12.1.8.4. SWOT Analysis
- 12.1.9 Honeywell
- 12.1.9.1. Company Overview
- 12.1.9.2. Products
- 12.1.9.3. Company Financials
- 12.1.9.4. SWOT Analysis
- 12.1.10 Cisco
- 12.1.10.1. Company Overview
- 12.1.10.2. Products
- 12.1.10.3. Company Financials
- 12.1.10.4. SWOT Analysis
- 12.1.11 Rockwell
- 12.1.11.1. Company Overview
- 12.1.11.2. Products
- 12.1.11.3. Company Financials
- 12.1.11.4. SWOT Analysis
- 12.1.12 Yokogawa
- 12.1.12.1. Company Overview
- 12.1.12.2. Products
- 12.1.12.3. Company Financials
- 12.1.12.4. SWOT Analysis
- 12.1.13 Fanuc
- 12.1.13.1. Company Overview
- 12.1.13.2. Products
- 12.1.13.3. Company Financials
- 12.1.13.4. SWOT Analysis
- 12.1.14 NVIDIA
- 12.1.14.1. Company Overview
- 12.1.14.2. Products
- 12.1.14.3. Company Financials
- 12.1.14.4. SWOT Analysis
- 12.1.15 Keyence
- 12.1.15.1. Company Overview
- 12.1.15.2. Products
- 12.1.15.3. Company Financials
- 12.1.15.4. SWOT Analysis
- 12.1.16 Cognex
- 12.1.16.1. Company Overview
- 12.1.16.2. Products
- 12.1.16.3. Company Financials
- 12.1.16.4. SWOT Analysis
- 12.1.17 Stratatys
- 12.1.17.1. Company Overview
- 12.1.17.2. Products
- 12.1.17.3. Company Financials
- 12.1.17.4. SWOT Analysis
- 12.1.18 3D Systems
- 12.1.18.1. Company Overview
- 12.1.18.2. Products
- 12.1.18.3. Company Financials
- 12.1.18.4. SWOT Analysis
- 12.1.19 Daifuku
- 12.1.19.1. Company Overview
- 12.1.19.2. Products
- 12.1.19.3. Company Financials
- 12.1.19.4. SWOT Analysis
- 12.1.1 GE
- 12.2. Market Entropy
- 12.2.1 Company's Key Areas Served
- 12.2.2 Recent Developments
- 12.3. Company Market Share Analysis 2025
- 12.3.1 Top 5 Companies Market Share Analysis
- 12.3.2 Top 3 Companies Market Share Analysis
- 12.4. List of Potential Customers
- 13. Research Methodology
List of Figures
- Figure 1: Global Smart Manufacturing Revenue Breakdown (million, %) by Region 2025 & 2033
- Figure 2: North America Smart Manufacturing Revenue (million), by Component 2025 & 2033
- Figure 3: North America Smart Manufacturing Revenue Share (%), by Component 2025 & 2033
- Figure 4: North America Smart Manufacturing Revenue (million), by Manufacturing Process 2025 & 2033
- Figure 5: North America Smart Manufacturing Revenue Share (%), by Manufacturing Process 2025 & 2033
- Figure 6: North America Smart Manufacturing Revenue (million), by Enterprise Size 2025 & 2033
- Figure 7: North America Smart Manufacturing Revenue Share (%), by Enterprise Size 2025 & 2033
- Figure 8: North America Smart Manufacturing Revenue (million), by End User Industry 2025 & 2033
- Figure 9: North America Smart Manufacturing Revenue Share (%), by End User Industry 2025 & 2033
- Figure 10: North America Smart Manufacturing Revenue (million), by Country 2025 & 2033
- Figure 11: North America Smart Manufacturing Revenue Share (%), by Country 2025 & 2033
- Figure 12: South America Smart Manufacturing Revenue (million), by Component 2025 & 2033
- Figure 13: South America Smart Manufacturing Revenue Share (%), by Component 2025 & 2033
- Figure 14: South America Smart Manufacturing Revenue (million), by Manufacturing Process 2025 & 2033
- Figure 15: South America Smart Manufacturing Revenue Share (%), by Manufacturing Process 2025 & 2033
- Figure 16: South America Smart Manufacturing Revenue (million), by Enterprise Size 2025 & 2033
- Figure 17: South America Smart Manufacturing Revenue Share (%), by Enterprise Size 2025 & 2033
- Figure 18: South America Smart Manufacturing Revenue (million), by End User Industry 2025 & 2033
- Figure 19: South America Smart Manufacturing Revenue Share (%), by End User Industry 2025 & 2033
- Figure 20: South America Smart Manufacturing Revenue (million), by Country 2025 & 2033
- Figure 21: South America Smart Manufacturing Revenue Share (%), by Country 2025 & 2033
- Figure 22: Europe Smart Manufacturing Revenue (million), by Component 2025 & 2033
- Figure 23: Europe Smart Manufacturing Revenue Share (%), by Component 2025 & 2033
- Figure 24: Europe Smart Manufacturing Revenue (million), by Manufacturing Process 2025 & 2033
- Figure 25: Europe Smart Manufacturing Revenue Share (%), by Manufacturing Process 2025 & 2033
- Figure 26: Europe Smart Manufacturing Revenue (million), by Enterprise Size 2025 & 2033
- Figure 27: Europe Smart Manufacturing Revenue Share (%), by Enterprise Size 2025 & 2033
- Figure 28: Europe Smart Manufacturing Revenue (million), by End User Industry 2025 & 2033
- Figure 29: Europe Smart Manufacturing Revenue Share (%), by End User Industry 2025 & 2033
- Figure 30: Europe Smart Manufacturing Revenue (million), by Country 2025 & 2033
- Figure 31: Europe Smart Manufacturing Revenue Share (%), by Country 2025 & 2033
- Figure 32: Middle East & Africa Smart Manufacturing Revenue (million), by Component 2025 & 2033
- Figure 33: Middle East & Africa Smart Manufacturing Revenue Share (%), by Component 2025 & 2033
- Figure 34: Middle East & Africa Smart Manufacturing Revenue (million), by Manufacturing Process 2025 & 2033
- Figure 35: Middle East & Africa Smart Manufacturing Revenue Share (%), by Manufacturing Process 2025 & 2033
- Figure 36: Middle East & Africa Smart Manufacturing Revenue (million), by Enterprise Size 2025 & 2033
- Figure 37: Middle East & Africa Smart Manufacturing Revenue Share (%), by Enterprise Size 2025 & 2033
- Figure 38: Middle East & Africa Smart Manufacturing Revenue (million), by End User Industry 2025 & 2033
- Figure 39: Middle East & Africa Smart Manufacturing Revenue Share (%), by End User Industry 2025 & 2033
- Figure 40: Middle East & Africa Smart Manufacturing Revenue (million), by Country 2025 & 2033
- Figure 41: Middle East & Africa Smart Manufacturing Revenue Share (%), by Country 2025 & 2033
- Figure 42: Asia Pacific Smart Manufacturing Revenue (million), by Component 2025 & 2033
- Figure 43: Asia Pacific Smart Manufacturing Revenue Share (%), by Component 2025 & 2033
- Figure 44: Asia Pacific Smart Manufacturing Revenue (million), by Manufacturing Process 2025 & 2033
- Figure 45: Asia Pacific Smart Manufacturing Revenue Share (%), by Manufacturing Process 2025 & 2033
- Figure 46: Asia Pacific Smart Manufacturing Revenue (million), by Enterprise Size 2025 & 2033
- Figure 47: Asia Pacific Smart Manufacturing Revenue Share (%), by Enterprise Size 2025 & 2033
- Figure 48: Asia Pacific Smart Manufacturing Revenue (million), by End User Industry 2025 & 2033
- Figure 49: Asia Pacific Smart Manufacturing Revenue Share (%), by End User Industry 2025 & 2033
- Figure 50: Asia Pacific Smart Manufacturing Revenue (million), by Country 2025 & 2033
- Figure 51: Asia Pacific Smart Manufacturing Revenue Share (%), by Country 2025 & 2033
List of Tables
- Table 1: Global Smart Manufacturing Revenue million Forecast, by Component 2020 & 2033
- Table 2: Global Smart Manufacturing Revenue million Forecast, by Manufacturing Process 2020 & 2033
- Table 3: Global Smart Manufacturing Revenue million Forecast, by Enterprise Size 2020 & 2033
- Table 4: Global Smart Manufacturing Revenue million Forecast, by End User Industry 2020 & 2033
- Table 5: Global Smart Manufacturing Revenue million Forecast, by Region 2020 & 2033
- Table 6: Global Smart Manufacturing Revenue million Forecast, by Component 2020 & 2033
- Table 7: Global Smart Manufacturing Revenue million Forecast, by Manufacturing Process 2020 & 2033
- Table 8: Global Smart Manufacturing Revenue million Forecast, by Enterprise Size 2020 & 2033
- Table 9: Global Smart Manufacturing Revenue million Forecast, by End User Industry 2020 & 2033
- Table 10: Global Smart Manufacturing Revenue million Forecast, by Country 2020 & 2033
- Table 11: United States Smart Manufacturing Revenue (million) Forecast, by Application 2020 & 2033
- Table 12: Canada Smart Manufacturing Revenue (million) Forecast, by Application 2020 & 2033
- Table 13: Mexico Smart Manufacturing Revenue (million) Forecast, by Application 2020 & 2033
- Table 14: Global Smart Manufacturing Revenue million Forecast, by Component 2020 & 2033
- Table 15: Global Smart Manufacturing Revenue million Forecast, by Manufacturing Process 2020 & 2033
- Table 16: Global Smart Manufacturing Revenue million Forecast, by Enterprise Size 2020 & 2033
- Table 17: Global Smart Manufacturing Revenue million Forecast, by End User Industry 2020 & 2033
- Table 18: Global Smart Manufacturing Revenue million Forecast, by Country 2020 & 2033
- Table 19: Brazil Smart Manufacturing Revenue (million) Forecast, by Application 2020 & 2033
- Table 20: Argentina Smart Manufacturing Revenue (million) Forecast, by Application 2020 & 2033
- Table 21: Rest of South America Smart Manufacturing Revenue (million) Forecast, by Application 2020 & 2033
- Table 22: Global Smart Manufacturing Revenue million Forecast, by Component 2020 & 2033
- Table 23: Global Smart Manufacturing Revenue million Forecast, by Manufacturing Process 2020 & 2033
- Table 24: Global Smart Manufacturing Revenue million Forecast, by Enterprise Size 2020 & 2033
- Table 25: Global Smart Manufacturing Revenue million Forecast, by End User Industry 2020 & 2033
- Table 26: Global Smart Manufacturing Revenue million Forecast, by Country 2020 & 2033
- Table 27: United Kingdom Smart Manufacturing Revenue (million) Forecast, by Application 2020 & 2033
- Table 28: Germany Smart Manufacturing Revenue (million) Forecast, by Application 2020 & 2033
- Table 29: France Smart Manufacturing Revenue (million) Forecast, by Application 2020 & 2033
- Table 30: Italy Smart Manufacturing Revenue (million) Forecast, by Application 2020 & 2033
- Table 31: Spain Smart Manufacturing Revenue (million) Forecast, by Application 2020 & 2033
- Table 32: Russia Smart Manufacturing Revenue (million) Forecast, by Application 2020 & 2033
- Table 33: Benelux Smart Manufacturing Revenue (million) Forecast, by Application 2020 & 2033
- Table 34: Nordics Smart Manufacturing Revenue (million) Forecast, by Application 2020 & 2033
- Table 35: Rest of Europe Smart Manufacturing Revenue (million) Forecast, by Application 2020 & 2033
- Table 36: Global Smart Manufacturing Revenue million Forecast, by Component 2020 & 2033
- Table 37: Global Smart Manufacturing Revenue million Forecast, by Manufacturing Process 2020 & 2033
- Table 38: Global Smart Manufacturing Revenue million Forecast, by Enterprise Size 2020 & 2033
- Table 39: Global Smart Manufacturing Revenue million Forecast, by End User Industry 2020 & 2033
- Table 40: Global Smart Manufacturing Revenue million Forecast, by Country 2020 & 2033
- Table 41: Turkey Smart Manufacturing Revenue (million) Forecast, by Application 2020 & 2033
- Table 42: Israel Smart Manufacturing Revenue (million) Forecast, by Application 2020 & 2033
- Table 43: GCC Smart Manufacturing Revenue (million) Forecast, by Application 2020 & 2033
- Table 44: North Africa Smart Manufacturing Revenue (million) Forecast, by Application 2020 & 2033
- Table 45: South Africa Smart Manufacturing Revenue (million) Forecast, by Application 2020 & 2033
- Table 46: Rest of Middle East & Africa Smart Manufacturing Revenue (million) Forecast, by Application 2020 & 2033
- Table 47: Global Smart Manufacturing Revenue million Forecast, by Component 2020 & 2033
- Table 48: Global Smart Manufacturing Revenue million Forecast, by Manufacturing Process 2020 & 2033
- Table 49: Global Smart Manufacturing Revenue million Forecast, by Enterprise Size 2020 & 2033
- Table 50: Global Smart Manufacturing Revenue million Forecast, by End User Industry 2020 & 2033
- Table 51: Global Smart Manufacturing Revenue million Forecast, by Country 2020 & 2033
- Table 52: China Smart Manufacturing Revenue (million) Forecast, by Application 2020 & 2033
- Table 53: India Smart Manufacturing Revenue (million) Forecast, by Application 2020 & 2033
- Table 54: Japan Smart Manufacturing Revenue (million) Forecast, by Application 2020 & 2033
- Table 55: South Korea Smart Manufacturing Revenue (million) Forecast, by Application 2020 & 2033
- Table 56: ASEAN Smart Manufacturing Revenue (million) Forecast, by Application 2020 & 2033
- Table 57: Oceania Smart Manufacturing Revenue (million) Forecast, by Application 2020 & 2033
- Table 58: Rest of Asia Pacific Smart Manufacturing Revenue (million) Forecast, by Application 2020 & 2033
Frequently Asked Questions
1. What is the projected Compound Annual Growth Rate (CAGR) of the Smart Manufacturing?
The projected CAGR is approximately 9.9%.
2. Which companies are prominent players in the Smart Manufacturing?
Key companies in the market include GE, ABB, Siemens, SAP, Schneider, Emerson, Oracle, IBM, Honeywell, Cisco, Rockwell, Yokogawa, Fanuc, NVIDIA, Keyence, Cognex, Stratatys, 3D Systems, Daifuku.
3. What are the main segments of the Smart Manufacturing?
The market segments include Component, Manufacturing Process, Enterprise Size, End User Industry.
4. Can you provide details about the market size?
The market size is estimated to be USD 471040 million as of 2022.
5. What are some drivers contributing to market growth?
N/A
6. What are the notable trends driving market growth?
N/A
7. Are there any restraints impacting market growth?
N/A
8. Can you provide examples of recent developments in the market?
N/A
9. What pricing options are available for accessing the report?
Pricing options include single-user, multi-user, and enterprise licenses priced at USD 2900.00, USD 4350.00, and USD 5800.00 respectively.
10. Is the market size provided in terms of value or volume?
The market size is provided in terms of value, measured in million.
11. Are there any specific market keywords associated with the report?
Yes, the market keyword associated with the report is "Smart Manufacturing," which aids in identifying and referencing the specific market segment covered.
12. How do I determine which pricing option suits my needs best?
The pricing options vary based on user requirements and access needs. Individual users may opt for single-user licenses, while businesses requiring broader access may choose multi-user or enterprise licenses for cost-effective access to the report.
13. Are there any additional resources or data provided in the Smart Manufacturing report?
While the report offers comprehensive insights, it's advisable to review the specific contents or supplementary materials provided to ascertain if additional resources or data are available.
14. How can I stay updated on further developments or reports in the Smart Manufacturing?
To stay informed about further developments, trends, and reports in the Smart Manufacturing, consider subscribing to industry newsletters, following relevant companies and organizations, or regularly checking reputable industry news sources and publications.
Methodology
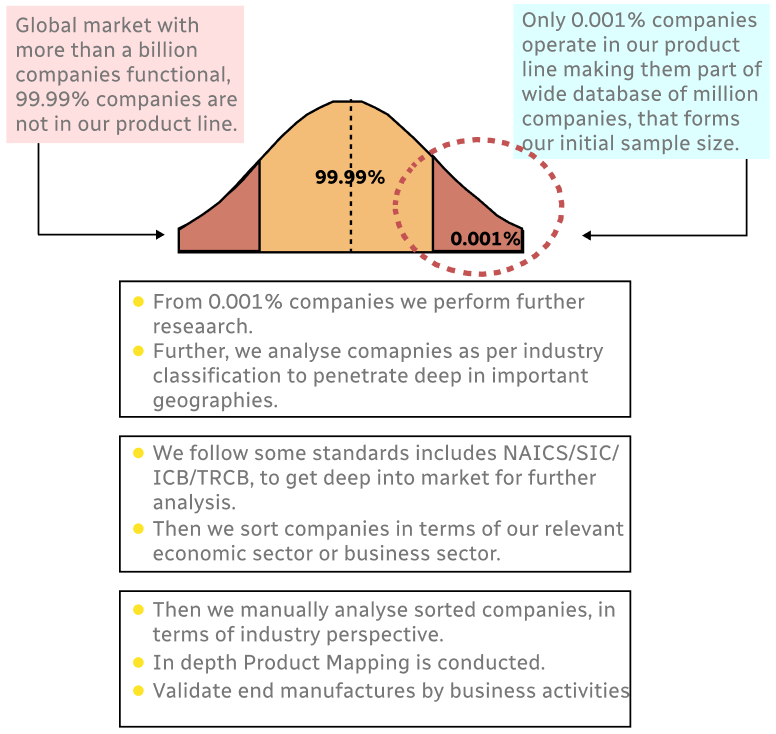
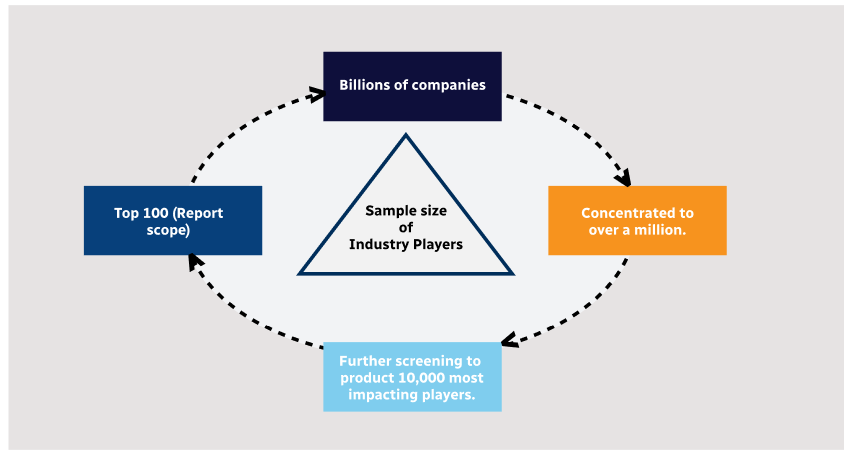
Step 1 - Identification of Relevant Samples Size from Population Database
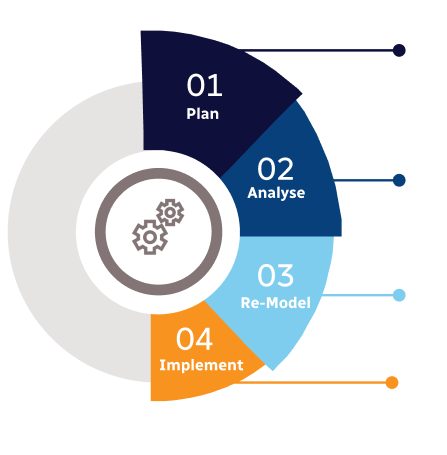
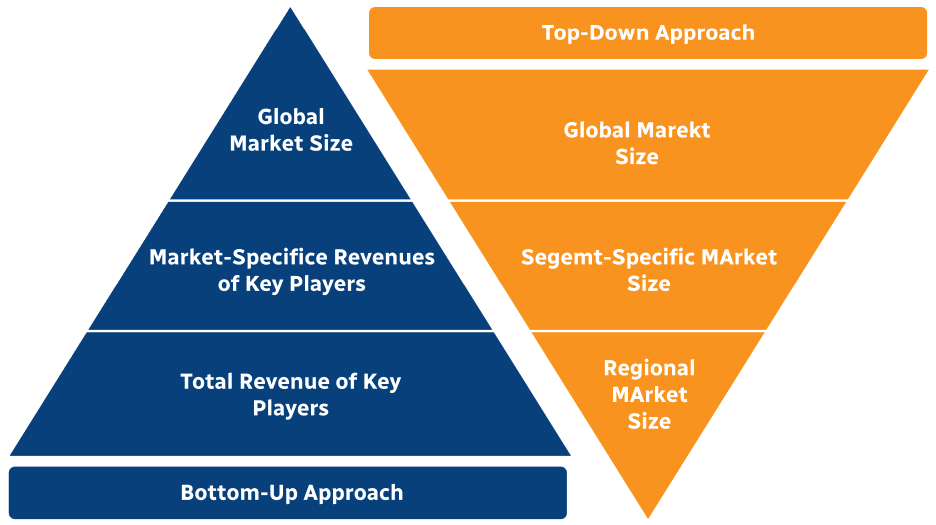
Step 2 - Approaches for Defining Global Market Size (Value, Volume* & Price*)
Note*: In applicable scenarios
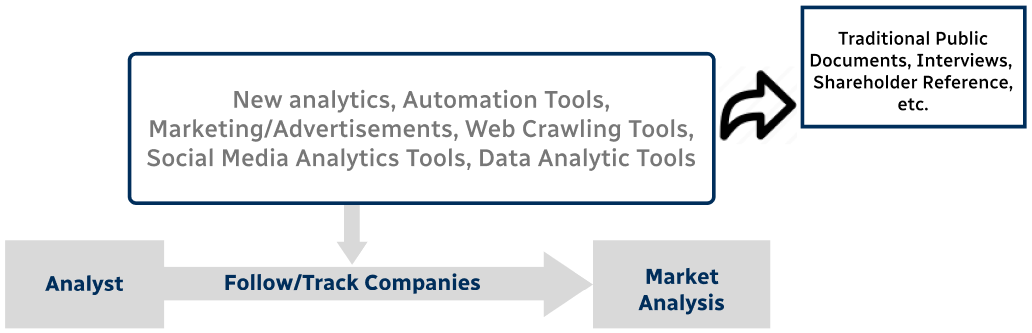
Step 3 - Data Sources
Primary Research
- Web Analytics
- Survey Reports
- Research Institute
- Latest Research Reports
- Opinion Leaders
Secondary Research
- Annual Reports
- White Paper
- Latest Press Release
- Industry Association
- Paid Database
- Investor Presentations
Step 4 - Data Triangulation
Involves using different sources of information in order to increase the validity of a study
These sources are likely to be stakeholders in a program - participants, other researchers, program staff, other community members, and so on.
Then we put all data in single framework & apply various statistical tools to find out the dynamic on the market.
During the analysis stage, feedback from the stakeholder groups would be compared to determine areas of agreement as well as areas of divergence