
Key Insights
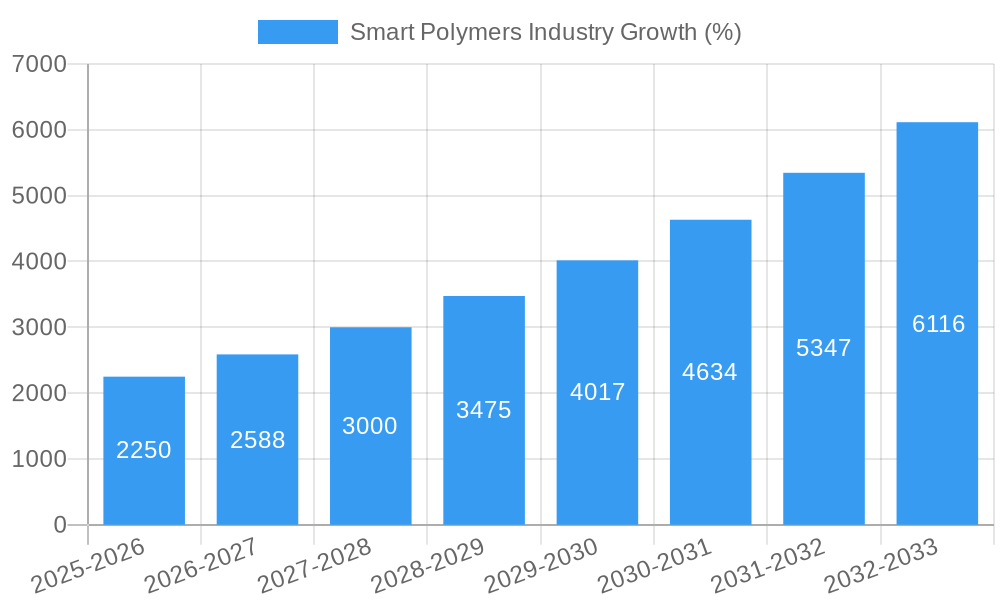
The smart polymers market is experiencing robust growth, driven by increasing demand across diverse sectors. A compound annual growth rate (CAGR) exceeding 15% indicates a significant expansion from 2019 to 2033. This surge is fueled by several key factors. Firstly, the biomedical and healthcare sectors are adopting smart polymers extensively for drug delivery systems, tissue engineering, and advanced prosthetics, leveraging their responsiveness to stimuli like pH changes or enzymes. The electrical and electronics industries are integrating these materials into flexible displays, sensors, and actuators, benefiting from their unique properties. Moreover, the automotive sector is exploring their potential for lightweight, self-healing components, enhancing vehicle durability and fuel efficiency. The textile industry is also incorporating smart polymers for creating innovative fabrics with enhanced functionalities such as temperature regulation and stain resistance. Technological advancements in polymer synthesis and characterization are further accelerating market growth. While supply chain constraints and the high initial cost of production could pose some restraints, ongoing research and development efforts focusing on cost-effective manufacturing techniques are mitigating these challenges. The market segmentation reveals significant potential within electroactive and magnetically-responsive polymers, especially in biomedical applications. The Asia-Pacific region, particularly China and India, is expected to lead the market expansion due to growing investments in R&D and increasing manufacturing capabilities.
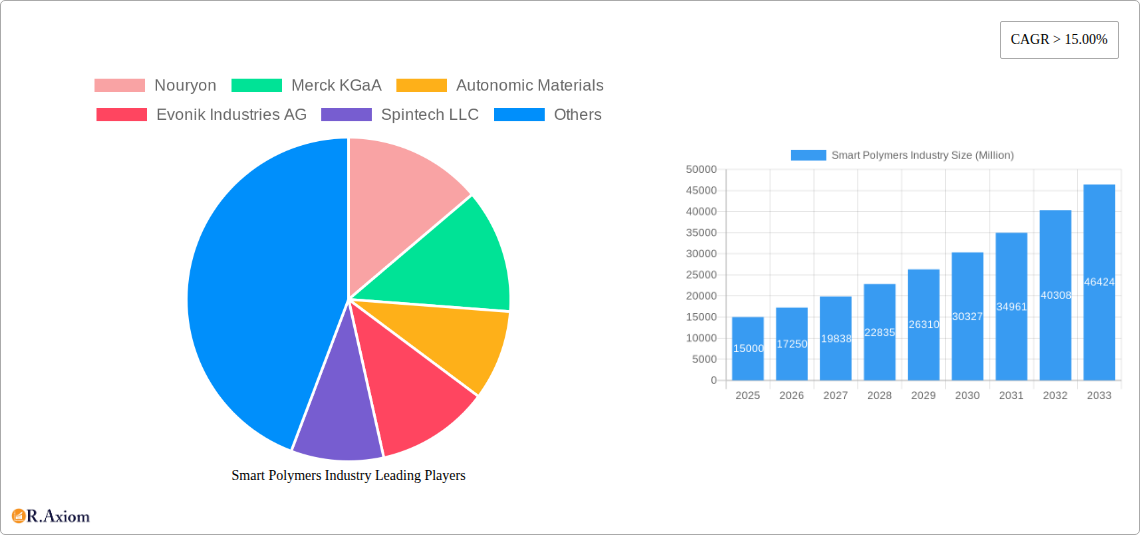
The competitive landscape is marked by both established chemical giants like Nouryon, Merck KGaA, and Evonik Industries AG, and specialized companies like Autonomic Materials and SMP Technologies Inc. This competitive dynamic fosters innovation and facilitates the development of advanced smart polymer materials with improved performance characteristics. Continued research into self-healing polymers and biologically responsive materials holds immense promise, with potential applications expanding beyond the currently identified sectors. Government regulations and initiatives supporting sustainable materials are further creating a favorable environment for the growth of this technologically advanced and rapidly evolving market. The market size in 2025 is estimated based on the provided CAGR and historical data, allowing for a realistic projection of future market values.
This detailed report provides a comprehensive analysis of the Smart Polymers industry, offering valuable insights for stakeholders, investors, and industry professionals. The study period spans from 2019 to 2033, with 2025 serving as the base and estimated year. The report leverages extensive market research, data analysis, and expert insights to deliver actionable intelligence across various segments and geographies. The total market value is projected to reach xx Million by 2033.
Smart Polymers Industry Market Concentration & Innovation
The Smart Polymers industry exhibits a moderately concentrated market structure, with key players such as Nouryon, Merck KGaA, Evonik Industries AG, and DuPont holding significant market shares. Precise market share figures are unavailable, but estimates suggest a top 5 market concentration of approximately 60%. The industry is characterized by intense competition and a continuous drive for innovation, fueled by advancements in materials science, nanotechnology, and biotechnology. Several key factors are driving this innovation:
- Regulatory Frameworks: Stringent environmental regulations and increasing demand for sustainable materials are pushing innovation towards biodegradable and eco-friendly smart polymers.
- Product Substitutes: The emergence of novel materials and alternative technologies presents a challenge, stimulating research into improved performance and cost-effectiveness.
- End-User Trends: Growing demand from sectors like biomedical, automotive, and electronics is fostering innovation in tailored polymer solutions.
- Mergers & Acquisitions (M&A): Recent M&A activities, such as Evonik's acquisition of JeNaCell (August 2021), highlight the industry's dynamic nature and consolidation trends. The deal value of such transactions varies significantly, ranging from xx Million to xx Million depending on the size and strategic importance of the target company.
Smart Polymers Industry Industry Trends & Insights
The Smart Polymers market is experiencing robust growth, with a projected Compound Annual Growth Rate (CAGR) of xx% during the forecast period (2025-2033). Several factors contribute to this growth trajectory:
The market's expansion is fueled by the increasing demand for advanced materials across diverse sectors. Technological advancements in polymer synthesis and modification are crucial for developing new functionalities and enhanced performance. The consumer preference for sustainable and eco-friendly materials is driving the development of biodegradable and recyclable smart polymers. Competitive dynamics remain intense, with companies investing heavily in R&D to maintain their market position. Market penetration varies greatly across different end-use segments. Biomedical applications show high penetration due to their high value and critical nature, while other sectors lag due to higher cost barriers and adoption challenges.
Dominant Markets & Segments in Smart Polymers Industry
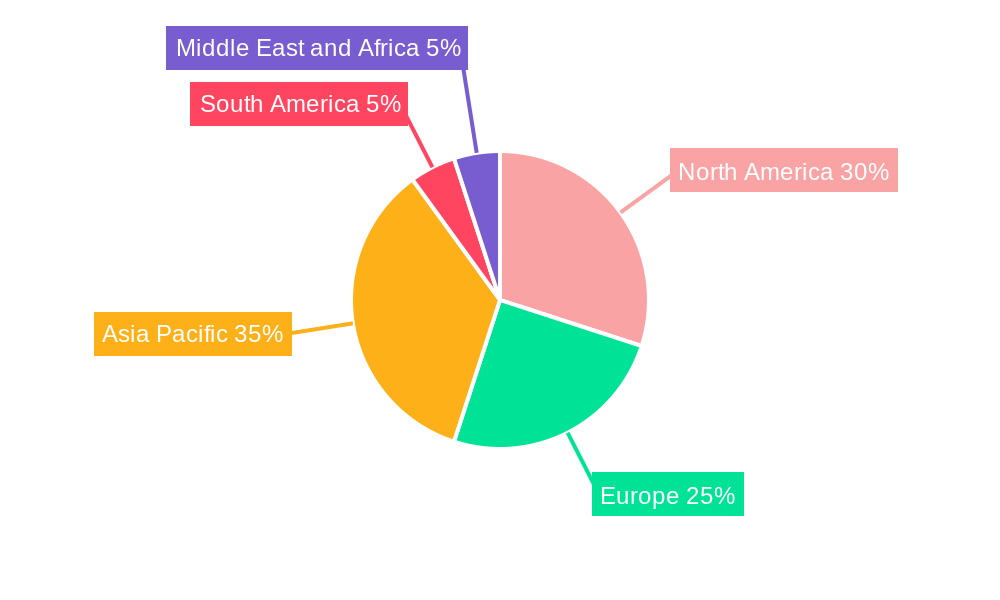
The North American region currently holds a dominant position in the Smart Polymers market, followed by Europe and Asia-Pacific. This dominance is largely due to:
- Advanced infrastructure: North America's robust infrastructure and research capabilities support innovation and manufacturing.
- High technological adoption: This region's propensity for embracing new technologies facilitates rapid commercialization.
- Favorable regulatory environment: Supportive government policies and regulations encourage investment.
Among segments, the Biomedical and Healthcare end-user industry demonstrates the strongest growth, driven by the increasing demand for advanced drug delivery systems, biosensors, and implantable devices. Within polymer types, Self-healing Polymers show high growth potential due to their ability to extend the lifespan of products and reduce maintenance costs. The Chemical Stimuli-responsive segment also exhibits significant growth, finding applications in various industrial and consumer products.
- Key Drivers for Biomedical and Healthcare: High R&D investment, government funding for medical technologies, increasing healthcare expenditure.
- Key Drivers for Electrical and Electronics: Demand for miniaturization, improved performance, and flexible electronics.
- Key Drivers for Automotive: Demand for lightweighting, enhanced safety, and improved fuel efficiency.
- Key Drivers for Self-Healing Polymers: Enhanced product durability, reduced maintenance costs, and extended lifespan.
Smart Polymers Industry Product Developments
Recent product innovations in the Smart Polymers industry focus on enhancing functionalities such as improved biocompatibility, conductivity, and responsiveness to various stimuli. Technological trends include the development of stimuli-responsive hydrogels, conductive polymers, and self-healing materials with enhanced mechanical properties. These innovations are driving market expansion by enabling the creation of novel products across multiple industries, catering to growing consumer demand for high-performance and sustainable solutions.
Report Scope & Segmentation Analysis
This report provides a granular segmentation of the Smart Polymers market, analyzing various aspects:
- By Type: Physical Stimuli-responsive, Chemical Stimuli-responsive, Biological Stimuli-responsive, pH-responsive, Enzymes-responsive, Electroactive and Magnetically-Responsive Polymers, Other Types
- By End-User Industry: Biomedical and Healthcare, Electrical and Electronics, Textile, Automotive, Other End-user Industries.
Each segment is analyzed in detail, providing insights into market size, growth projections, and competitive dynamics. Growth rates vary significantly depending on factors such as technological advancements and specific market needs. The Biomedical and Healthcare sector shows the fastest growth, while the Automotive sector is expected to witness substantial expansion.
Key Drivers of Smart Polymers Industry Growth
The Smart Polymers market growth is driven by several factors:
- Technological Advancements: Innovations in polymer synthesis, modification, and characterization techniques are leading to the development of new materials with enhanced properties.
- Increasing Demand: Growing demand from diverse end-user industries like biomedical, automotive, and electronics fuels market expansion.
- Government Support: Government initiatives and policies promoting sustainable materials and technological innovation are boosting market growth.
Challenges in the Smart Polymers Industry Sector
Challenges faced by the industry include:
- High Production Costs: The synthesis and processing of smart polymers can be complex and expensive, limiting market penetration.
- Supply Chain Disruptions: Global supply chain vulnerabilities affect the availability of raw materials and intermediate products.
- Regulatory Hurdles: Stringent regulatory requirements for specific applications, especially in the biomedical sector, pose hurdles.
Emerging Opportunities in Smart Polymers Industry
Emerging opportunities include:
- New Applications: Expansion into new applications such as flexible electronics, wearable sensors, and advanced drug delivery systems.
- Sustainable Materials: Development of biodegradable and eco-friendly smart polymers to meet sustainability goals.
- Market Expansion: Penetration into developing economies with growing demand for advanced materials.
Leading Players in the Smart Polymers Industry Market
- Nouryon
- Merck KGaA
- Autonomic Materials
- Evonik Industries AG
- Spintech LLC
- Huntsman International LLC
- DuPont
- The Lubrizol Corporation
- Covestro AG
- SMP Technologies Inc
- TNO
Key Developments in Smart Polymers Industry Industry
- August 2021: Evonik acquired the German biotech company JeNaCell, expanding its biomaterials portfolio.
- March 2021: Nouryon launched LumaTreat, a new smart-tagged polymer line for water management.
Strategic Outlook for Smart Polymers Industry Market
The Smart Polymers market is poised for continued growth, driven by technological advancements, increasing demand across various sectors, and supportive government policies. The focus on sustainable and eco-friendly materials will further propel market expansion. Opportunities exist in developing novel applications and expanding into new geographical markets. Companies that invest in R&D, adopt sustainable practices, and build strong supply chains are well-positioned to capitalize on the future growth potential.
Smart Polymers Industry Segmentation
-
1. Type
- 1.1. Physical Stimuli-responsive
- 1.2. Chemical Stimuli-responsive
- 1.3. Biological Stimuli-responsive
- 1.4. Self-healing Polymers
- 1.5. Other Types (Thermally Responsive, Etc.)
-
2. End-user Industry
- 2.1. Biomedical and Healthcare
- 2.2. Electrical and Electronics
- 2.3. Textile
- 2.4. Automotive
- 2.5. Other End-user Industries (Agriculture, Etc.)
Smart Polymers Industry Segmentation By Geography
-
1. Asia Pacific
- 1.1. China
- 1.2. India
- 1.3. Japan
- 1.4. South Korea
- 1.5. Rest of Asia Pacific
-
2. North America
- 2.1. United States
- 2.2. Canada
- 2.3. Mexico
-
3. Europe
- 3.1. Germany
- 3.2. United Kingdom
- 3.3. Italy
- 3.4. France
- 3.5. Rest of Europe
-
4. South America
- 4.1. Brazil
- 4.2. Argentina
- 4.3. Rest of South America
-
5. Middle East and Africa
- 5.1. Saudi Arabia
- 5.2. South Africa
- 5.3. Rest of Middle East and Africa
Smart Polymers Industry REPORT HIGHLIGHTS
| Aspects | Details |
|---|---|
| Study Period | 2019-2033 |
| Base Year | 2024 |
| Estimated Year | 2025 |
| Forecast Period | 2025-2033 |
| Historical Period | 2019-2024 |
| Growth Rate | CAGR of > 15.00% from 2019-2033 |
| Segmentation |
|
Table of Contents
- 1. Introduction
- 1.1. Research Scope
- 1.2. Market Segmentation
- 1.3. Research Methodology
- 1.4. Definitions and Assumptions
- 2. Executive Summary
- 2.1. Introduction
- 3. Market Dynamics
- 3.1. Introduction
- 3.2. Market Drivers
- 3.2.1. Increasing Application of Shape Memory Polymer in Textile Industry; Increasing Need for Efficient Drug Delivery System; Development of Smart Biopolymers
- 3.3. Market Restrains
- 3.3.1. High Cost of Technology and Development of Smart Polymers; Other Restraints
- 3.4. Market Trends
- 3.4.1. Biomedical and Healthcare to Dominate the Market
- 4. Market Factor Analysis
- 4.1. Porters Five Forces
- 4.2. Supply/Value Chain
- 4.3. PESTEL analysis
- 4.4. Market Entropy
- 4.5. Patent/Trademark Analysis
- 5. Global Smart Polymers Industry Analysis, Insights and Forecast, 2019-2031
- 5.1. Market Analysis, Insights and Forecast - by Type
- 5.1.1. Physical Stimuli-responsive
- 5.1.2. Chemical Stimuli-responsive
- 5.1.3. Biological Stimuli-responsive
- 5.1.4. Self-healing Polymers
- 5.1.5. Other Types (Thermally Responsive, Etc.)
- 5.2. Market Analysis, Insights and Forecast - by End-user Industry
- 5.2.1. Biomedical and Healthcare
- 5.2.2. Electrical and Electronics
- 5.2.3. Textile
- 5.2.4. Automotive
- 5.2.5. Other End-user Industries (Agriculture, Etc.)
- 5.3. Market Analysis, Insights and Forecast - by Region
- 5.3.1. Asia Pacific
- 5.3.2. North America
- 5.3.3. Europe
- 5.3.4. South America
- 5.3.5. Middle East and Africa
- 5.1. Market Analysis, Insights and Forecast - by Type
- 6. Asia Pacific Smart Polymers Industry Analysis, Insights and Forecast, 2019-2031
- 6.1. Market Analysis, Insights and Forecast - by Type
- 6.1.1. Physical Stimuli-responsive
- 6.1.2. Chemical Stimuli-responsive
- 6.1.3. Biological Stimuli-responsive
- 6.1.4. Self-healing Polymers
- 6.1.5. Other Types (Thermally Responsive, Etc.)
- 6.2. Market Analysis, Insights and Forecast - by End-user Industry
- 6.2.1. Biomedical and Healthcare
- 6.2.2. Electrical and Electronics
- 6.2.3. Textile
- 6.2.4. Automotive
- 6.2.5. Other End-user Industries (Agriculture, Etc.)
- 6.1. Market Analysis, Insights and Forecast - by Type
- 7. North America Smart Polymers Industry Analysis, Insights and Forecast, 2019-2031
- 7.1. Market Analysis, Insights and Forecast - by Type
- 7.1.1. Physical Stimuli-responsive
- 7.1.2. Chemical Stimuli-responsive
- 7.1.3. Biological Stimuli-responsive
- 7.1.4. Self-healing Polymers
- 7.1.5. Other Types (Thermally Responsive, Etc.)
- 7.2. Market Analysis, Insights and Forecast - by End-user Industry
- 7.2.1. Biomedical and Healthcare
- 7.2.2. Electrical and Electronics
- 7.2.3. Textile
- 7.2.4. Automotive
- 7.2.5. Other End-user Industries (Agriculture, Etc.)
- 7.1. Market Analysis, Insights and Forecast - by Type
- 8. Europe Smart Polymers Industry Analysis, Insights and Forecast, 2019-2031
- 8.1. Market Analysis, Insights and Forecast - by Type
- 8.1.1. Physical Stimuli-responsive
- 8.1.2. Chemical Stimuli-responsive
- 8.1.3. Biological Stimuli-responsive
- 8.1.4. Self-healing Polymers
- 8.1.5. Other Types (Thermally Responsive, Etc.)
- 8.2. Market Analysis, Insights and Forecast - by End-user Industry
- 8.2.1. Biomedical and Healthcare
- 8.2.2. Electrical and Electronics
- 8.2.3. Textile
- 8.2.4. Automotive
- 8.2.5. Other End-user Industries (Agriculture, Etc.)
- 8.1. Market Analysis, Insights and Forecast - by Type
- 9. South America Smart Polymers Industry Analysis, Insights and Forecast, 2019-2031
- 9.1. Market Analysis, Insights and Forecast - by Type
- 9.1.1. Physical Stimuli-responsive
- 9.1.2. Chemical Stimuli-responsive
- 9.1.3. Biological Stimuli-responsive
- 9.1.4. Self-healing Polymers
- 9.1.5. Other Types (Thermally Responsive, Etc.)
- 9.2. Market Analysis, Insights and Forecast - by End-user Industry
- 9.2.1. Biomedical and Healthcare
- 9.2.2. Electrical and Electronics
- 9.2.3. Textile
- 9.2.4. Automotive
- 9.2.5. Other End-user Industries (Agriculture, Etc.)
- 9.1. Market Analysis, Insights and Forecast - by Type
- 10. Middle East and Africa Smart Polymers Industry Analysis, Insights and Forecast, 2019-2031
- 10.1. Market Analysis, Insights and Forecast - by Type
- 10.1.1. Physical Stimuli-responsive
- 10.1.2. Chemical Stimuli-responsive
- 10.1.3. Biological Stimuli-responsive
- 10.1.4. Self-healing Polymers
- 10.1.5. Other Types (Thermally Responsive, Etc.)
- 10.2. Market Analysis, Insights and Forecast - by End-user Industry
- 10.2.1. Biomedical and Healthcare
- 10.2.2. Electrical and Electronics
- 10.2.3. Textile
- 10.2.4. Automotive
- 10.2.5. Other End-user Industries (Agriculture, Etc.)
- 10.1. Market Analysis, Insights and Forecast - by Type
- 11. Asia Pacific Smart Polymers Industry Analysis, Insights and Forecast, 2019-2031
- 11.1. Market Analysis, Insights and Forecast - By Country/Sub-region
- 11.1.1 China
- 11.1.2 India
- 11.1.3 Japan
- 11.1.4 South Korea
- 11.1.5 Rest of Asia Pacific
- 12. North America Smart Polymers Industry Analysis, Insights and Forecast, 2019-2031
- 12.1. Market Analysis, Insights and Forecast - By Country/Sub-region
- 12.1.1 United States
- 12.1.2 Canada
- 12.1.3 Mexico
- 13. Europe Smart Polymers Industry Analysis, Insights and Forecast, 2019-2031
- 13.1. Market Analysis, Insights and Forecast - By Country/Sub-region
- 13.1.1 Germany
- 13.1.2 United Kingdom
- 13.1.3 Italy
- 13.1.4 France
- 13.1.5 Rest of Europe
- 14. South America Smart Polymers Industry Analysis, Insights and Forecast, 2019-2031
- 14.1. Market Analysis, Insights and Forecast - By Country/Sub-region
- 14.1.1 Brazil
- 14.1.2 Argentina
- 14.1.3 Rest of South America
- 15. Middle East and Africa Smart Polymers Industry Analysis, Insights and Forecast, 2019-2031
- 15.1. Market Analysis, Insights and Forecast - By Country/Sub-region
- 15.1.1 Saudi Arabia
- 15.1.2 South Africa
- 15.1.3 Rest of Middle East and Africa
- 16. Competitive Analysis
- 16.1. Global Market Share Analysis 2024
- 16.2. Company Profiles
- 16.2.1 Nouryon
- 16.2.1.1. Overview
- 16.2.1.2. Products
- 16.2.1.3. SWOT Analysis
- 16.2.1.4. Recent Developments
- 16.2.1.5. Financials (Based on Availability)
- 16.2.2 Merck KGaA
- 16.2.2.1. Overview
- 16.2.2.2. Products
- 16.2.2.3. SWOT Analysis
- 16.2.2.4. Recent Developments
- 16.2.2.5. Financials (Based on Availability)
- 16.2.3 Autonomic Materials
- 16.2.3.1. Overview
- 16.2.3.2. Products
- 16.2.3.3. SWOT Analysis
- 16.2.3.4. Recent Developments
- 16.2.3.5. Financials (Based on Availability)
- 16.2.4 Evonik Industries AG
- 16.2.4.1. Overview
- 16.2.4.2. Products
- 16.2.4.3. SWOT Analysis
- 16.2.4.4. Recent Developments
- 16.2.4.5. Financials (Based on Availability)
- 16.2.5 Spintech LLC
- 16.2.5.1. Overview
- 16.2.5.2. Products
- 16.2.5.3. SWOT Analysis
- 16.2.5.4. Recent Developments
- 16.2.5.5. Financials (Based on Availability)
- 16.2.6 Huntsman International LLC
- 16.2.6.1. Overview
- 16.2.6.2. Products
- 16.2.6.3. SWOT Analysis
- 16.2.6.4. Recent Developments
- 16.2.6.5. Financials (Based on Availability)
- 16.2.7 DuPont
- 16.2.7.1. Overview
- 16.2.7.2. Products
- 16.2.7.3. SWOT Analysis
- 16.2.7.4. Recent Developments
- 16.2.7.5. Financials (Based on Availability)
- 16.2.8 The Lubrizol Corporation
- 16.2.8.1. Overview
- 16.2.8.2. Products
- 16.2.8.3. SWOT Analysis
- 16.2.8.4. Recent Developments
- 16.2.8.5. Financials (Based on Availability)
- 16.2.9 Covestro AG
- 16.2.9.1. Overview
- 16.2.9.2. Products
- 16.2.9.3. SWOT Analysis
- 16.2.9.4. Recent Developments
- 16.2.9.5. Financials (Based on Availability)
- 16.2.10 SMP Technologies Inc
- 16.2.10.1. Overview
- 16.2.10.2. Products
- 16.2.10.3. SWOT Analysis
- 16.2.10.4. Recent Developments
- 16.2.10.5. Financials (Based on Availability)
- 16.2.11 TNO
- 16.2.11.1. Overview
- 16.2.11.2. Products
- 16.2.11.3. SWOT Analysis
- 16.2.11.4. Recent Developments
- 16.2.11.5. Financials (Based on Availability)
- 16.2.1 Nouryon
List of Figures
- Figure 1: Global Smart Polymers Industry Revenue Breakdown (Million, %) by Region 2024 & 2032
- Figure 2: Global Smart Polymers Industry Volume Breakdown (K Tons, %) by Region 2024 & 2032
- Figure 3: Asia Pacific Smart Polymers Industry Revenue (Million), by Country 2024 & 2032
- Figure 4: Asia Pacific Smart Polymers Industry Volume (K Tons), by Country 2024 & 2032
- Figure 5: Asia Pacific Smart Polymers Industry Revenue Share (%), by Country 2024 & 2032
- Figure 6: Asia Pacific Smart Polymers Industry Volume Share (%), by Country 2024 & 2032
- Figure 7: North America Smart Polymers Industry Revenue (Million), by Country 2024 & 2032
- Figure 8: North America Smart Polymers Industry Volume (K Tons), by Country 2024 & 2032
- Figure 9: North America Smart Polymers Industry Revenue Share (%), by Country 2024 & 2032
- Figure 10: North America Smart Polymers Industry Volume Share (%), by Country 2024 & 2032
- Figure 11: Europe Smart Polymers Industry Revenue (Million), by Country 2024 & 2032
- Figure 12: Europe Smart Polymers Industry Volume (K Tons), by Country 2024 & 2032
- Figure 13: Europe Smart Polymers Industry Revenue Share (%), by Country 2024 & 2032
- Figure 14: Europe Smart Polymers Industry Volume Share (%), by Country 2024 & 2032
- Figure 15: South America Smart Polymers Industry Revenue (Million), by Country 2024 & 2032
- Figure 16: South America Smart Polymers Industry Volume (K Tons), by Country 2024 & 2032
- Figure 17: South America Smart Polymers Industry Revenue Share (%), by Country 2024 & 2032
- Figure 18: South America Smart Polymers Industry Volume Share (%), by Country 2024 & 2032
- Figure 19: Middle East and Africa Smart Polymers Industry Revenue (Million), by Country 2024 & 2032
- Figure 20: Middle East and Africa Smart Polymers Industry Volume (K Tons), by Country 2024 & 2032
- Figure 21: Middle East and Africa Smart Polymers Industry Revenue Share (%), by Country 2024 & 2032
- Figure 22: Middle East and Africa Smart Polymers Industry Volume Share (%), by Country 2024 & 2032
- Figure 23: Asia Pacific Smart Polymers Industry Revenue (Million), by Type 2024 & 2032
- Figure 24: Asia Pacific Smart Polymers Industry Volume (K Tons), by Type 2024 & 2032
- Figure 25: Asia Pacific Smart Polymers Industry Revenue Share (%), by Type 2024 & 2032
- Figure 26: Asia Pacific Smart Polymers Industry Volume Share (%), by Type 2024 & 2032
- Figure 27: Asia Pacific Smart Polymers Industry Revenue (Million), by End-user Industry 2024 & 2032
- Figure 28: Asia Pacific Smart Polymers Industry Volume (K Tons), by End-user Industry 2024 & 2032
- Figure 29: Asia Pacific Smart Polymers Industry Revenue Share (%), by End-user Industry 2024 & 2032
- Figure 30: Asia Pacific Smart Polymers Industry Volume Share (%), by End-user Industry 2024 & 2032
- Figure 31: Asia Pacific Smart Polymers Industry Revenue (Million), by Country 2024 & 2032
- Figure 32: Asia Pacific Smart Polymers Industry Volume (K Tons), by Country 2024 & 2032
- Figure 33: Asia Pacific Smart Polymers Industry Revenue Share (%), by Country 2024 & 2032
- Figure 34: Asia Pacific Smart Polymers Industry Volume Share (%), by Country 2024 & 2032
- Figure 35: North America Smart Polymers Industry Revenue (Million), by Type 2024 & 2032
- Figure 36: North America Smart Polymers Industry Volume (K Tons), by Type 2024 & 2032
- Figure 37: North America Smart Polymers Industry Revenue Share (%), by Type 2024 & 2032
- Figure 38: North America Smart Polymers Industry Volume Share (%), by Type 2024 & 2032
- Figure 39: North America Smart Polymers Industry Revenue (Million), by End-user Industry 2024 & 2032
- Figure 40: North America Smart Polymers Industry Volume (K Tons), by End-user Industry 2024 & 2032
- Figure 41: North America Smart Polymers Industry Revenue Share (%), by End-user Industry 2024 & 2032
- Figure 42: North America Smart Polymers Industry Volume Share (%), by End-user Industry 2024 & 2032
- Figure 43: North America Smart Polymers Industry Revenue (Million), by Country 2024 & 2032
- Figure 44: North America Smart Polymers Industry Volume (K Tons), by Country 2024 & 2032
- Figure 45: North America Smart Polymers Industry Revenue Share (%), by Country 2024 & 2032
- Figure 46: North America Smart Polymers Industry Volume Share (%), by Country 2024 & 2032
- Figure 47: Europe Smart Polymers Industry Revenue (Million), by Type 2024 & 2032
- Figure 48: Europe Smart Polymers Industry Volume (K Tons), by Type 2024 & 2032
- Figure 49: Europe Smart Polymers Industry Revenue Share (%), by Type 2024 & 2032
- Figure 50: Europe Smart Polymers Industry Volume Share (%), by Type 2024 & 2032
- Figure 51: Europe Smart Polymers Industry Revenue (Million), by End-user Industry 2024 & 2032
- Figure 52: Europe Smart Polymers Industry Volume (K Tons), by End-user Industry 2024 & 2032
- Figure 53: Europe Smart Polymers Industry Revenue Share (%), by End-user Industry 2024 & 2032
- Figure 54: Europe Smart Polymers Industry Volume Share (%), by End-user Industry 2024 & 2032
- Figure 55: Europe Smart Polymers Industry Revenue (Million), by Country 2024 & 2032
- Figure 56: Europe Smart Polymers Industry Volume (K Tons), by Country 2024 & 2032
- Figure 57: Europe Smart Polymers Industry Revenue Share (%), by Country 2024 & 2032
- Figure 58: Europe Smart Polymers Industry Volume Share (%), by Country 2024 & 2032
- Figure 59: South America Smart Polymers Industry Revenue (Million), by Type 2024 & 2032
- Figure 60: South America Smart Polymers Industry Volume (K Tons), by Type 2024 & 2032
- Figure 61: South America Smart Polymers Industry Revenue Share (%), by Type 2024 & 2032
- Figure 62: South America Smart Polymers Industry Volume Share (%), by Type 2024 & 2032
- Figure 63: South America Smart Polymers Industry Revenue (Million), by End-user Industry 2024 & 2032
- Figure 64: South America Smart Polymers Industry Volume (K Tons), by End-user Industry 2024 & 2032
- Figure 65: South America Smart Polymers Industry Revenue Share (%), by End-user Industry 2024 & 2032
- Figure 66: South America Smart Polymers Industry Volume Share (%), by End-user Industry 2024 & 2032
- Figure 67: South America Smart Polymers Industry Revenue (Million), by Country 2024 & 2032
- Figure 68: South America Smart Polymers Industry Volume (K Tons), by Country 2024 & 2032
- Figure 69: South America Smart Polymers Industry Revenue Share (%), by Country 2024 & 2032
- Figure 70: South America Smart Polymers Industry Volume Share (%), by Country 2024 & 2032
- Figure 71: Middle East and Africa Smart Polymers Industry Revenue (Million), by Type 2024 & 2032
- Figure 72: Middle East and Africa Smart Polymers Industry Volume (K Tons), by Type 2024 & 2032
- Figure 73: Middle East and Africa Smart Polymers Industry Revenue Share (%), by Type 2024 & 2032
- Figure 74: Middle East and Africa Smart Polymers Industry Volume Share (%), by Type 2024 & 2032
- Figure 75: Middle East and Africa Smart Polymers Industry Revenue (Million), by End-user Industry 2024 & 2032
- Figure 76: Middle East and Africa Smart Polymers Industry Volume (K Tons), by End-user Industry 2024 & 2032
- Figure 77: Middle East and Africa Smart Polymers Industry Revenue Share (%), by End-user Industry 2024 & 2032
- Figure 78: Middle East and Africa Smart Polymers Industry Volume Share (%), by End-user Industry 2024 & 2032
- Figure 79: Middle East and Africa Smart Polymers Industry Revenue (Million), by Country 2024 & 2032
- Figure 80: Middle East and Africa Smart Polymers Industry Volume (K Tons), by Country 2024 & 2032
- Figure 81: Middle East and Africa Smart Polymers Industry Revenue Share (%), by Country 2024 & 2032
- Figure 82: Middle East and Africa Smart Polymers Industry Volume Share (%), by Country 2024 & 2032
List of Tables
- Table 1: Global Smart Polymers Industry Revenue Million Forecast, by Region 2019 & 2032
- Table 2: Global Smart Polymers Industry Volume K Tons Forecast, by Region 2019 & 2032
- Table 3: Global Smart Polymers Industry Revenue Million Forecast, by Type 2019 & 2032
- Table 4: Global Smart Polymers Industry Volume K Tons Forecast, by Type 2019 & 2032
- Table 5: Global Smart Polymers Industry Revenue Million Forecast, by End-user Industry 2019 & 2032
- Table 6: Global Smart Polymers Industry Volume K Tons Forecast, by End-user Industry 2019 & 2032
- Table 7: Global Smart Polymers Industry Revenue Million Forecast, by Region 2019 & 2032
- Table 8: Global Smart Polymers Industry Volume K Tons Forecast, by Region 2019 & 2032
- Table 9: Global Smart Polymers Industry Revenue Million Forecast, by Country 2019 & 2032
- Table 10: Global Smart Polymers Industry Volume K Tons Forecast, by Country 2019 & 2032
- Table 11: China Smart Polymers Industry Revenue (Million) Forecast, by Application 2019 & 2032
- Table 12: China Smart Polymers Industry Volume (K Tons) Forecast, by Application 2019 & 2032
- Table 13: India Smart Polymers Industry Revenue (Million) Forecast, by Application 2019 & 2032
- Table 14: India Smart Polymers Industry Volume (K Tons) Forecast, by Application 2019 & 2032
- Table 15: Japan Smart Polymers Industry Revenue (Million) Forecast, by Application 2019 & 2032
- Table 16: Japan Smart Polymers Industry Volume (K Tons) Forecast, by Application 2019 & 2032
- Table 17: South Korea Smart Polymers Industry Revenue (Million) Forecast, by Application 2019 & 2032
- Table 18: South Korea Smart Polymers Industry Volume (K Tons) Forecast, by Application 2019 & 2032
- Table 19: Rest of Asia Pacific Smart Polymers Industry Revenue (Million) Forecast, by Application 2019 & 2032
- Table 20: Rest of Asia Pacific Smart Polymers Industry Volume (K Tons) Forecast, by Application 2019 & 2032
- Table 21: Global Smart Polymers Industry Revenue Million Forecast, by Country 2019 & 2032
- Table 22: Global Smart Polymers Industry Volume K Tons Forecast, by Country 2019 & 2032
- Table 23: United States Smart Polymers Industry Revenue (Million) Forecast, by Application 2019 & 2032
- Table 24: United States Smart Polymers Industry Volume (K Tons) Forecast, by Application 2019 & 2032
- Table 25: Canada Smart Polymers Industry Revenue (Million) Forecast, by Application 2019 & 2032
- Table 26: Canada Smart Polymers Industry Volume (K Tons) Forecast, by Application 2019 & 2032
- Table 27: Mexico Smart Polymers Industry Revenue (Million) Forecast, by Application 2019 & 2032
- Table 28: Mexico Smart Polymers Industry Volume (K Tons) Forecast, by Application 2019 & 2032
- Table 29: Global Smart Polymers Industry Revenue Million Forecast, by Country 2019 & 2032
- Table 30: Global Smart Polymers Industry Volume K Tons Forecast, by Country 2019 & 2032
- Table 31: Germany Smart Polymers Industry Revenue (Million) Forecast, by Application 2019 & 2032
- Table 32: Germany Smart Polymers Industry Volume (K Tons) Forecast, by Application 2019 & 2032
- Table 33: United Kingdom Smart Polymers Industry Revenue (Million) Forecast, by Application 2019 & 2032
- Table 34: United Kingdom Smart Polymers Industry Volume (K Tons) Forecast, by Application 2019 & 2032
- Table 35: Italy Smart Polymers Industry Revenue (Million) Forecast, by Application 2019 & 2032
- Table 36: Italy Smart Polymers Industry Volume (K Tons) Forecast, by Application 2019 & 2032
- Table 37: France Smart Polymers Industry Revenue (Million) Forecast, by Application 2019 & 2032
- Table 38: France Smart Polymers Industry Volume (K Tons) Forecast, by Application 2019 & 2032
- Table 39: Rest of Europe Smart Polymers Industry Revenue (Million) Forecast, by Application 2019 & 2032
- Table 40: Rest of Europe Smart Polymers Industry Volume (K Tons) Forecast, by Application 2019 & 2032
- Table 41: Global Smart Polymers Industry Revenue Million Forecast, by Country 2019 & 2032
- Table 42: Global Smart Polymers Industry Volume K Tons Forecast, by Country 2019 & 2032
- Table 43: Brazil Smart Polymers Industry Revenue (Million) Forecast, by Application 2019 & 2032
- Table 44: Brazil Smart Polymers Industry Volume (K Tons) Forecast, by Application 2019 & 2032
- Table 45: Argentina Smart Polymers Industry Revenue (Million) Forecast, by Application 2019 & 2032
- Table 46: Argentina Smart Polymers Industry Volume (K Tons) Forecast, by Application 2019 & 2032
- Table 47: Rest of South America Smart Polymers Industry Revenue (Million) Forecast, by Application 2019 & 2032
- Table 48: Rest of South America Smart Polymers Industry Volume (K Tons) Forecast, by Application 2019 & 2032
- Table 49: Global Smart Polymers Industry Revenue Million Forecast, by Country 2019 & 2032
- Table 50: Global Smart Polymers Industry Volume K Tons Forecast, by Country 2019 & 2032
- Table 51: Saudi Arabia Smart Polymers Industry Revenue (Million) Forecast, by Application 2019 & 2032
- Table 52: Saudi Arabia Smart Polymers Industry Volume (K Tons) Forecast, by Application 2019 & 2032
- Table 53: South Africa Smart Polymers Industry Revenue (Million) Forecast, by Application 2019 & 2032
- Table 54: South Africa Smart Polymers Industry Volume (K Tons) Forecast, by Application 2019 & 2032
- Table 55: Rest of Middle East and Africa Smart Polymers Industry Revenue (Million) Forecast, by Application 2019 & 2032
- Table 56: Rest of Middle East and Africa Smart Polymers Industry Volume (K Tons) Forecast, by Application 2019 & 2032
- Table 57: Global Smart Polymers Industry Revenue Million Forecast, by Type 2019 & 2032
- Table 58: Global Smart Polymers Industry Volume K Tons Forecast, by Type 2019 & 2032
- Table 59: Global Smart Polymers Industry Revenue Million Forecast, by End-user Industry 2019 & 2032
- Table 60: Global Smart Polymers Industry Volume K Tons Forecast, by End-user Industry 2019 & 2032
- Table 61: Global Smart Polymers Industry Revenue Million Forecast, by Country 2019 & 2032
- Table 62: Global Smart Polymers Industry Volume K Tons Forecast, by Country 2019 & 2032
- Table 63: China Smart Polymers Industry Revenue (Million) Forecast, by Application 2019 & 2032
- Table 64: China Smart Polymers Industry Volume (K Tons) Forecast, by Application 2019 & 2032
- Table 65: India Smart Polymers Industry Revenue (Million) Forecast, by Application 2019 & 2032
- Table 66: India Smart Polymers Industry Volume (K Tons) Forecast, by Application 2019 & 2032
- Table 67: Japan Smart Polymers Industry Revenue (Million) Forecast, by Application 2019 & 2032
- Table 68: Japan Smart Polymers Industry Volume (K Tons) Forecast, by Application 2019 & 2032
- Table 69: South Korea Smart Polymers Industry Revenue (Million) Forecast, by Application 2019 & 2032
- Table 70: South Korea Smart Polymers Industry Volume (K Tons) Forecast, by Application 2019 & 2032
- Table 71: Rest of Asia Pacific Smart Polymers Industry Revenue (Million) Forecast, by Application 2019 & 2032
- Table 72: Rest of Asia Pacific Smart Polymers Industry Volume (K Tons) Forecast, by Application 2019 & 2032
- Table 73: Global Smart Polymers Industry Revenue Million Forecast, by Type 2019 & 2032
- Table 74: Global Smart Polymers Industry Volume K Tons Forecast, by Type 2019 & 2032
- Table 75: Global Smart Polymers Industry Revenue Million Forecast, by End-user Industry 2019 & 2032
- Table 76: Global Smart Polymers Industry Volume K Tons Forecast, by End-user Industry 2019 & 2032
- Table 77: Global Smart Polymers Industry Revenue Million Forecast, by Country 2019 & 2032
- Table 78: Global Smart Polymers Industry Volume K Tons Forecast, by Country 2019 & 2032
- Table 79: United States Smart Polymers Industry Revenue (Million) Forecast, by Application 2019 & 2032
- Table 80: United States Smart Polymers Industry Volume (K Tons) Forecast, by Application 2019 & 2032
- Table 81: Canada Smart Polymers Industry Revenue (Million) Forecast, by Application 2019 & 2032
- Table 82: Canada Smart Polymers Industry Volume (K Tons) Forecast, by Application 2019 & 2032
- Table 83: Mexico Smart Polymers Industry Revenue (Million) Forecast, by Application 2019 & 2032
- Table 84: Mexico Smart Polymers Industry Volume (K Tons) Forecast, by Application 2019 & 2032
- Table 85: Global Smart Polymers Industry Revenue Million Forecast, by Type 2019 & 2032
- Table 86: Global Smart Polymers Industry Volume K Tons Forecast, by Type 2019 & 2032
- Table 87: Global Smart Polymers Industry Revenue Million Forecast, by End-user Industry 2019 & 2032
- Table 88: Global Smart Polymers Industry Volume K Tons Forecast, by End-user Industry 2019 & 2032
- Table 89: Global Smart Polymers Industry Revenue Million Forecast, by Country 2019 & 2032
- Table 90: Global Smart Polymers Industry Volume K Tons Forecast, by Country 2019 & 2032
- Table 91: Germany Smart Polymers Industry Revenue (Million) Forecast, by Application 2019 & 2032
- Table 92: Germany Smart Polymers Industry Volume (K Tons) Forecast, by Application 2019 & 2032
- Table 93: United Kingdom Smart Polymers Industry Revenue (Million) Forecast, by Application 2019 & 2032
- Table 94: United Kingdom Smart Polymers Industry Volume (K Tons) Forecast, by Application 2019 & 2032
- Table 95: Italy Smart Polymers Industry Revenue (Million) Forecast, by Application 2019 & 2032
- Table 96: Italy Smart Polymers Industry Volume (K Tons) Forecast, by Application 2019 & 2032
- Table 97: France Smart Polymers Industry Revenue (Million) Forecast, by Application 2019 & 2032
- Table 98: France Smart Polymers Industry Volume (K Tons) Forecast, by Application 2019 & 2032
- Table 99: Rest of Europe Smart Polymers Industry Revenue (Million) Forecast, by Application 2019 & 2032
- Table 100: Rest of Europe Smart Polymers Industry Volume (K Tons) Forecast, by Application 2019 & 2032
- Table 101: Global Smart Polymers Industry Revenue Million Forecast, by Type 2019 & 2032
- Table 102: Global Smart Polymers Industry Volume K Tons Forecast, by Type 2019 & 2032
- Table 103: Global Smart Polymers Industry Revenue Million Forecast, by End-user Industry 2019 & 2032
- Table 104: Global Smart Polymers Industry Volume K Tons Forecast, by End-user Industry 2019 & 2032
- Table 105: Global Smart Polymers Industry Revenue Million Forecast, by Country 2019 & 2032
- Table 106: Global Smart Polymers Industry Volume K Tons Forecast, by Country 2019 & 2032
- Table 107: Brazil Smart Polymers Industry Revenue (Million) Forecast, by Application 2019 & 2032
- Table 108: Brazil Smart Polymers Industry Volume (K Tons) Forecast, by Application 2019 & 2032
- Table 109: Argentina Smart Polymers Industry Revenue (Million) Forecast, by Application 2019 & 2032
- Table 110: Argentina Smart Polymers Industry Volume (K Tons) Forecast, by Application 2019 & 2032
- Table 111: Rest of South America Smart Polymers Industry Revenue (Million) Forecast, by Application 2019 & 2032
- Table 112: Rest of South America Smart Polymers Industry Volume (K Tons) Forecast, by Application 2019 & 2032
- Table 113: Global Smart Polymers Industry Revenue Million Forecast, by Type 2019 & 2032
- Table 114: Global Smart Polymers Industry Volume K Tons Forecast, by Type 2019 & 2032
- Table 115: Global Smart Polymers Industry Revenue Million Forecast, by End-user Industry 2019 & 2032
- Table 116: Global Smart Polymers Industry Volume K Tons Forecast, by End-user Industry 2019 & 2032
- Table 117: Global Smart Polymers Industry Revenue Million Forecast, by Country 2019 & 2032
- Table 118: Global Smart Polymers Industry Volume K Tons Forecast, by Country 2019 & 2032
- Table 119: Saudi Arabia Smart Polymers Industry Revenue (Million) Forecast, by Application 2019 & 2032
- Table 120: Saudi Arabia Smart Polymers Industry Volume (K Tons) Forecast, by Application 2019 & 2032
- Table 121: South Africa Smart Polymers Industry Revenue (Million) Forecast, by Application 2019 & 2032
- Table 122: South Africa Smart Polymers Industry Volume (K Tons) Forecast, by Application 2019 & 2032
- Table 123: Rest of Middle East and Africa Smart Polymers Industry Revenue (Million) Forecast, by Application 2019 & 2032
- Table 124: Rest of Middle East and Africa Smart Polymers Industry Volume (K Tons) Forecast, by Application 2019 & 2032
Frequently Asked Questions
1. What is the projected Compound Annual Growth Rate (CAGR) of the Smart Polymers Industry?
The projected CAGR is approximately > 15.00%.
2. Which companies are prominent players in the Smart Polymers Industry?
Key companies in the market include Nouryon, Merck KGaA, Autonomic Materials, Evonik Industries AG, Spintech LLC, Huntsman International LLC, DuPont, The Lubrizol Corporation, Covestro AG, SMP Technologies Inc, TNO.
3. What are the main segments of the Smart Polymers Industry?
The market segments include Type, End-user Industry.
4. Can you provide details about the market size?
The market size is estimated to be USD XX Million as of 2022.
5. What are some drivers contributing to market growth?
Increasing Application of Shape Memory Polymer in Textile Industry; Increasing Need for Efficient Drug Delivery System; Development of Smart Biopolymers.
6. What are the notable trends driving market growth?
Biomedical and Healthcare to Dominate the Market.
7. Are there any restraints impacting market growth?
High Cost of Technology and Development of Smart Polymers; Other Restraints.
8. Can you provide examples of recent developments in the market?
In August 2021, Evonik aquired the German biotech company JeNaCell. The acquisition adds biotechnologically produced cellulose to Evonik's portfolio of biomaterials.
9. What pricing options are available for accessing the report?
Pricing options include single-user, multi-user, and enterprise licenses priced at USD 4750, USD 5250, and USD 8750 respectively.
10. Is the market size provided in terms of value or volume?
The market size is provided in terms of value, measured in Million and volume, measured in K Tons.
11. Are there any specific market keywords associated with the report?
Yes, the market keyword associated with the report is "Smart Polymers Industry," which aids in identifying and referencing the specific market segment covered.
12. How do I determine which pricing option suits my needs best?
The pricing options vary based on user requirements and access needs. Individual users may opt for single-user licenses, while businesses requiring broader access may choose multi-user or enterprise licenses for cost-effective access to the report.
13. Are there any additional resources or data provided in the Smart Polymers Industry report?
While the report offers comprehensive insights, it's advisable to review the specific contents or supplementary materials provided to ascertain if additional resources or data are available.
14. How can I stay updated on further developments or reports in the Smart Polymers Industry?
To stay informed about further developments, trends, and reports in the Smart Polymers Industry, consider subscribing to industry newsletters, following relevant companies and organizations, or regularly checking reputable industry news sources and publications.
Methodology
Step 1 - Identification of Relevant Samples Size from Population Database


Step 2 - Approaches for Defining Global Market Size (Value, Volume* & Price*)

Note*: In applicable scenarios
Step 3 - Data Sources
Primary Research
- Web Analytics
- Survey Reports
- Research Institute
- Latest Research Reports
- Opinion Leaders
Secondary Research
- Annual Reports
- White Paper
- Latest Press Release
- Industry Association
- Paid Database
- Investor Presentations

Step 4 - Data Triangulation
Involves using different sources of information in order to increase the validity of a study
These sources are likely to be stakeholders in a program - participants, other researchers, program staff, other community members, and so on.
Then we put all data in single framework & apply various statistical tools to find out the dynamic on the market.
During the analysis stage, feedback from the stakeholder groups would be compared to determine areas of agreement as well as areas of divergence


