
Key Insights
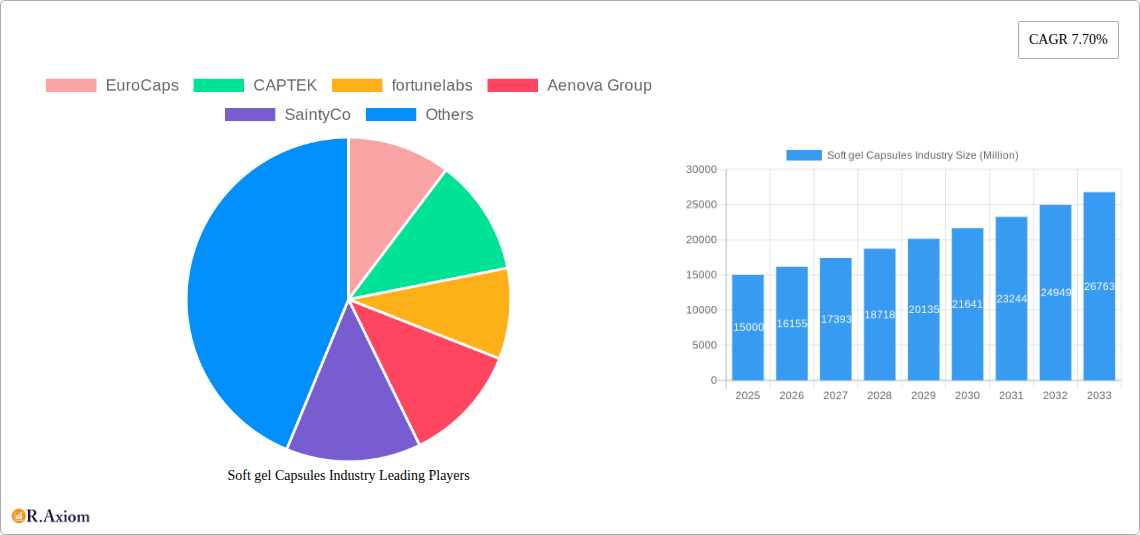
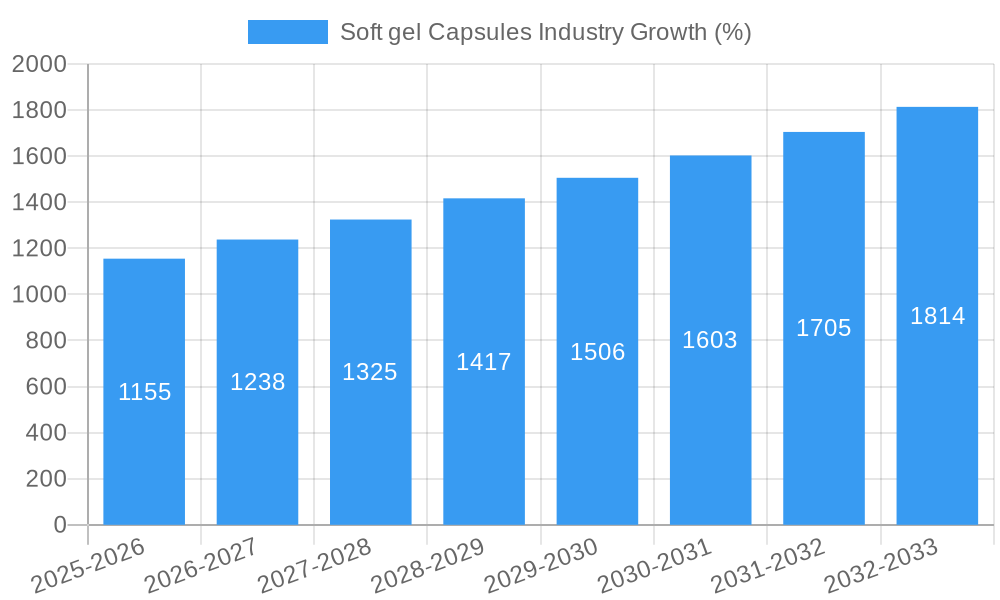
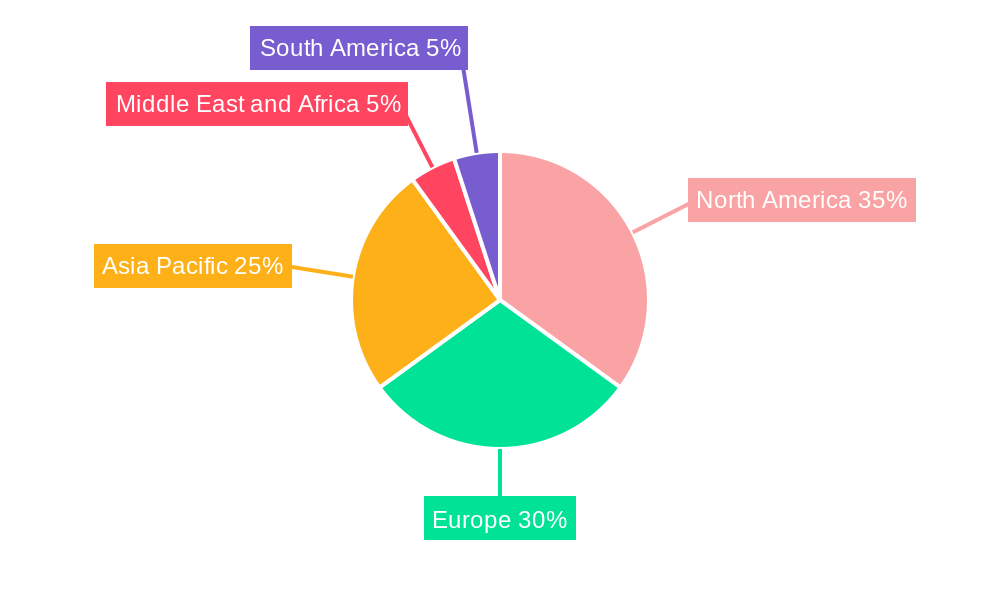
The soft gel capsule market is experiencing robust growth, projected to reach a substantial size by 2033, driven by a compound annual growth rate (CAGR) of 7.70%. This expansion is fueled by several key factors. The increasing demand for convenient and easy-to-swallow dosage forms, particularly in the pharmaceutical and nutraceutical sectors, is a primary driver. The rising prevalence of chronic diseases globally necessitates effective and readily absorbable medications, further boosting the market. Furthermore, advancements in soft gel capsule technology, allowing for improved drug delivery and enhanced patient compliance, contribute significantly to market growth. The market is segmented by capsule type (animal-based and non-animal-based) and application (pharmaceutical, nutraceutical, and other applications). The pharmaceutical segment currently dominates, but the nutraceutical segment is witnessing rapid expansion due to growing consumer awareness of health and wellness. Geographic growth varies; North America and Europe currently hold significant market shares, while the Asia-Pacific region presents a lucrative growth opportunity due to its large and rapidly expanding population and rising disposable incomes. Competitive dynamics are shaping the market, with established players like EuroCaps, CAPTEK, and Procaps competing alongside emerging companies.
The market's restraints primarily involve regulatory hurdles and concerns related to the sourcing and sustainability of raw materials, particularly animal-derived gelatin. However, the industry is actively addressing these challenges through the development of innovative, plant-based alternatives and the implementation of stringent quality control measures. The increasing focus on personalized medicine and targeted drug delivery further presents significant opportunities for the soft gel capsule market. Looking ahead, the market is expected to continue its upward trajectory, driven by sustained demand, technological advancements, and the expanding global healthcare sector. Strategic partnerships, mergers, and acquisitions are likely to shape the competitive landscape in the coming years. Companies are focusing on innovation and expanding their product portfolios to cater to diverse market needs and preferences.
Soft Gel Capsules Industry: A Comprehensive Market Report (2019-2033)
This comprehensive report provides a detailed analysis of the global soft gel capsules industry, covering market size, segmentation, growth drivers, challenges, and key players. The study period spans from 2019 to 2033, with 2025 serving as both the base and estimated year. The forecast period extends from 2025 to 2033, while the historical period encompasses 2019-2024. The report offers actionable insights for industry stakeholders, investors, and businesses seeking to understand this dynamic market. The global market value in 2025 is estimated at $XX Million.
Soft gel Capsules Industry Market Concentration & Innovation
The soft gel capsules industry exhibits a moderately concentrated market structure, with several major players holding significant market share. Key players include EuroCaps, CAPTEK, fortunelabs, Aenova Group, SaintyCo, Procaps, Sirio Pharma, United Laboratories, Fuji Capsule Co Ltd, Soft Gel Technologies Inc, and MEDGEL. While precise market share data for each company is proprietary, EuroCaps and Aenova Group are estimated to hold a combined share of approximately xx%. The industry is characterized by ongoing innovation, driven by the need for improved functionality, enhanced stability, and targeted delivery systems for various applications. Regulatory frameworks, particularly concerning the use of animal-derived ingredients and the growing demand for natural and sustainable alternatives, impact industry players. The increasing preference for customized and personalized healthcare solutions fuels innovation in capsule formulation and design. Mergers and acquisitions (M&A) activities play a significant role in shaping market dynamics. In recent years, the total value of M&A deals in the industry has been estimated at $XX Million.
- Market Concentration: Moderately concentrated with key players holding significant market share.
- Innovation Drivers: Improved functionality, enhanced stability, targeted drug delivery, increasing demand for customized healthcare solutions.
- Regulatory Frameworks: Growing focus on natural and sustainable ingredients, regulations concerning animal-derived materials.
- Product Substitutes: Other dosage forms such as tablets and hard capsules pose competitive pressure.
- End-User Trends: Growing demand for convenience, efficacy, and personalized healthcare solutions.
- M&A Activities: Significant consolidation through acquisitions and mergers, with an estimated $XX Million in deal value in recent years.
Soft gel Capsules Industry Industry Trends & Insights
The soft gel capsules market is experiencing robust growth, driven by the increasing demand for pharmaceuticals, nutraceuticals, and other applications. The global market is projected to achieve a CAGR of xx% during the forecast period (2025-2033), reaching an estimated value of $XX Million by 2033. This growth is fueled by several factors. The rising prevalence of chronic diseases globally necessitates increased pharmaceutical consumption, driving the demand for convenient and effective dosage forms like soft gel capsules. Furthermore, the burgeoning nutraceutical market, driven by consumer interest in health and wellness, significantly contributes to market expansion. Technological advancements in soft gel encapsulation technologies contribute to improved product quality and efficiency. These advancements, coupled with evolving consumer preferences for personalized health solutions, are reshaping the competitive landscape, with companies investing in R&D to develop innovative products. Market penetration of soft gel capsules in emerging economies is increasing rapidly, presenting significant growth opportunities.
Dominant Markets & Segments in Soft gel Capsules Industry
The North American market currently holds a dominant position in the soft gel capsules industry, driven by factors such as a robust pharmaceutical and nutraceutical market, high healthcare expenditure, and advanced manufacturing capabilities. However, the Asia-Pacific region is expected to exhibit significant growth during the forecast period, owing to its expanding healthcare infrastructure, rising disposable incomes, and growing awareness of health and wellness.
- Dominant Region: North America
- Key Drivers for North America: High healthcare expenditure, robust pharmaceutical and nutraceutical markets, advanced manufacturing capabilities.
- Key Drivers for Asia-Pacific: Expanding healthcare infrastructure, rising disposable incomes, growing health awareness.
Segment Analysis:
- Type: The non-animal based segment is experiencing faster growth than animal-based, driven by ethical concerns and religious restrictions, with a projected market value of $XX Million by 2033.
- Application: The pharmaceutical segment dominates the market, followed by nutraceuticals and other applications which are showing considerable growth potential, driven by increased consumer awareness about health and wellness. The pharmaceutical segment is projected to maintain its dominance at $XX Million by 2033.
Soft gel Capsules Industry Product Developments
Recent product innovations focus on enhancing the stability, bioavailability, and targeted delivery of active ingredients within soft gel capsules. This includes the development of specialized capsule formulations, such as those incorporating advanced technologies like liposomes or nanoparticles. The increasing demand for customized and personalized healthcare solutions is driving the development of soft gel capsules tailored to specific patient needs and therapeutic goals. These improvements have led to competitive advantages for companies offering superior product quality, improved efficacy, and enhanced patient compliance.
Report Scope & Segmentation Analysis
This report segments the soft gel capsules market based on type (animal-based and non-animal based) and application (pharmaceutical, nutraceutical, and other applications). Each segment is analyzed based on growth projections, market size, and competitive dynamics. For instance, the non-animal based segment is expected to experience significant growth due to increasing consumer preference for vegetarian and vegan products. The pharmaceutical segment is expected to remain the largest, driving substantial revenue, while the nutraceutical segment shows significant growth potential.
Key Drivers of Soft gel Capsules Industry Growth
Several factors contribute to the growth of the soft gel capsules industry. Technological advancements in capsule manufacturing and formulation have enabled the development of improved products with enhanced stability, bioavailability, and targeted delivery. The rising prevalence of chronic diseases globally fuels the demand for pharmaceutical products, including those in soft gel form. Growing consumer awareness of health and wellness drives the expanding nutraceutical market, which uses soft gel capsules extensively. Furthermore, favorable government regulations and increasing investments in healthcare infrastructure in developing economies contribute to market growth.
Challenges in the Soft Gel Capsules Industry Sector
The soft gel capsules industry faces challenges such as strict regulatory compliance requirements that can increase production costs and time-to-market. Supply chain disruptions, particularly concerning raw materials and packaging components, pose significant risks. Intense competition among existing players necessitates continuous innovation and cost optimization to maintain market share. The fluctuation in raw material prices also impact profitability.
Emerging Opportunities in Soft gel Capsules Industry
Emerging opportunities lie in the development of innovative capsule formulations, incorporating advanced technologies such as liposomes, nanoparticles, and targeted delivery systems. Expansion into emerging markets in Asia and Africa presents significant growth potential. The growing interest in personalized medicine and customized healthcare solutions creates opportunities for developing tailored soft gel capsules for specific patient needs. The increasing demand for sustainable and eco-friendly packaging also represents a growth area.
Leading Players in the Soft gel Capsules Industry Market
- EuroCaps
- CAPTEK
- fortunelabs
- Aenova Group
- SaintyCo
- Procaps
- Sirio Pharma
- United Laboratories
- Fuji Capsule Co Ltd
- Soft Gel Technologies Inc
- MEDGEL
Key Developments in Soft gel Capsules Industry Industry
- May 2022: Windzor Pharma Ltd launched Rx Vitamin D3 product Solferol Softgel capsules in the Irish market. This launch increased competition in the vitamin D3 market.
- February 2022: ZYUS Life Sciences Inc. launched two softgel capsules, Zylem 1:20 Softgel Capsules and Zylem 5:5 Softgel Capsules in Canada. This broadened ZYUS's product portfolio.
Strategic Outlook for Soft gel Capsules Industry Market
The soft gel capsules market is poised for continued growth, driven by technological advancements, expanding healthcare infrastructure in emerging markets, and the rising consumer demand for convenient and effective dosage forms. Focusing on innovation, particularly in targeted drug delivery systems and sustainable packaging, presents significant opportunities for companies to gain a competitive edge. Strategic partnerships and collaborations will play a vital role in market expansion and penetration.
Soft gel Capsules Industry Segmentation
-
1. Type
- 1.1. Animal Based
- 1.2. Non-animal Based
-
2. Application
- 2.1. Pharmaceutical
- 2.2. Nutraceutical
- 2.3. Other Applications
Soft gel Capsules Industry Segmentation By Geography
-
1. North America
- 1.1. United States
- 1.2. Canada
- 1.3. Mexico
-
2. Europe
- 2.1. Germany
- 2.2. United Kingdom
- 2.3. France
- 2.4. Italy
- 2.5. Spain
- 2.6. Rest of Europe
-
3. Asia Pacific
- 3.1. China
- 3.2. Japan
- 3.3. India
- 3.4. Australia
- 3.5. South Korea
- 3.6. Rest of Asia Pacific
-
4. Middle East and Africa
- 4.1. GCC
- 4.2. South Africa
- 4.3. Rest of Middle East and Africa
-
5. South America
- 5.1. Brazil
- 5.2. Argentina
- 5.3. Rest of South America
Soft gel Capsules Industry REPORT HIGHLIGHTS
| Aspects | Details |
|---|---|
| Study Period | 2019-2033 |
| Base Year | 2024 |
| Estimated Year | 2025 |
| Forecast Period | 2025-2033 |
| Historical Period | 2019-2024 |
| Growth Rate | CAGR of 7.70% from 2019-2033 |
| Segmentation |
|
Table of Contents
- 1. Introduction
- 1.1. Research Scope
- 1.2. Market Segmentation
- 1.3. Research Methodology
- 1.4. Definitions and Assumptions
- 2. Executive Summary
- 2.1. Introduction
- 3. Market Dynamics
- 3.1. Introduction
- 3.2. Market Drivers
- 3.2.1. Technological Advancements and Increasing R&D Activities; Growing Demand from Health-conscious Consumers
- 3.3. Market Restrains
- 3.3.1. Drawbacks Associated with Softgel Capsules
- 3.4. Market Trends
- 3.4.1. Pharmaceutical Segment is Expected to Hold a Significant Market Share Over the Forecast Period
- 4. Market Factor Analysis
- 4.1. Porters Five Forces
- 4.2. Supply/Value Chain
- 4.3. PESTEL analysis
- 4.4. Market Entropy
- 4.5. Patent/Trademark Analysis
- 5. Global Soft gel Capsules Industry Analysis, Insights and Forecast, 2019-2031
- 5.1. Market Analysis, Insights and Forecast - by Type
- 5.1.1. Animal Based
- 5.1.2. Non-animal Based
- 5.2. Market Analysis, Insights and Forecast - by Application
- 5.2.1. Pharmaceutical
- 5.2.2. Nutraceutical
- 5.2.3. Other Applications
- 5.3. Market Analysis, Insights and Forecast - by Region
- 5.3.1. North America
- 5.3.2. Europe
- 5.3.3. Asia Pacific
- 5.3.4. Middle East and Africa
- 5.3.5. South America
- 5.1. Market Analysis, Insights and Forecast - by Type
- 6. North America Soft gel Capsules Industry Analysis, Insights and Forecast, 2019-2031
- 6.1. Market Analysis, Insights and Forecast - by Type
- 6.1.1. Animal Based
- 6.1.2. Non-animal Based
- 6.2. Market Analysis, Insights and Forecast - by Application
- 6.2.1. Pharmaceutical
- 6.2.2. Nutraceutical
- 6.2.3. Other Applications
- 6.1. Market Analysis, Insights and Forecast - by Type
- 7. Europe Soft gel Capsules Industry Analysis, Insights and Forecast, 2019-2031
- 7.1. Market Analysis, Insights and Forecast - by Type
- 7.1.1. Animal Based
- 7.1.2. Non-animal Based
- 7.2. Market Analysis, Insights and Forecast - by Application
- 7.2.1. Pharmaceutical
- 7.2.2. Nutraceutical
- 7.2.3. Other Applications
- 7.1. Market Analysis, Insights and Forecast - by Type
- 8. Asia Pacific Soft gel Capsules Industry Analysis, Insights and Forecast, 2019-2031
- 8.1. Market Analysis, Insights and Forecast - by Type
- 8.1.1. Animal Based
- 8.1.2. Non-animal Based
- 8.2. Market Analysis, Insights and Forecast - by Application
- 8.2.1. Pharmaceutical
- 8.2.2. Nutraceutical
- 8.2.3. Other Applications
- 8.1. Market Analysis, Insights and Forecast - by Type
- 9. Middle East and Africa Soft gel Capsules Industry Analysis, Insights and Forecast, 2019-2031
- 9.1. Market Analysis, Insights and Forecast - by Type
- 9.1.1. Animal Based
- 9.1.2. Non-animal Based
- 9.2. Market Analysis, Insights and Forecast - by Application
- 9.2.1. Pharmaceutical
- 9.2.2. Nutraceutical
- 9.2.3. Other Applications
- 9.1. Market Analysis, Insights and Forecast - by Type
- 10. South America Soft gel Capsules Industry Analysis, Insights and Forecast, 2019-2031
- 10.1. Market Analysis, Insights and Forecast - by Type
- 10.1.1. Animal Based
- 10.1.2. Non-animal Based
- 10.2. Market Analysis, Insights and Forecast - by Application
- 10.2.1. Pharmaceutical
- 10.2.2. Nutraceutical
- 10.2.3. Other Applications
- 10.1. Market Analysis, Insights and Forecast - by Type
- 11. North America Soft gel Capsules Industry Analysis, Insights and Forecast, 2019-2031
- 11.1. Market Analysis, Insights and Forecast - By Country/Sub-region
- 11.1.1 United States
- 11.1.2 Canada
- 11.1.3 Mexico
- 12. Europe Soft gel Capsules Industry Analysis, Insights and Forecast, 2019-2031
- 12.1. Market Analysis, Insights and Forecast - By Country/Sub-region
- 12.1.1 Germany
- 12.1.2 United Kingdom
- 12.1.3 France
- 12.1.4 Italy
- 12.1.5 Spain
- 12.1.6 Rest of Europe
- 13. Asia Pacific Soft gel Capsules Industry Analysis, Insights and Forecast, 2019-2031
- 13.1. Market Analysis, Insights and Forecast - By Country/Sub-region
- 13.1.1 China
- 13.1.2 Japan
- 13.1.3 India
- 13.1.4 Australia
- 13.1.5 South Korea
- 13.1.6 Rest of Asia Pacific
- 14. Middle East and Africa Soft gel Capsules Industry Analysis, Insights and Forecast, 2019-2031
- 14.1. Market Analysis, Insights and Forecast - By Country/Sub-region
- 14.1.1 GCC
- 14.1.2 South Africa
- 14.1.3 Rest of Middle East and Africa
- 15. South America Soft gel Capsules Industry Analysis, Insights and Forecast, 2019-2031
- 15.1. Market Analysis, Insights and Forecast - By Country/Sub-region
- 15.1.1 Brazil
- 15.1.2 Argentina
- 15.1.3 Rest of South America
- 16. Competitive Analysis
- 16.1. Global Market Share Analysis 2024
- 16.2. Company Profiles
- 16.2.1 EuroCaps
- 16.2.1.1. Overview
- 16.2.1.2. Products
- 16.2.1.3. SWOT Analysis
- 16.2.1.4. Recent Developments
- 16.2.1.5. Financials (Based on Availability)
- 16.2.2 CAPTEK
- 16.2.2.1. Overview
- 16.2.2.2. Products
- 16.2.2.3. SWOT Analysis
- 16.2.2.4. Recent Developments
- 16.2.2.5. Financials (Based on Availability)
- 16.2.3 fortunelabs
- 16.2.3.1. Overview
- 16.2.3.2. Products
- 16.2.3.3. SWOT Analysis
- 16.2.3.4. Recent Developments
- 16.2.3.5. Financials (Based on Availability)
- 16.2.4 Aenova Group
- 16.2.4.1. Overview
- 16.2.4.2. Products
- 16.2.4.3. SWOT Analysis
- 16.2.4.4. Recent Developments
- 16.2.4.5. Financials (Based on Availability)
- 16.2.5 SaintyCo
- 16.2.5.1. Overview
- 16.2.5.2. Products
- 16.2.5.3. SWOT Analysis
- 16.2.5.4. Recent Developments
- 16.2.5.5. Financials (Based on Availability)
- 16.2.6 Procaps
- 16.2.6.1. Overview
- 16.2.6.2. Products
- 16.2.6.3. SWOT Analysis
- 16.2.6.4. Recent Developments
- 16.2.6.5. Financials (Based on Availability)
- 16.2.7 Sirio Pharma
- 16.2.7.1. Overview
- 16.2.7.2. Products
- 16.2.7.3. SWOT Analysis
- 16.2.7.4. Recent Developments
- 16.2.7.5. Financials (Based on Availability)
- 16.2.8 United Laboratories
- 16.2.8.1. Overview
- 16.2.8.2. Products
- 16.2.8.3. SWOT Analysis
- 16.2.8.4. Recent Developments
- 16.2.8.5. Financials (Based on Availability)
- 16.2.9 Fuji Capsule Co Ltd
- 16.2.9.1. Overview
- 16.2.9.2. Products
- 16.2.9.3. SWOT Analysis
- 16.2.9.4. Recent Developments
- 16.2.9.5. Financials (Based on Availability)
- 16.2.10 Soft Gel Technologies Inc
- 16.2.10.1. Overview
- 16.2.10.2. Products
- 16.2.10.3. SWOT Analysis
- 16.2.10.4. Recent Developments
- 16.2.10.5. Financials (Based on Availability)
- 16.2.11 MEDGEL
- 16.2.11.1. Overview
- 16.2.11.2. Products
- 16.2.11.3. SWOT Analysis
- 16.2.11.4. Recent Developments
- 16.2.11.5. Financials (Based on Availability)
- 16.2.1 EuroCaps
List of Figures
- Figure 1: Global Soft gel Capsules Industry Revenue Breakdown (Million, %) by Region 2024 & 2032
- Figure 2: Global Soft gel Capsules Industry Volume Breakdown (K Unit, %) by Region 2024 & 2032
- Figure 3: North America Soft gel Capsules Industry Revenue (Million), by Country 2024 & 2032
- Figure 4: North America Soft gel Capsules Industry Volume (K Unit), by Country 2024 & 2032
- Figure 5: North America Soft gel Capsules Industry Revenue Share (%), by Country 2024 & 2032
- Figure 6: North America Soft gel Capsules Industry Volume Share (%), by Country 2024 & 2032
- Figure 7: Europe Soft gel Capsules Industry Revenue (Million), by Country 2024 & 2032
- Figure 8: Europe Soft gel Capsules Industry Volume (K Unit), by Country 2024 & 2032
- Figure 9: Europe Soft gel Capsules Industry Revenue Share (%), by Country 2024 & 2032
- Figure 10: Europe Soft gel Capsules Industry Volume Share (%), by Country 2024 & 2032
- Figure 11: Asia Pacific Soft gel Capsules Industry Revenue (Million), by Country 2024 & 2032
- Figure 12: Asia Pacific Soft gel Capsules Industry Volume (K Unit), by Country 2024 & 2032
- Figure 13: Asia Pacific Soft gel Capsules Industry Revenue Share (%), by Country 2024 & 2032
- Figure 14: Asia Pacific Soft gel Capsules Industry Volume Share (%), by Country 2024 & 2032
- Figure 15: Middle East and Africa Soft gel Capsules Industry Revenue (Million), by Country 2024 & 2032
- Figure 16: Middle East and Africa Soft gel Capsules Industry Volume (K Unit), by Country 2024 & 2032
- Figure 17: Middle East and Africa Soft gel Capsules Industry Revenue Share (%), by Country 2024 & 2032
- Figure 18: Middle East and Africa Soft gel Capsules Industry Volume Share (%), by Country 2024 & 2032
- Figure 19: South America Soft gel Capsules Industry Revenue (Million), by Country 2024 & 2032
- Figure 20: South America Soft gel Capsules Industry Volume (K Unit), by Country 2024 & 2032
- Figure 21: South America Soft gel Capsules Industry Revenue Share (%), by Country 2024 & 2032
- Figure 22: South America Soft gel Capsules Industry Volume Share (%), by Country 2024 & 2032
- Figure 23: North America Soft gel Capsules Industry Revenue (Million), by Type 2024 & 2032
- Figure 24: North America Soft gel Capsules Industry Volume (K Unit), by Type 2024 & 2032
- Figure 25: North America Soft gel Capsules Industry Revenue Share (%), by Type 2024 & 2032
- Figure 26: North America Soft gel Capsules Industry Volume Share (%), by Type 2024 & 2032
- Figure 27: North America Soft gel Capsules Industry Revenue (Million), by Application 2024 & 2032
- Figure 28: North America Soft gel Capsules Industry Volume (K Unit), by Application 2024 & 2032
- Figure 29: North America Soft gel Capsules Industry Revenue Share (%), by Application 2024 & 2032
- Figure 30: North America Soft gel Capsules Industry Volume Share (%), by Application 2024 & 2032
- Figure 31: North America Soft gel Capsules Industry Revenue (Million), by Country 2024 & 2032
- Figure 32: North America Soft gel Capsules Industry Volume (K Unit), by Country 2024 & 2032
- Figure 33: North America Soft gel Capsules Industry Revenue Share (%), by Country 2024 & 2032
- Figure 34: North America Soft gel Capsules Industry Volume Share (%), by Country 2024 & 2032
- Figure 35: Europe Soft gel Capsules Industry Revenue (Million), by Type 2024 & 2032
- Figure 36: Europe Soft gel Capsules Industry Volume (K Unit), by Type 2024 & 2032
- Figure 37: Europe Soft gel Capsules Industry Revenue Share (%), by Type 2024 & 2032
- Figure 38: Europe Soft gel Capsules Industry Volume Share (%), by Type 2024 & 2032
- Figure 39: Europe Soft gel Capsules Industry Revenue (Million), by Application 2024 & 2032
- Figure 40: Europe Soft gel Capsules Industry Volume (K Unit), by Application 2024 & 2032
- Figure 41: Europe Soft gel Capsules Industry Revenue Share (%), by Application 2024 & 2032
- Figure 42: Europe Soft gel Capsules Industry Volume Share (%), by Application 2024 & 2032
- Figure 43: Europe Soft gel Capsules Industry Revenue (Million), by Country 2024 & 2032
- Figure 44: Europe Soft gel Capsules Industry Volume (K Unit), by Country 2024 & 2032
- Figure 45: Europe Soft gel Capsules Industry Revenue Share (%), by Country 2024 & 2032
- Figure 46: Europe Soft gel Capsules Industry Volume Share (%), by Country 2024 & 2032
- Figure 47: Asia Pacific Soft gel Capsules Industry Revenue (Million), by Type 2024 & 2032
- Figure 48: Asia Pacific Soft gel Capsules Industry Volume (K Unit), by Type 2024 & 2032
- Figure 49: Asia Pacific Soft gel Capsules Industry Revenue Share (%), by Type 2024 & 2032
- Figure 50: Asia Pacific Soft gel Capsules Industry Volume Share (%), by Type 2024 & 2032
- Figure 51: Asia Pacific Soft gel Capsules Industry Revenue (Million), by Application 2024 & 2032
- Figure 52: Asia Pacific Soft gel Capsules Industry Volume (K Unit), by Application 2024 & 2032
- Figure 53: Asia Pacific Soft gel Capsules Industry Revenue Share (%), by Application 2024 & 2032
- Figure 54: Asia Pacific Soft gel Capsules Industry Volume Share (%), by Application 2024 & 2032
- Figure 55: Asia Pacific Soft gel Capsules Industry Revenue (Million), by Country 2024 & 2032
- Figure 56: Asia Pacific Soft gel Capsules Industry Volume (K Unit), by Country 2024 & 2032
- Figure 57: Asia Pacific Soft gel Capsules Industry Revenue Share (%), by Country 2024 & 2032
- Figure 58: Asia Pacific Soft gel Capsules Industry Volume Share (%), by Country 2024 & 2032
- Figure 59: Middle East and Africa Soft gel Capsules Industry Revenue (Million), by Type 2024 & 2032
- Figure 60: Middle East and Africa Soft gel Capsules Industry Volume (K Unit), by Type 2024 & 2032
- Figure 61: Middle East and Africa Soft gel Capsules Industry Revenue Share (%), by Type 2024 & 2032
- Figure 62: Middle East and Africa Soft gel Capsules Industry Volume Share (%), by Type 2024 & 2032
- Figure 63: Middle East and Africa Soft gel Capsules Industry Revenue (Million), by Application 2024 & 2032
- Figure 64: Middle East and Africa Soft gel Capsules Industry Volume (K Unit), by Application 2024 & 2032
- Figure 65: Middle East and Africa Soft gel Capsules Industry Revenue Share (%), by Application 2024 & 2032
- Figure 66: Middle East and Africa Soft gel Capsules Industry Volume Share (%), by Application 2024 & 2032
- Figure 67: Middle East and Africa Soft gel Capsules Industry Revenue (Million), by Country 2024 & 2032
- Figure 68: Middle East and Africa Soft gel Capsules Industry Volume (K Unit), by Country 2024 & 2032
- Figure 69: Middle East and Africa Soft gel Capsules Industry Revenue Share (%), by Country 2024 & 2032
- Figure 70: Middle East and Africa Soft gel Capsules Industry Volume Share (%), by Country 2024 & 2032
- Figure 71: South America Soft gel Capsules Industry Revenue (Million), by Type 2024 & 2032
- Figure 72: South America Soft gel Capsules Industry Volume (K Unit), by Type 2024 & 2032
- Figure 73: South America Soft gel Capsules Industry Revenue Share (%), by Type 2024 & 2032
- Figure 74: South America Soft gel Capsules Industry Volume Share (%), by Type 2024 & 2032
- Figure 75: South America Soft gel Capsules Industry Revenue (Million), by Application 2024 & 2032
- Figure 76: South America Soft gel Capsules Industry Volume (K Unit), by Application 2024 & 2032
- Figure 77: South America Soft gel Capsules Industry Revenue Share (%), by Application 2024 & 2032
- Figure 78: South America Soft gel Capsules Industry Volume Share (%), by Application 2024 & 2032
- Figure 79: South America Soft gel Capsules Industry Revenue (Million), by Country 2024 & 2032
- Figure 80: South America Soft gel Capsules Industry Volume (K Unit), by Country 2024 & 2032
- Figure 81: South America Soft gel Capsules Industry Revenue Share (%), by Country 2024 & 2032
- Figure 82: South America Soft gel Capsules Industry Volume Share (%), by Country 2024 & 2032
List of Tables
- Table 1: Global Soft gel Capsules Industry Revenue Million Forecast, by Region 2019 & 2032
- Table 2: Global Soft gel Capsules Industry Volume K Unit Forecast, by Region 2019 & 2032
- Table 3: Global Soft gel Capsules Industry Revenue Million Forecast, by Type 2019 & 2032
- Table 4: Global Soft gel Capsules Industry Volume K Unit Forecast, by Type 2019 & 2032
- Table 5: Global Soft gel Capsules Industry Revenue Million Forecast, by Application 2019 & 2032
- Table 6: Global Soft gel Capsules Industry Volume K Unit Forecast, by Application 2019 & 2032
- Table 7: Global Soft gel Capsules Industry Revenue Million Forecast, by Region 2019 & 2032
- Table 8: Global Soft gel Capsules Industry Volume K Unit Forecast, by Region 2019 & 2032
- Table 9: Global Soft gel Capsules Industry Revenue Million Forecast, by Country 2019 & 2032
- Table 10: Global Soft gel Capsules Industry Volume K Unit Forecast, by Country 2019 & 2032
- Table 11: United States Soft gel Capsules Industry Revenue (Million) Forecast, by Application 2019 & 2032
- Table 12: United States Soft gel Capsules Industry Volume (K Unit) Forecast, by Application 2019 & 2032
- Table 13: Canada Soft gel Capsules Industry Revenue (Million) Forecast, by Application 2019 & 2032
- Table 14: Canada Soft gel Capsules Industry Volume (K Unit) Forecast, by Application 2019 & 2032
- Table 15: Mexico Soft gel Capsules Industry Revenue (Million) Forecast, by Application 2019 & 2032
- Table 16: Mexico Soft gel Capsules Industry Volume (K Unit) Forecast, by Application 2019 & 2032
- Table 17: Global Soft gel Capsules Industry Revenue Million Forecast, by Country 2019 & 2032
- Table 18: Global Soft gel Capsules Industry Volume K Unit Forecast, by Country 2019 & 2032
- Table 19: Germany Soft gel Capsules Industry Revenue (Million) Forecast, by Application 2019 & 2032
- Table 20: Germany Soft gel Capsules Industry Volume (K Unit) Forecast, by Application 2019 & 2032
- Table 21: United Kingdom Soft gel Capsules Industry Revenue (Million) Forecast, by Application 2019 & 2032
- Table 22: United Kingdom Soft gel Capsules Industry Volume (K Unit) Forecast, by Application 2019 & 2032
- Table 23: France Soft gel Capsules Industry Revenue (Million) Forecast, by Application 2019 & 2032
- Table 24: France Soft gel Capsules Industry Volume (K Unit) Forecast, by Application 2019 & 2032
- Table 25: Italy Soft gel Capsules Industry Revenue (Million) Forecast, by Application 2019 & 2032
- Table 26: Italy Soft gel Capsules Industry Volume (K Unit) Forecast, by Application 2019 & 2032
- Table 27: Spain Soft gel Capsules Industry Revenue (Million) Forecast, by Application 2019 & 2032
- Table 28: Spain Soft gel Capsules Industry Volume (K Unit) Forecast, by Application 2019 & 2032
- Table 29: Rest of Europe Soft gel Capsules Industry Revenue (Million) Forecast, by Application 2019 & 2032
- Table 30: Rest of Europe Soft gel Capsules Industry Volume (K Unit) Forecast, by Application 2019 & 2032
- Table 31: Global Soft gel Capsules Industry Revenue Million Forecast, by Country 2019 & 2032
- Table 32: Global Soft gel Capsules Industry Volume K Unit Forecast, by Country 2019 & 2032
- Table 33: China Soft gel Capsules Industry Revenue (Million) Forecast, by Application 2019 & 2032
- Table 34: China Soft gel Capsules Industry Volume (K Unit) Forecast, by Application 2019 & 2032
- Table 35: Japan Soft gel Capsules Industry Revenue (Million) Forecast, by Application 2019 & 2032
- Table 36: Japan Soft gel Capsules Industry Volume (K Unit) Forecast, by Application 2019 & 2032
- Table 37: India Soft gel Capsules Industry Revenue (Million) Forecast, by Application 2019 & 2032
- Table 38: India Soft gel Capsules Industry Volume (K Unit) Forecast, by Application 2019 & 2032
- Table 39: Australia Soft gel Capsules Industry Revenue (Million) Forecast, by Application 2019 & 2032
- Table 40: Australia Soft gel Capsules Industry Volume (K Unit) Forecast, by Application 2019 & 2032
- Table 41: South Korea Soft gel Capsules Industry Revenue (Million) Forecast, by Application 2019 & 2032
- Table 42: South Korea Soft gel Capsules Industry Volume (K Unit) Forecast, by Application 2019 & 2032
- Table 43: Rest of Asia Pacific Soft gel Capsules Industry Revenue (Million) Forecast, by Application 2019 & 2032
- Table 44: Rest of Asia Pacific Soft gel Capsules Industry Volume (K Unit) Forecast, by Application 2019 & 2032
- Table 45: Global Soft gel Capsules Industry Revenue Million Forecast, by Country 2019 & 2032
- Table 46: Global Soft gel Capsules Industry Volume K Unit Forecast, by Country 2019 & 2032
- Table 47: GCC Soft gel Capsules Industry Revenue (Million) Forecast, by Application 2019 & 2032
- Table 48: GCC Soft gel Capsules Industry Volume (K Unit) Forecast, by Application 2019 & 2032
- Table 49: South Africa Soft gel Capsules Industry Revenue (Million) Forecast, by Application 2019 & 2032
- Table 50: South Africa Soft gel Capsules Industry Volume (K Unit) Forecast, by Application 2019 & 2032
- Table 51: Rest of Middle East and Africa Soft gel Capsules Industry Revenue (Million) Forecast, by Application 2019 & 2032
- Table 52: Rest of Middle East and Africa Soft gel Capsules Industry Volume (K Unit) Forecast, by Application 2019 & 2032
- Table 53: Global Soft gel Capsules Industry Revenue Million Forecast, by Country 2019 & 2032
- Table 54: Global Soft gel Capsules Industry Volume K Unit Forecast, by Country 2019 & 2032
- Table 55: Brazil Soft gel Capsules Industry Revenue (Million) Forecast, by Application 2019 & 2032
- Table 56: Brazil Soft gel Capsules Industry Volume (K Unit) Forecast, by Application 2019 & 2032
- Table 57: Argentina Soft gel Capsules Industry Revenue (Million) Forecast, by Application 2019 & 2032
- Table 58: Argentina Soft gel Capsules Industry Volume (K Unit) Forecast, by Application 2019 & 2032
- Table 59: Rest of South America Soft gel Capsules Industry Revenue (Million) Forecast, by Application 2019 & 2032
- Table 60: Rest of South America Soft gel Capsules Industry Volume (K Unit) Forecast, by Application 2019 & 2032
- Table 61: Global Soft gel Capsules Industry Revenue Million Forecast, by Type 2019 & 2032
- Table 62: Global Soft gel Capsules Industry Volume K Unit Forecast, by Type 2019 & 2032
- Table 63: Global Soft gel Capsules Industry Revenue Million Forecast, by Application 2019 & 2032
- Table 64: Global Soft gel Capsules Industry Volume K Unit Forecast, by Application 2019 & 2032
- Table 65: Global Soft gel Capsules Industry Revenue Million Forecast, by Country 2019 & 2032
- Table 66: Global Soft gel Capsules Industry Volume K Unit Forecast, by Country 2019 & 2032
- Table 67: United States Soft gel Capsules Industry Revenue (Million) Forecast, by Application 2019 & 2032
- Table 68: United States Soft gel Capsules Industry Volume (K Unit) Forecast, by Application 2019 & 2032
- Table 69: Canada Soft gel Capsules Industry Revenue (Million) Forecast, by Application 2019 & 2032
- Table 70: Canada Soft gel Capsules Industry Volume (K Unit) Forecast, by Application 2019 & 2032
- Table 71: Mexico Soft gel Capsules Industry Revenue (Million) Forecast, by Application 2019 & 2032
- Table 72: Mexico Soft gel Capsules Industry Volume (K Unit) Forecast, by Application 2019 & 2032
- Table 73: Global Soft gel Capsules Industry Revenue Million Forecast, by Type 2019 & 2032
- Table 74: Global Soft gel Capsules Industry Volume K Unit Forecast, by Type 2019 & 2032
- Table 75: Global Soft gel Capsules Industry Revenue Million Forecast, by Application 2019 & 2032
- Table 76: Global Soft gel Capsules Industry Volume K Unit Forecast, by Application 2019 & 2032
- Table 77: Global Soft gel Capsules Industry Revenue Million Forecast, by Country 2019 & 2032
- Table 78: Global Soft gel Capsules Industry Volume K Unit Forecast, by Country 2019 & 2032
- Table 79: Germany Soft gel Capsules Industry Revenue (Million) Forecast, by Application 2019 & 2032
- Table 80: Germany Soft gel Capsules Industry Volume (K Unit) Forecast, by Application 2019 & 2032
- Table 81: United Kingdom Soft gel Capsules Industry Revenue (Million) Forecast, by Application 2019 & 2032
- Table 82: United Kingdom Soft gel Capsules Industry Volume (K Unit) Forecast, by Application 2019 & 2032
- Table 83: France Soft gel Capsules Industry Revenue (Million) Forecast, by Application 2019 & 2032
- Table 84: France Soft gel Capsules Industry Volume (K Unit) Forecast, by Application 2019 & 2032
- Table 85: Italy Soft gel Capsules Industry Revenue (Million) Forecast, by Application 2019 & 2032
- Table 86: Italy Soft gel Capsules Industry Volume (K Unit) Forecast, by Application 2019 & 2032
- Table 87: Spain Soft gel Capsules Industry Revenue (Million) Forecast, by Application 2019 & 2032
- Table 88: Spain Soft gel Capsules Industry Volume (K Unit) Forecast, by Application 2019 & 2032
- Table 89: Rest of Europe Soft gel Capsules Industry Revenue (Million) Forecast, by Application 2019 & 2032
- Table 90: Rest of Europe Soft gel Capsules Industry Volume (K Unit) Forecast, by Application 2019 & 2032
- Table 91: Global Soft gel Capsules Industry Revenue Million Forecast, by Type 2019 & 2032
- Table 92: Global Soft gel Capsules Industry Volume K Unit Forecast, by Type 2019 & 2032
- Table 93: Global Soft gel Capsules Industry Revenue Million Forecast, by Application 2019 & 2032
- Table 94: Global Soft gel Capsules Industry Volume K Unit Forecast, by Application 2019 & 2032
- Table 95: Global Soft gel Capsules Industry Revenue Million Forecast, by Country 2019 & 2032
- Table 96: Global Soft gel Capsules Industry Volume K Unit Forecast, by Country 2019 & 2032
- Table 97: China Soft gel Capsules Industry Revenue (Million) Forecast, by Application 2019 & 2032
- Table 98: China Soft gel Capsules Industry Volume (K Unit) Forecast, by Application 2019 & 2032
- Table 99: Japan Soft gel Capsules Industry Revenue (Million) Forecast, by Application 2019 & 2032
- Table 100: Japan Soft gel Capsules Industry Volume (K Unit) Forecast, by Application 2019 & 2032
- Table 101: India Soft gel Capsules Industry Revenue (Million) Forecast, by Application 2019 & 2032
- Table 102: India Soft gel Capsules Industry Volume (K Unit) Forecast, by Application 2019 & 2032
- Table 103: Australia Soft gel Capsules Industry Revenue (Million) Forecast, by Application 2019 & 2032
- Table 104: Australia Soft gel Capsules Industry Volume (K Unit) Forecast, by Application 2019 & 2032
- Table 105: South Korea Soft gel Capsules Industry Revenue (Million) Forecast, by Application 2019 & 2032
- Table 106: South Korea Soft gel Capsules Industry Volume (K Unit) Forecast, by Application 2019 & 2032
- Table 107: Rest of Asia Pacific Soft gel Capsules Industry Revenue (Million) Forecast, by Application 2019 & 2032
- Table 108: Rest of Asia Pacific Soft gel Capsules Industry Volume (K Unit) Forecast, by Application 2019 & 2032
- Table 109: Global Soft gel Capsules Industry Revenue Million Forecast, by Type 2019 & 2032
- Table 110: Global Soft gel Capsules Industry Volume K Unit Forecast, by Type 2019 & 2032
- Table 111: Global Soft gel Capsules Industry Revenue Million Forecast, by Application 2019 & 2032
- Table 112: Global Soft gel Capsules Industry Volume K Unit Forecast, by Application 2019 & 2032
- Table 113: Global Soft gel Capsules Industry Revenue Million Forecast, by Country 2019 & 2032
- Table 114: Global Soft gel Capsules Industry Volume K Unit Forecast, by Country 2019 & 2032
- Table 115: GCC Soft gel Capsules Industry Revenue (Million) Forecast, by Application 2019 & 2032
- Table 116: GCC Soft gel Capsules Industry Volume (K Unit) Forecast, by Application 2019 & 2032
- Table 117: South Africa Soft gel Capsules Industry Revenue (Million) Forecast, by Application 2019 & 2032
- Table 118: South Africa Soft gel Capsules Industry Volume (K Unit) Forecast, by Application 2019 & 2032
- Table 119: Rest of Middle East and Africa Soft gel Capsules Industry Revenue (Million) Forecast, by Application 2019 & 2032
- Table 120: Rest of Middle East and Africa Soft gel Capsules Industry Volume (K Unit) Forecast, by Application 2019 & 2032
- Table 121: Global Soft gel Capsules Industry Revenue Million Forecast, by Type 2019 & 2032
- Table 122: Global Soft gel Capsules Industry Volume K Unit Forecast, by Type 2019 & 2032
- Table 123: Global Soft gel Capsules Industry Revenue Million Forecast, by Application 2019 & 2032
- Table 124: Global Soft gel Capsules Industry Volume K Unit Forecast, by Application 2019 & 2032
- Table 125: Global Soft gel Capsules Industry Revenue Million Forecast, by Country 2019 & 2032
- Table 126: Global Soft gel Capsules Industry Volume K Unit Forecast, by Country 2019 & 2032
- Table 127: Brazil Soft gel Capsules Industry Revenue (Million) Forecast, by Application 2019 & 2032
- Table 128: Brazil Soft gel Capsules Industry Volume (K Unit) Forecast, by Application 2019 & 2032
- Table 129: Argentina Soft gel Capsules Industry Revenue (Million) Forecast, by Application 2019 & 2032
- Table 130: Argentina Soft gel Capsules Industry Volume (K Unit) Forecast, by Application 2019 & 2032
- Table 131: Rest of South America Soft gel Capsules Industry Revenue (Million) Forecast, by Application 2019 & 2032
- Table 132: Rest of South America Soft gel Capsules Industry Volume (K Unit) Forecast, by Application 2019 & 2032
Frequently Asked Questions
1. What is the projected Compound Annual Growth Rate (CAGR) of the Soft gel Capsules Industry?
The projected CAGR is approximately 7.70%.
2. Which companies are prominent players in the Soft gel Capsules Industry?
Key companies in the market include EuroCaps, CAPTEK, fortunelabs, Aenova Group, SaintyCo, Procaps, Sirio Pharma, United Laboratories, Fuji Capsule Co Ltd, Soft Gel Technologies Inc, MEDGEL.
3. What are the main segments of the Soft gel Capsules Industry?
The market segments include Type, Application.
4. Can you provide details about the market size?
The market size is estimated to be USD XX Million as of 2022.
5. What are some drivers contributing to market growth?
Technological Advancements and Increasing R&D Activities; Growing Demand from Health-conscious Consumers.
6. What are the notable trends driving market growth?
Pharmaceutical Segment is Expected to Hold a Significant Market Share Over the Forecast Period.
7. Are there any restraints impacting market growth?
Drawbacks Associated with Softgel Capsules.
8. Can you provide examples of recent developments in the market?
In May 2022, Windzor Pharma Ltd launched Rx Vitamin D3 product Solferol Softgel capsules in the Irish market. It is one of the low-cost Solferol Softgel Vitamin D3 capsules.
9. What pricing options are available for accessing the report?
Pricing options include single-user, multi-user, and enterprise licenses priced at USD 4750, USD 5250, and USD 8750 respectively.
10. Is the market size provided in terms of value or volume?
The market size is provided in terms of value, measured in Million and volume, measured in K Unit.
11. Are there any specific market keywords associated with the report?
Yes, the market keyword associated with the report is "Soft gel Capsules Industry," which aids in identifying and referencing the specific market segment covered.
12. How do I determine which pricing option suits my needs best?
The pricing options vary based on user requirements and access needs. Individual users may opt for single-user licenses, while businesses requiring broader access may choose multi-user or enterprise licenses for cost-effective access to the report.
13. Are there any additional resources or data provided in the Soft gel Capsules Industry report?
While the report offers comprehensive insights, it's advisable to review the specific contents or supplementary materials provided to ascertain if additional resources or data are available.
14. How can I stay updated on further developments or reports in the Soft gel Capsules Industry?
To stay informed about further developments, trends, and reports in the Soft gel Capsules Industry, consider subscribing to industry newsletters, following relevant companies and organizations, or regularly checking reputable industry news sources and publications.
Methodology
Step 1 - Identification of Relevant Samples Size from Population Database


Step 2 - Approaches for Defining Global Market Size (Value, Volume* & Price*)

Note*: In applicable scenarios
Step 3 - Data Sources
Primary Research
- Web Analytics
- Survey Reports
- Research Institute
- Latest Research Reports
- Opinion Leaders
Secondary Research
- Annual Reports
- White Paper
- Latest Press Release
- Industry Association
- Paid Database
- Investor Presentations

Step 4 - Data Triangulation
Involves using different sources of information in order to increase the validity of a study
These sources are likely to be stakeholders in a program - participants, other researchers, program staff, other community members, and so on.
Then we put all data in single framework & apply various statistical tools to find out the dynamic on the market.
During the analysis stage, feedback from the stakeholder groups would be compared to determine areas of agreement as well as areas of divergence


