

Key Insights
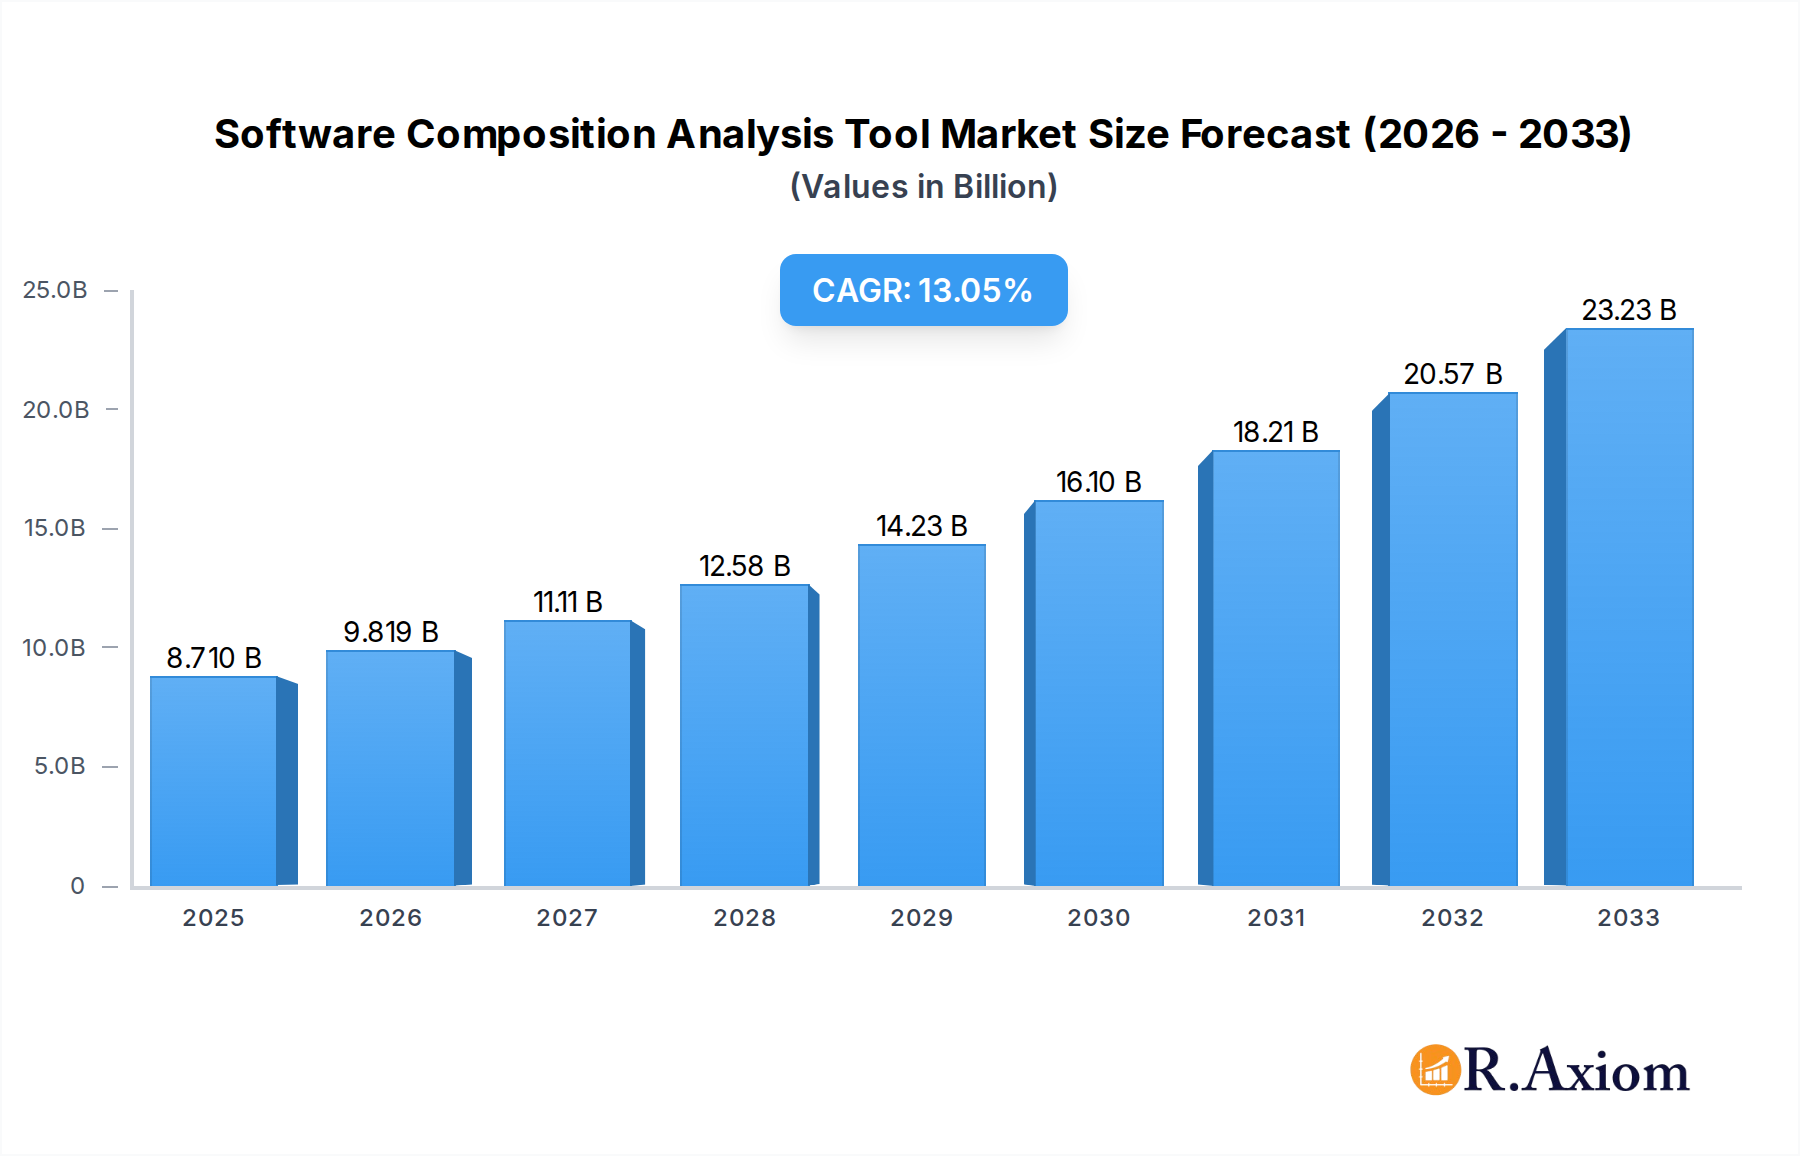
The Software Composition Analysis (SCA) tool market is poised for significant expansion, driven by an increasing emphasis on software supply chain security and the growing complexity of modern software development. With a projected market size of $8.71 billion in 2025, the industry is expected to witness a robust CAGR of 12.49% throughout the forecast period of 2025-2033. This substantial growth is fueled by several key factors. The escalating number of cyber threats and data breaches, often originating from vulnerabilities within open-source components, is compelling organizations of all sizes to adopt SCA solutions. Furthermore, stringent regulatory compliance requirements, such as those mandated by GDPR and emerging data privacy laws, necessitate thorough scanning and management of software dependencies to ensure adherence. The rise of DevSecOps practices, integrating security into every stage of the development lifecycle, also positions SCA tools as an indispensable component for early vulnerability detection and remediation.

Software Composition Analysis Tool Market Size (In Billion)
The market is segmented to cater to diverse user needs, with applications ranging from individual solo developers seeking to secure their personal projects to large DevOps teams managing complex enterprise-level applications. The dominant application segment is expected to be Large DevOps Teams, reflecting the enterprise's growing need for comprehensive SCA solutions. In terms of deployment, cloud-based SCA tools are anticipated to lead the market due to their scalability, cost-effectiveness, and ease of integration. However, on-premises solutions will continue to hold a significant share, particularly among organizations with strict data sovereignty or security policies. Geographically, North America and Europe are expected to remain the largest markets, owing to early adoption of security technologies and a mature regulatory landscape. The Asia Pacific region, however, is predicted to exhibit the fastest growth, driven by increasing digitalization and a rising awareness of cybersecurity risks. Key players like GitLab, GitHub, WhiteSource Software, Synopsys, and Snyk are at the forefront of innovation, offering advanced capabilities in vulnerability detection, license compliance, and automated remediation.
Software Composition Analysis Tool Company Market Share
Unveiling the Software Composition Analysis Tool Market: A Comprehensive Report Description
This detailed report provides an in-depth analysis of the global Software Composition Analysis (SCA) Tool market, offering strategic insights for stakeholders across the cybersecurity and software development landscape. Covering the study period of 2019–2033, with a base year of 2025, this report delves into market dynamics, key players, emerging trends, and future projections. Our comprehensive research illuminates the critical role of SCA tools in managing open-source software (OSS) risks and ensuring application security in today's rapidly evolving technological environment.
Software Composition Analysis Tool Market Concentration & Innovation
The Software Composition Analysis (SCA) Tool market exhibits a dynamic landscape characterized by both intense competition and significant innovation. Market concentration is moderately fragmented, with several major players vying for dominance, alongside a growing number of specialized vendors. This fragmentation is driven by the increasing demand for comprehensive security solutions and the continuous evolution of software development practices, particularly the widespread adoption of open-source components. Innovation in the SCA sector is primarily fueled by the escalating sophistication of cyber threats and the need for more automated and integrated security workflows. Key drivers of innovation include advancements in artificial intelligence (AI) and machine learning (ML) for enhanced vulnerability detection, improved license compliance checking, and more granular policy enforcement. Regulatory frameworks are also playing a pivotal role, with mandates around software bill of materials (SBOMs) and supply chain security compelling organizations to adopt robust SCA solutions. Product substitutes are emerging, primarily in the form of integrated security platforms that bundle SCA capabilities with other DevSecOps tools. However, dedicated SCA solutions continue to offer specialized depth and expertise. End-user trends are shifting towards proactive security measures integrated earlier in the development lifecycle (shift-left security) and a greater emphasis on continuous monitoring and automated remediation. Mergers and acquisitions (M&A) activity is a significant indicator of market maturation and strategic consolidation. Recent M&A deal values have reached into the billions, reflecting the strategic importance of acquiring advanced SCA capabilities. For instance, key players like Sonatype and Snyk have been active in strategic acquisitions to expand their market reach and technology portfolios. The market share distribution indicates a strong presence of established vendors, but the agility of newer entrants in addressing niche requirements is also noteworthy.
Software Composition Analysis Tool Industry Trends & Insights
The Software Composition Analysis (SCA) Tool industry is experiencing robust growth, propelled by a confluence of critical trends and evolving market demands. The escalating adoption of open-source software (OSS) across all sectors of the software development lifecycle has become a primary growth driver. While OSS offers significant benefits in terms of cost-efficiency and faster development cycles, it also introduces inherent security and licensing risks that SCA tools are uniquely positioned to address. This has led to an estimated Compound Annual Growth Rate (CAGR) of approximately 20% in the forecast period, with market penetration reaching over 80% among enterprises by 2028. Technological disruptions are profoundly shaping the SCA landscape. The rise of AI and ML algorithms is enhancing the accuracy and speed of vulnerability detection, allowing for proactive identification of zero-day threats and sophisticated malware embedded within OSS components. Furthermore, the integration of SCA tools into CI/CD pipelines and DevOps workflows is becoming standard practice, enabling developers to address security issues early in the development process, a concept known as "shift-left" security. Consumer preferences are increasingly favoring SCA solutions that offer seamless integration, user-friendly interfaces, and comprehensive reporting capabilities. Organizations are demanding greater visibility into their software supply chain, seeking tools that can not only identify vulnerabilities but also provide actionable remediation guidance and ensure strict adherence to intellectual property (IP) and license compliance. Competitive dynamics are characterized by a blend of established cybersecurity giants and agile, specialized SCA vendors. Key players are differentiating themselves through advanced feature sets, broader language and framework support, and deeper integration with other developer tools. The growing emphasis on supply chain security, driven by high-profile breaches, is further accelerating the demand for sophisticated SCA solutions. The market is projected to reach a valuation in the tens of billions by 2030, reflecting the indispensable nature of these tools in modern software development.
Dominant Markets & Segments in Software Composition Analysis Tool
The Software Composition Analysis (SCA) Tool market's dominance is largely dictated by specific regions, countries, and application/deployment segments that are at the forefront of digital transformation and cybersecurity adoption. Geographically, North America, particularly the United States, continues to be a dominant market due to its early adoption of advanced technologies, stringent cybersecurity regulations, and a robust ecosystem of software development companies. Europe, with countries like Germany, the UK, and France, follows closely, driven by increasing regulatory pressure and a growing awareness of software supply chain risks. The Asia-Pacific region is emerging as a high-growth market, fueled by rapid digital transformation initiatives and a burgeoning software development sector in countries like India, China, and South Korea.
Within application segments:
- Large DevOps Teams: This segment represents a significant portion of the SCA Tool market.
- Key Drivers: The sheer volume of code, the complexity of modern applications, and the continuous integration/continuous delivery (CI/CD) pipelines prevalent in large organizations necessitate robust and automated SCA solutions to manage security at scale. Economic policies supporting digital innovation and infrastructure investments in cloud computing further bolster adoption.
- Dominance Analysis: Large DevOps teams are the primary consumers of SCA tools due to their critical need for efficient, scalable, and integrated security solutions. They often have dedicated security teams and budgets to invest in comprehensive SCA platforms that can manage the risks associated with thousands of open-source components across numerous projects. The adoption of DevSecOps practices is also a strong indicator of their reliance on such tools.
Within deployment types:
Cloud-based: This deployment model is experiencing rapid growth and is increasingly becoming the preferred choice.
- Key Drivers: Scalability, accessibility, and reduced infrastructure overhead are major advantages of cloud-based SCA solutions. The "as-a-service" model aligns well with the agile and dynamic nature of modern software development.
- Dominance Analysis: Cloud-based SCA solutions offer unparalleled flexibility and can be easily integrated into existing cloud-native development environments. Their ability to provide real-time scanning and continuous monitoring makes them ideal for organizations leveraging cloud infrastructure. The ease of deployment and updates also contributes to their dominance, allowing organizations to stay ahead of evolving threats without significant IT overhead.
On-premises: While still relevant, this segment is seeing a slower growth rate compared to cloud-based solutions.
- Key Drivers: Organizations with strict data sovereignty requirements or legacy systems may opt for on-premises deployments.
- Dominance Analysis: On-premises solutions are typically chosen by organizations that require absolute control over their data and infrastructure, often due to regulatory compliance or long-standing security policies. However, the operational burden and the need for constant updates can sometimes be a deterrent compared to the convenience of cloud offerings. The market share in this segment is gradually being eroded by the pervasive advantages of cloud-based SCA.
Software Composition Analysis Tool Product Developments
Product developments in the Software Composition Analysis (SCA) Tool market are heavily focused on enhancing automation, accuracy, and integration capabilities. Innovations are geared towards providing deeper insights into software supply chain risks, including advanced vulnerability detection, comprehensive license compliance, and identification of architectural flaws. Competitive advantages are being forged through seamless integration with CI/CD pipelines, IDEs, and other DevSecOps tools, enabling developers to address security issues earlier in the development lifecycle. Technological trends driving these developments include the application of AI and ML for more intelligent threat analysis and predictive vulnerability management, alongside the increasing demand for Software Bill of Materials (SBOM) generation and management to meet emerging regulatory requirements.
Report Scope & Segmentation Analysis
This report meticulously segments the global Software Composition Analysis (SCA) Tool market to provide granular insights into its diverse landscape. The segmentation is analyzed across key dimensions, including application types and deployment models, ensuring comprehensive coverage for all stakeholders.
Application:
- Solo Developers: This segment, while smaller in overall market share, is crucial for understanding the adoption of SCA at the individual developer level. These users often seek cost-effective, easy-to-use tools with strong community support, prioritizing basic vulnerability scanning and license compliance for personal or small-scale projects.
- Small Development Teams: These teams typically require scalable and integrated solutions that can support a growing number of projects without overwhelming their resources. They often prioritize affordability and ease of integration with their existing development workflows.
- Large DevOps Teams: This segment constitutes a significant portion of the market, driven by the need for robust, automated, and highly scalable SCA solutions to manage the complexities of enterprise-level application development and the widespread adoption of DevSecOps practices.
Type:
- Cloud-based: This segment is projected to witness the highest growth, driven by its inherent scalability, flexibility, and cost-effectiveness. Cloud-based SCA tools offer continuous monitoring and seamless integration into cloud-native environments, catering to the dynamic needs of modern software development.
- On-premises: While still relevant for organizations with specific data sovereignty or security concerns, this segment's growth is more moderate. On-premises solutions appeal to enterprises requiring absolute control over their infrastructure and data, often within highly regulated industries.
Key Drivers of Software Composition Analysis Tool Growth
The Software Composition Analysis (SCA) Tool market is experiencing significant growth driven by several interconnected factors. Firstly, the pervasive and ever-increasing adoption of open-source software (OSS) across all industries necessitates robust tools to manage the associated security and licensing risks. Secondly, heightened cybersecurity threats and high-profile software supply chain breaches are compelling organizations to prioritize application security and gain visibility into their codebases. Regulatory mandates, such as the increasing emphasis on Software Bills of Materials (SBOMs) and supply chain security directives from governmental bodies, are a major catalyst. Furthermore, the widespread adoption of DevSecOps practices and the "shift-left" security movement are pushing for the integration of SCA tools early in the development lifecycle, making them an indispensable part of the modern development workflow.
Challenges in the Software Composition Analysis Tool Sector
Despite its robust growth, the Software Composition Analysis (SCA) Tool sector faces several significant challenges. A primary hurdle is the sheer complexity and sheer volume of open-source components, making comprehensive analysis and accurate identification of all potential risks a difficult task. The constant evolution of new vulnerabilities and the emergence of novel attack vectors require continuous updates and sophisticated detection mechanisms, placing a burden on both tool providers and users. Another challenge lies in the integration of SCA tools into diverse and often fragmented development environments, which can lead to interoperability issues and increased implementation complexity. Furthermore, the cost of advanced SCA solutions, coupled with the need for skilled personnel to interpret and act upon the findings, can be a barrier for smaller organizations. Competitive pressures also drive down pricing, making it challenging for vendors to recoup R&D investments.
Emerging Opportunities in Software Composition Analysis Tool
The Software Composition Analysis (SCA) Tool market is ripe with emerging opportunities driven by technological advancements and evolving market needs. The increasing demand for AI-powered SCA solutions that can proactively identify zero-day vulnerabilities and predict future risks presents a significant opportunity. The growing emphasis on supply chain security and the push for standardized SBOM generation across industries, particularly within government and critical infrastructure sectors, opens new avenues for specialized SCA tools. Furthermore, the expansion of SCA capabilities into emerging technologies like containers, serverless computing, and edge devices offers substantial growth potential. The development of more integrated and automated DevSecOps platforms that seamlessly incorporate SCA functionalities also represents a key opportunity for vendors looking to offer end-to-end security solutions.
Leading Players in the Software Composition Analysis Tool Market
- GitLab
- GitHub
- WhiteSource Software
- Synopsys
- Snyk
- CAST
- Contrast Security
- Threatwatch
- Bytesafe
- JFrog
- Argon Security
- Revenera
- Veracode
- Active State
- BluBracket
- Debricked
- OWASP
- FOSSA
- Hoss
- MergeBase Software
- Sonatype
- rezilion
- SCANOSS
- ShiftLeft
- SOOS
- SourceClear
- Timesys
- WhiteHat Security
Key Developments in Software Composition Analysis Tool Industry
- 2024/Q1: Launch of advanced AI-driven vulnerability prediction capabilities by several leading SCA vendors, enabling proactive threat identification.
- 2023/Q4: Increased focus on comprehensive Software Bill of Materials (SBOM) generation and management features to comply with emerging governmental mandates.
- 2023/Q3: Several strategic partnerships formed between SCA providers and cloud security platforms to offer integrated DevSecOps solutions.
- 2022/Q2: Acquisition of smaller SCA companies by major cybersecurity firms to expand market share and technology portfolios, indicating market consolidation.
- 2021/Q1: Significant advancements in language and framework support by key players, broadening the applicability of SCA tools across diverse development stacks.
- 2020/Q4: Enhanced capabilities for container security scanning and analysis integrated into mainstream SCA platforms.
- 2019/Q2: Growing adoption of SCA tools by enterprise-level organizations in response to rising concerns about the security of their software supply chains.
Strategic Outlook for Software Composition Analysis Tool Market
The strategic outlook for the Software Composition Analysis (SCA) Tool market remains exceptionally positive, driven by the indispensable role these tools play in securing modern software development. The continuous growth in open-source software adoption, coupled with an ever-escalating threat landscape, ensures sustained demand. The increasing regulatory pressure for supply chain transparency and the widespread adoption of DevSecOps practices are powerful growth catalysts. Future market expansion will likely be characterized by deeper AI/ML integration for predictive security, enhanced automation of remediation workflows, and more comprehensive SBOM management capabilities. Vendors that can offer seamless integration, broad coverage, and actionable insights will be best positioned to capitalize on the projected market growth, reaching a valuation in the tens of billions over the forecast period.
Software Composition Analysis Tool Segmentation
-
1. Application
- 1.1. Solo Developers
- 1.2. Small Development Teams
- 1.3. Large Devops Teams
-
2. Type
- 2.1. Cloud-based
- 2.2. On-premises
Software Composition Analysis Tool Segmentation By Geography
-
1. North America
- 1.1. United States
- 1.2. Canada
- 1.3. Mexico
-
2. South America
- 2.1. Brazil
- 2.2. Argentina
- 2.3. Rest of South America
-
3. Europe
- 3.1. United Kingdom
- 3.2. Germany
- 3.3. France
- 3.4. Italy
- 3.5. Spain
- 3.6. Russia
- 3.7. Benelux
- 3.8. Nordics
- 3.9. Rest of Europe
-
4. Middle East & Africa
- 4.1. Turkey
- 4.2. Israel
- 4.3. GCC
- 4.4. North Africa
- 4.5. South Africa
- 4.6. Rest of Middle East & Africa
-
5. Asia Pacific
- 5.1. China
- 5.2. India
- 5.3. Japan
- 5.4. South Korea
- 5.5. ASEAN
- 5.6. Oceania
- 5.7. Rest of Asia Pacific

Software Composition Analysis Tool Regional Market Share
Geographic Coverage of Software Composition Analysis Tool
Software Composition Analysis Tool REPORT HIGHLIGHTS
| Aspects | Details |
|---|---|
| Study Period | 2020-2034 |
| Base Year | 2025 |
| Estimated Year | 2026 |
| Forecast Period | 2026-2034 |
| Historical Period | 2020-2025 |
| Growth Rate | CAGR of 12.49% from 2020-2034 |
| Segmentation |
|
Table of Contents
- 1. Introduction
- 1.1. Research Scope
- 1.2. Market Segmentation
- 1.3. Research Objective
- 1.4. Definitions and Assumptions
- 2. Executive Summary
- 2.1. Market Snapshot
- 3. Market Dynamics
- 3.1. Market Drivers
- 3.2. Market Restrains
- 3.3. Market Trends
- 3.4. Market Opportunities
- 4. Market Factor Analysis
- 4.1. Porters Five Forces
- 4.1.1. Bargaining Power of Suppliers
- 4.1.2. Bargaining Power of Buyers
- 4.1.3. Threat of New Entrants
- 4.1.4. Threat of Substitutes
- 4.1.5. Competitive Rivalry
- 4.2. PESTEL analysis
- 4.3. BCG Analysis
- 4.3.1. Stars (High Growth, High Market Share)
- 4.3.2. Cash Cows (Low Growth, High Market Share)
- 4.3.3. Question Mark (High Growth, Low Market Share)
- 4.3.4. Dogs (Low Growth, Low Market Share)
- 4.4. Ansoff Matrix Analysis
- 4.5. Supply Chain Analysis
- 4.6. Regulatory Landscape
- 4.7. Current Market Potential and Opportunity Assessment (TAM–SAM–SOM Framework)
- 4.8. RAX Analyst Note
- 4.1. Porters Five Forces
- 5. Market Analysis, Insights and Forecast 2021-2033
- 5.1. Market Analysis, Insights and Forecast - by Application
- 5.1.1. Solo Developers
- 5.1.2. Small Development Teams
- 5.1.3. Large Devops Teams
- 5.2. Market Analysis, Insights and Forecast - by Type
- 5.2.1. Cloud-based
- 5.2.2. On-premises
- 5.3. Market Analysis, Insights and Forecast - by Region
- 5.3.1. North America
- 5.3.2. South America
- 5.3.3. Europe
- 5.3.4. Middle East & Africa
- 5.3.5. Asia Pacific
- 5.1. Market Analysis, Insights and Forecast - by Application
- 6. Global Software Composition Analysis Tool Analysis, Insights and Forecast, 2021-2033
- 6.1. Market Analysis, Insights and Forecast - by Application
- 6.1.1. Solo Developers
- 6.1.2. Small Development Teams
- 6.1.3. Large Devops Teams
- 6.2. Market Analysis, Insights and Forecast - by Type
- 6.2.1. Cloud-based
- 6.2.2. On-premises
- 6.1. Market Analysis, Insights and Forecast - by Application
- 7. North America Software Composition Analysis Tool Analysis, Insights and Forecast, 2020-2032
- 7.1. Market Analysis, Insights and Forecast - by Application
- 7.1.1. Solo Developers
- 7.1.2. Small Development Teams
- 7.1.3. Large Devops Teams
- 7.2. Market Analysis, Insights and Forecast - by Type
- 7.2.1. Cloud-based
- 7.2.2. On-premises
- 7.1. Market Analysis, Insights and Forecast - by Application
- 8. South America Software Composition Analysis Tool Analysis, Insights and Forecast, 2020-2032
- 8.1. Market Analysis, Insights and Forecast - by Application
- 8.1.1. Solo Developers
- 8.1.2. Small Development Teams
- 8.1.3. Large Devops Teams
- 8.2. Market Analysis, Insights and Forecast - by Type
- 8.2.1. Cloud-based
- 8.2.2. On-premises
- 8.1. Market Analysis, Insights and Forecast - by Application
- 9. Europe Software Composition Analysis Tool Analysis, Insights and Forecast, 2020-2032
- 9.1. Market Analysis, Insights and Forecast - by Application
- 9.1.1. Solo Developers
- 9.1.2. Small Development Teams
- 9.1.3. Large Devops Teams
- 9.2. Market Analysis, Insights and Forecast - by Type
- 9.2.1. Cloud-based
- 9.2.2. On-premises
- 9.1. Market Analysis, Insights and Forecast - by Application
- 10. Middle East & Africa Software Composition Analysis Tool Analysis, Insights and Forecast, 2020-2032
- 10.1. Market Analysis, Insights and Forecast - by Application
- 10.1.1. Solo Developers
- 10.1.2. Small Development Teams
- 10.1.3. Large Devops Teams
- 10.2. Market Analysis, Insights and Forecast - by Type
- 10.2.1. Cloud-based
- 10.2.2. On-premises
- 10.1. Market Analysis, Insights and Forecast - by Application
- 11. Asia Pacific Software Composition Analysis Tool Analysis, Insights and Forecast, 2020-2032
- 11.1. Market Analysis, Insights and Forecast - by Application
- 11.1.1. Solo Developers
- 11.1.2. Small Development Teams
- 11.1.3. Large Devops Teams
- 11.2. Market Analysis, Insights and Forecast - by Type
- 11.2.1. Cloud-based
- 11.2.2. On-premises
- 11.1. Market Analysis, Insights and Forecast - by Application
- 12. Competitive Analysis
- 12.1. Company Profiles
- 12.1.1 GitLab
- 12.1.1.1. Company Overview
- 12.1.1.2. Products
- 12.1.1.3. Company Financials
- 12.1.1.4. SWOT Analysis
- 12.1.2 GitHub
- 12.1.2.1. Company Overview
- 12.1.2.2. Products
- 12.1.2.3. Company Financials
- 12.1.2.4. SWOT Analysis
- 12.1.3 WhiteSource Software
- 12.1.3.1. Company Overview
- 12.1.3.2. Products
- 12.1.3.3. Company Financials
- 12.1.3.4. SWOT Analysis
- 12.1.4 Synopsys
- 12.1.4.1. Company Overview
- 12.1.4.2. Products
- 12.1.4.3. Company Financials
- 12.1.4.4. SWOT Analysis
- 12.1.5 Snyk
- 12.1.5.1. Company Overview
- 12.1.5.2. Products
- 12.1.5.3. Company Financials
- 12.1.5.4. SWOT Analysis
- 12.1.6 CAST
- 12.1.6.1. Company Overview
- 12.1.6.2. Products
- 12.1.6.3. Company Financials
- 12.1.6.4. SWOT Analysis
- 12.1.7 Contrast Security
- 12.1.7.1. Company Overview
- 12.1.7.2. Products
- 12.1.7.3. Company Financials
- 12.1.7.4. SWOT Analysis
- 12.1.8 Threatwatch
- 12.1.8.1. Company Overview
- 12.1.8.2. Products
- 12.1.8.3. Company Financials
- 12.1.8.4. SWOT Analysis
- 12.1.9 Bytesafe
- 12.1.9.1. Company Overview
- 12.1.9.2. Products
- 12.1.9.3. Company Financials
- 12.1.9.4. SWOT Analysis
- 12.1.10 JFrog
- 12.1.10.1. Company Overview
- 12.1.10.2. Products
- 12.1.10.3. Company Financials
- 12.1.10.4. SWOT Analysis
- 12.1.11 Argon Security
- 12.1.11.1. Company Overview
- 12.1.11.2. Products
- 12.1.11.3. Company Financials
- 12.1.11.4. SWOT Analysis
- 12.1.12 Revenera
- 12.1.12.1. Company Overview
- 12.1.12.2. Products
- 12.1.12.3. Company Financials
- 12.1.12.4. SWOT Analysis
- 12.1.13 Veracode
- 12.1.13.1. Company Overview
- 12.1.13.2. Products
- 12.1.13.3. Company Financials
- 12.1.13.4. SWOT Analysis
- 12.1.14 Active State
- 12.1.14.1. Company Overview
- 12.1.14.2. Products
- 12.1.14.3. Company Financials
- 12.1.14.4. SWOT Analysis
- 12.1.15 BluBracket
- 12.1.15.1. Company Overview
- 12.1.15.2. Products
- 12.1.15.3. Company Financials
- 12.1.15.4. SWOT Analysis
- 12.1.16 Debricked
- 12.1.16.1. Company Overview
- 12.1.16.2. Products
- 12.1.16.3. Company Financials
- 12.1.16.4. SWOT Analysis
- 12.1.17 OWASP
- 12.1.17.1. Company Overview
- 12.1.17.2. Products
- 12.1.17.3. Company Financials
- 12.1.17.4. SWOT Analysis
- 12.1.18 FOSSA
- 12.1.18.1. Company Overview
- 12.1.18.2. Products
- 12.1.18.3. Company Financials
- 12.1.18.4. SWOT Analysis
- 12.1.19 Hoss
- 12.1.19.1. Company Overview
- 12.1.19.2. Products
- 12.1.19.3. Company Financials
- 12.1.19.4. SWOT Analysis
- 12.1.20 MergeBase Software
- 12.1.20.1. Company Overview
- 12.1.20.2. Products
- 12.1.20.3. Company Financials
- 12.1.20.4. SWOT Analysis
- 12.1.21 Sonatype
- 12.1.21.1. Company Overview
- 12.1.21.2. Products
- 12.1.21.3. Company Financials
- 12.1.21.4. SWOT Analysis
- 12.1.22 rezilion
- 12.1.22.1. Company Overview
- 12.1.22.2. Products
- 12.1.22.3. Company Financials
- 12.1.22.4. SWOT Analysis
- 12.1.23 SCANOSS
- 12.1.23.1. Company Overview
- 12.1.23.2. Products
- 12.1.23.3. Company Financials
- 12.1.23.4. SWOT Analysis
- 12.1.24 ShiftLeft
- 12.1.24.1. Company Overview
- 12.1.24.2. Products
- 12.1.24.3. Company Financials
- 12.1.24.4. SWOT Analysis
- 12.1.25 SOOS
- 12.1.25.1. Company Overview
- 12.1.25.2. Products
- 12.1.25.3. Company Financials
- 12.1.25.4. SWOT Analysis
- 12.1.26 SourceClear
- 12.1.26.1. Company Overview
- 12.1.26.2. Products
- 12.1.26.3. Company Financials
- 12.1.26.4. SWOT Analysis
- 12.1.27 Timesys
- 12.1.27.1. Company Overview
- 12.1.27.2. Products
- 12.1.27.3. Company Financials
- 12.1.27.4. SWOT Analysis
- 12.1.28 WhiteHat Security
- 12.1.28.1. Company Overview
- 12.1.28.2. Products
- 12.1.28.3. Company Financials
- 12.1.28.4. SWOT Analysis
- 12.1.1 GitLab
- 12.2. Market Entropy
- 12.2.1 Company's Key Areas Served
- 12.2.2 Recent Developments
- 12.3. Company Market Share Analysis 2025
- 12.3.1 Top 5 Companies Market Share Analysis
- 12.3.2 Top 3 Companies Market Share Analysis
- 12.4. List of Potential Customers
- 13. Research Methodology
List of Figures
- Figure 1: Global Software Composition Analysis Tool Revenue Breakdown (undefined, %) by Region 2025 & 2033
- Figure 2: North America Software Composition Analysis Tool Revenue (undefined), by Application 2025 & 2033
- Figure 3: North America Software Composition Analysis Tool Revenue Share (%), by Application 2025 & 2033
- Figure 4: North America Software Composition Analysis Tool Revenue (undefined), by Type 2025 & 2033
- Figure 5: North America Software Composition Analysis Tool Revenue Share (%), by Type 2025 & 2033
- Figure 6: North America Software Composition Analysis Tool Revenue (undefined), by Country 2025 & 2033
- Figure 7: North America Software Composition Analysis Tool Revenue Share (%), by Country 2025 & 2033
- Figure 8: South America Software Composition Analysis Tool Revenue (undefined), by Application 2025 & 2033
- Figure 9: South America Software Composition Analysis Tool Revenue Share (%), by Application 2025 & 2033
- Figure 10: South America Software Composition Analysis Tool Revenue (undefined), by Type 2025 & 2033
- Figure 11: South America Software Composition Analysis Tool Revenue Share (%), by Type 2025 & 2033
- Figure 12: South America Software Composition Analysis Tool Revenue (undefined), by Country 2025 & 2033
- Figure 13: South America Software Composition Analysis Tool Revenue Share (%), by Country 2025 & 2033
- Figure 14: Europe Software Composition Analysis Tool Revenue (undefined), by Application 2025 & 2033
- Figure 15: Europe Software Composition Analysis Tool Revenue Share (%), by Application 2025 & 2033
- Figure 16: Europe Software Composition Analysis Tool Revenue (undefined), by Type 2025 & 2033
- Figure 17: Europe Software Composition Analysis Tool Revenue Share (%), by Type 2025 & 2033
- Figure 18: Europe Software Composition Analysis Tool Revenue (undefined), by Country 2025 & 2033
- Figure 19: Europe Software Composition Analysis Tool Revenue Share (%), by Country 2025 & 2033
- Figure 20: Middle East & Africa Software Composition Analysis Tool Revenue (undefined), by Application 2025 & 2033
- Figure 21: Middle East & Africa Software Composition Analysis Tool Revenue Share (%), by Application 2025 & 2033
- Figure 22: Middle East & Africa Software Composition Analysis Tool Revenue (undefined), by Type 2025 & 2033
- Figure 23: Middle East & Africa Software Composition Analysis Tool Revenue Share (%), by Type 2025 & 2033
- Figure 24: Middle East & Africa Software Composition Analysis Tool Revenue (undefined), by Country 2025 & 2033
- Figure 25: Middle East & Africa Software Composition Analysis Tool Revenue Share (%), by Country 2025 & 2033
- Figure 26: Asia Pacific Software Composition Analysis Tool Revenue (undefined), by Application 2025 & 2033
- Figure 27: Asia Pacific Software Composition Analysis Tool Revenue Share (%), by Application 2025 & 2033
- Figure 28: Asia Pacific Software Composition Analysis Tool Revenue (undefined), by Type 2025 & 2033
- Figure 29: Asia Pacific Software Composition Analysis Tool Revenue Share (%), by Type 2025 & 2033
- Figure 30: Asia Pacific Software Composition Analysis Tool Revenue (undefined), by Country 2025 & 2033
- Figure 31: Asia Pacific Software Composition Analysis Tool Revenue Share (%), by Country 2025 & 2033
List of Tables
- Table 1: Global Software Composition Analysis Tool Revenue undefined Forecast, by Application 2020 & 2033
- Table 2: Global Software Composition Analysis Tool Revenue undefined Forecast, by Type 2020 & 2033
- Table 3: Global Software Composition Analysis Tool Revenue undefined Forecast, by Region 2020 & 2033
- Table 4: Global Software Composition Analysis Tool Revenue undefined Forecast, by Application 2020 & 2033
- Table 5: Global Software Composition Analysis Tool Revenue undefined Forecast, by Type 2020 & 2033
- Table 6: Global Software Composition Analysis Tool Revenue undefined Forecast, by Country 2020 & 2033
- Table 7: United States Software Composition Analysis Tool Revenue (undefined) Forecast, by Application 2020 & 2033
- Table 8: Canada Software Composition Analysis Tool Revenue (undefined) Forecast, by Application 2020 & 2033
- Table 9: Mexico Software Composition Analysis Tool Revenue (undefined) Forecast, by Application 2020 & 2033
- Table 10: Global Software Composition Analysis Tool Revenue undefined Forecast, by Application 2020 & 2033
- Table 11: Global Software Composition Analysis Tool Revenue undefined Forecast, by Type 2020 & 2033
- Table 12: Global Software Composition Analysis Tool Revenue undefined Forecast, by Country 2020 & 2033
- Table 13: Brazil Software Composition Analysis Tool Revenue (undefined) Forecast, by Application 2020 & 2033
- Table 14: Argentina Software Composition Analysis Tool Revenue (undefined) Forecast, by Application 2020 & 2033
- Table 15: Rest of South America Software Composition Analysis Tool Revenue (undefined) Forecast, by Application 2020 & 2033
- Table 16: Global Software Composition Analysis Tool Revenue undefined Forecast, by Application 2020 & 2033
- Table 17: Global Software Composition Analysis Tool Revenue undefined Forecast, by Type 2020 & 2033
- Table 18: Global Software Composition Analysis Tool Revenue undefined Forecast, by Country 2020 & 2033
- Table 19: United Kingdom Software Composition Analysis Tool Revenue (undefined) Forecast, by Application 2020 & 2033
- Table 20: Germany Software Composition Analysis Tool Revenue (undefined) Forecast, by Application 2020 & 2033
- Table 21: France Software Composition Analysis Tool Revenue (undefined) Forecast, by Application 2020 & 2033
- Table 22: Italy Software Composition Analysis Tool Revenue (undefined) Forecast, by Application 2020 & 2033
- Table 23: Spain Software Composition Analysis Tool Revenue (undefined) Forecast, by Application 2020 & 2033
- Table 24: Russia Software Composition Analysis Tool Revenue (undefined) Forecast, by Application 2020 & 2033
- Table 25: Benelux Software Composition Analysis Tool Revenue (undefined) Forecast, by Application 2020 & 2033
- Table 26: Nordics Software Composition Analysis Tool Revenue (undefined) Forecast, by Application 2020 & 2033
- Table 27: Rest of Europe Software Composition Analysis Tool Revenue (undefined) Forecast, by Application 2020 & 2033
- Table 28: Global Software Composition Analysis Tool Revenue undefined Forecast, by Application 2020 & 2033
- Table 29: Global Software Composition Analysis Tool Revenue undefined Forecast, by Type 2020 & 2033
- Table 30: Global Software Composition Analysis Tool Revenue undefined Forecast, by Country 2020 & 2033
- Table 31: Turkey Software Composition Analysis Tool Revenue (undefined) Forecast, by Application 2020 & 2033
- Table 32: Israel Software Composition Analysis Tool Revenue (undefined) Forecast, by Application 2020 & 2033
- Table 33: GCC Software Composition Analysis Tool Revenue (undefined) Forecast, by Application 2020 & 2033
- Table 34: North Africa Software Composition Analysis Tool Revenue (undefined) Forecast, by Application 2020 & 2033
- Table 35: South Africa Software Composition Analysis Tool Revenue (undefined) Forecast, by Application 2020 & 2033
- Table 36: Rest of Middle East & Africa Software Composition Analysis Tool Revenue (undefined) Forecast, by Application 2020 & 2033
- Table 37: Global Software Composition Analysis Tool Revenue undefined Forecast, by Application 2020 & 2033
- Table 38: Global Software Composition Analysis Tool Revenue undefined Forecast, by Type 2020 & 2033
- Table 39: Global Software Composition Analysis Tool Revenue undefined Forecast, by Country 2020 & 2033
- Table 40: China Software Composition Analysis Tool Revenue (undefined) Forecast, by Application 2020 & 2033
- Table 41: India Software Composition Analysis Tool Revenue (undefined) Forecast, by Application 2020 & 2033
- Table 42: Japan Software Composition Analysis Tool Revenue (undefined) Forecast, by Application 2020 & 2033
- Table 43: South Korea Software Composition Analysis Tool Revenue (undefined) Forecast, by Application 2020 & 2033
- Table 44: ASEAN Software Composition Analysis Tool Revenue (undefined) Forecast, by Application 2020 & 2033
- Table 45: Oceania Software Composition Analysis Tool Revenue (undefined) Forecast, by Application 2020 & 2033
- Table 46: Rest of Asia Pacific Software Composition Analysis Tool Revenue (undefined) Forecast, by Application 2020 & 2033
Frequently Asked Questions
1. What is the projected Compound Annual Growth Rate (CAGR) of the Software Composition Analysis Tool?
The projected CAGR is approximately 12.49%.
2. Which companies are prominent players in the Software Composition Analysis Tool?
Key companies in the market include GitLab, GitHub, WhiteSource Software, Synopsys, Snyk, CAST, Contrast Security, Threatwatch, Bytesafe, JFrog, Argon Security, Revenera, Veracode, Active State, BluBracket, Debricked, OWASP, FOSSA, Hoss, MergeBase Software, Sonatype, rezilion, SCANOSS, ShiftLeft, SOOS, SourceClear, Timesys, WhiteHat Security.
3. What are the main segments of the Software Composition Analysis Tool?
The market segments include Application, Type.
4. Can you provide details about the market size?
The market size is estimated to be USD XXX N/A as of 2022.
5. What are some drivers contributing to market growth?
N/A
6. What are the notable trends driving market growth?
N/A
7. Are there any restraints impacting market growth?
N/A
8. Can you provide examples of recent developments in the market?
N/A
9. What pricing options are available for accessing the report?
Pricing options include single-user, multi-user, and enterprise licenses priced at USD 2900.00, USD 4350.00, and USD 5800.00 respectively.
10. Is the market size provided in terms of value or volume?
The market size is provided in terms of value, measured in N/A.
11. Are there any specific market keywords associated with the report?
Yes, the market keyword associated with the report is "Software Composition Analysis Tool," which aids in identifying and referencing the specific market segment covered.
12. How do I determine which pricing option suits my needs best?
The pricing options vary based on user requirements and access needs. Individual users may opt for single-user licenses, while businesses requiring broader access may choose multi-user or enterprise licenses for cost-effective access to the report.
13. Are there any additional resources or data provided in the Software Composition Analysis Tool report?
While the report offers comprehensive insights, it's advisable to review the specific contents or supplementary materials provided to ascertain if additional resources or data are available.
14. How can I stay updated on further developments or reports in the Software Composition Analysis Tool?
To stay informed about further developments, trends, and reports in the Software Composition Analysis Tool, consider subscribing to industry newsletters, following relevant companies and organizations, or regularly checking reputable industry news sources and publications.
Methodology
Step 1 - Identification of Relevant Samples Size from Population Database


Step 2 - Approaches for Defining Global Market Size (Value, Volume* & Price*)

Note*: In applicable scenarios
Step 3 - Data Sources
Primary Research
- Web Analytics
- Survey Reports
- Research Institute
- Latest Research Reports
- Opinion Leaders
Secondary Research
- Annual Reports
- White Paper
- Latest Press Release
- Industry Association
- Paid Database
- Investor Presentations

Step 4 - Data Triangulation
Involves using different sources of information in order to increase the validity of a study
These sources are likely to be stakeholders in a program - participants, other researchers, program staff, other community members, and so on.
Then we put all data in single framework & apply various statistical tools to find out the dynamic on the market.
During the analysis stage, feedback from the stakeholder groups would be compared to determine areas of agreement as well as areas of divergence