

Key Insights
The Southeast Asia cross-border e-commerce market is poised for substantial expansion, driven by widespread internet and smartphone adoption, a growing affluent middle class, and a strong consumer preference for online convenience. The market is projected to experience a Compound Annual Growth Rate (CAGR) of 21.13%, reaching an estimated market size of $201.92 billion by 2033, with 2024 serving as the base year. Key growth catalysts include enhanced logistics networks, the proliferation of mobile commerce, and increased uptake of digital payment solutions. Leading platforms such as Shopee, Lazada, and AliExpress are pivotal in serving both B2B and B2C segments across major product verticals including fashion, electronics, home goods, and beauty. While Singapore, Indonesia, Vietnam, and Thailand are key markets, other regional economies are demonstrating notable growth potential. Challenges such as logistical complexities, diverse regulatory environments, and cybersecurity risks are being addressed through strategic investments in infrastructure and technological innovation.
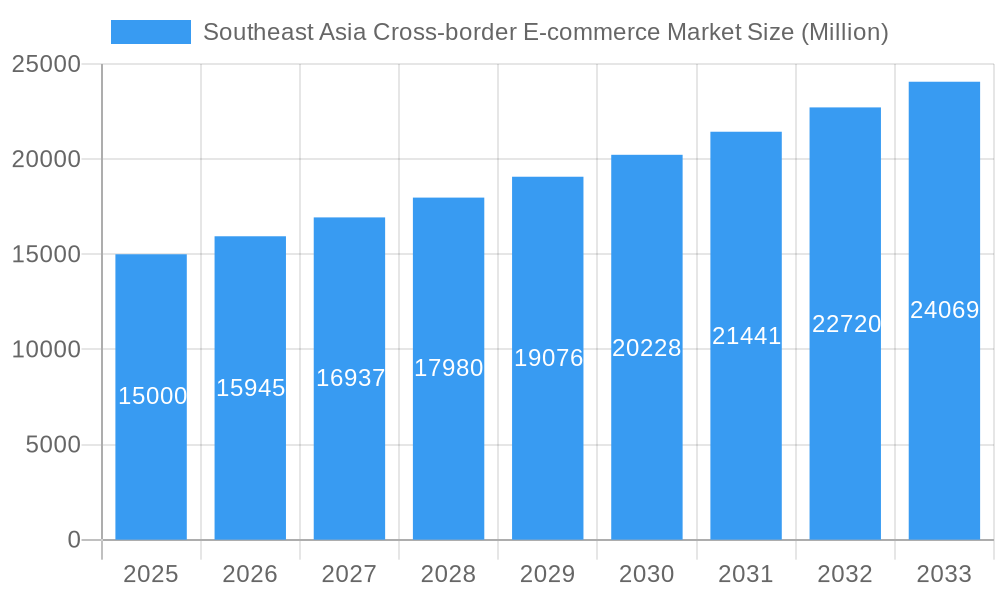
Southeast Asia Cross-border E-commerce Market Market Size (In Billion)
Market segmentation highlights the dominance of the B2C sector, fueled by consumer spending power, with fashion and electronics leading product categories reflecting regional consumer preferences. Indonesia and Vietnam are emerging as high-growth markets due to their substantial populations and increasing digital engagement. Intense competition from established and local players is fostering innovation in localized marketing, delivery efficiency, and customer experience. Future growth hinges on sustained economic progress, enhanced digital literacy, and continuous technological advancements within the e-commerce ecosystem, presenting significant opportunities for market participants.
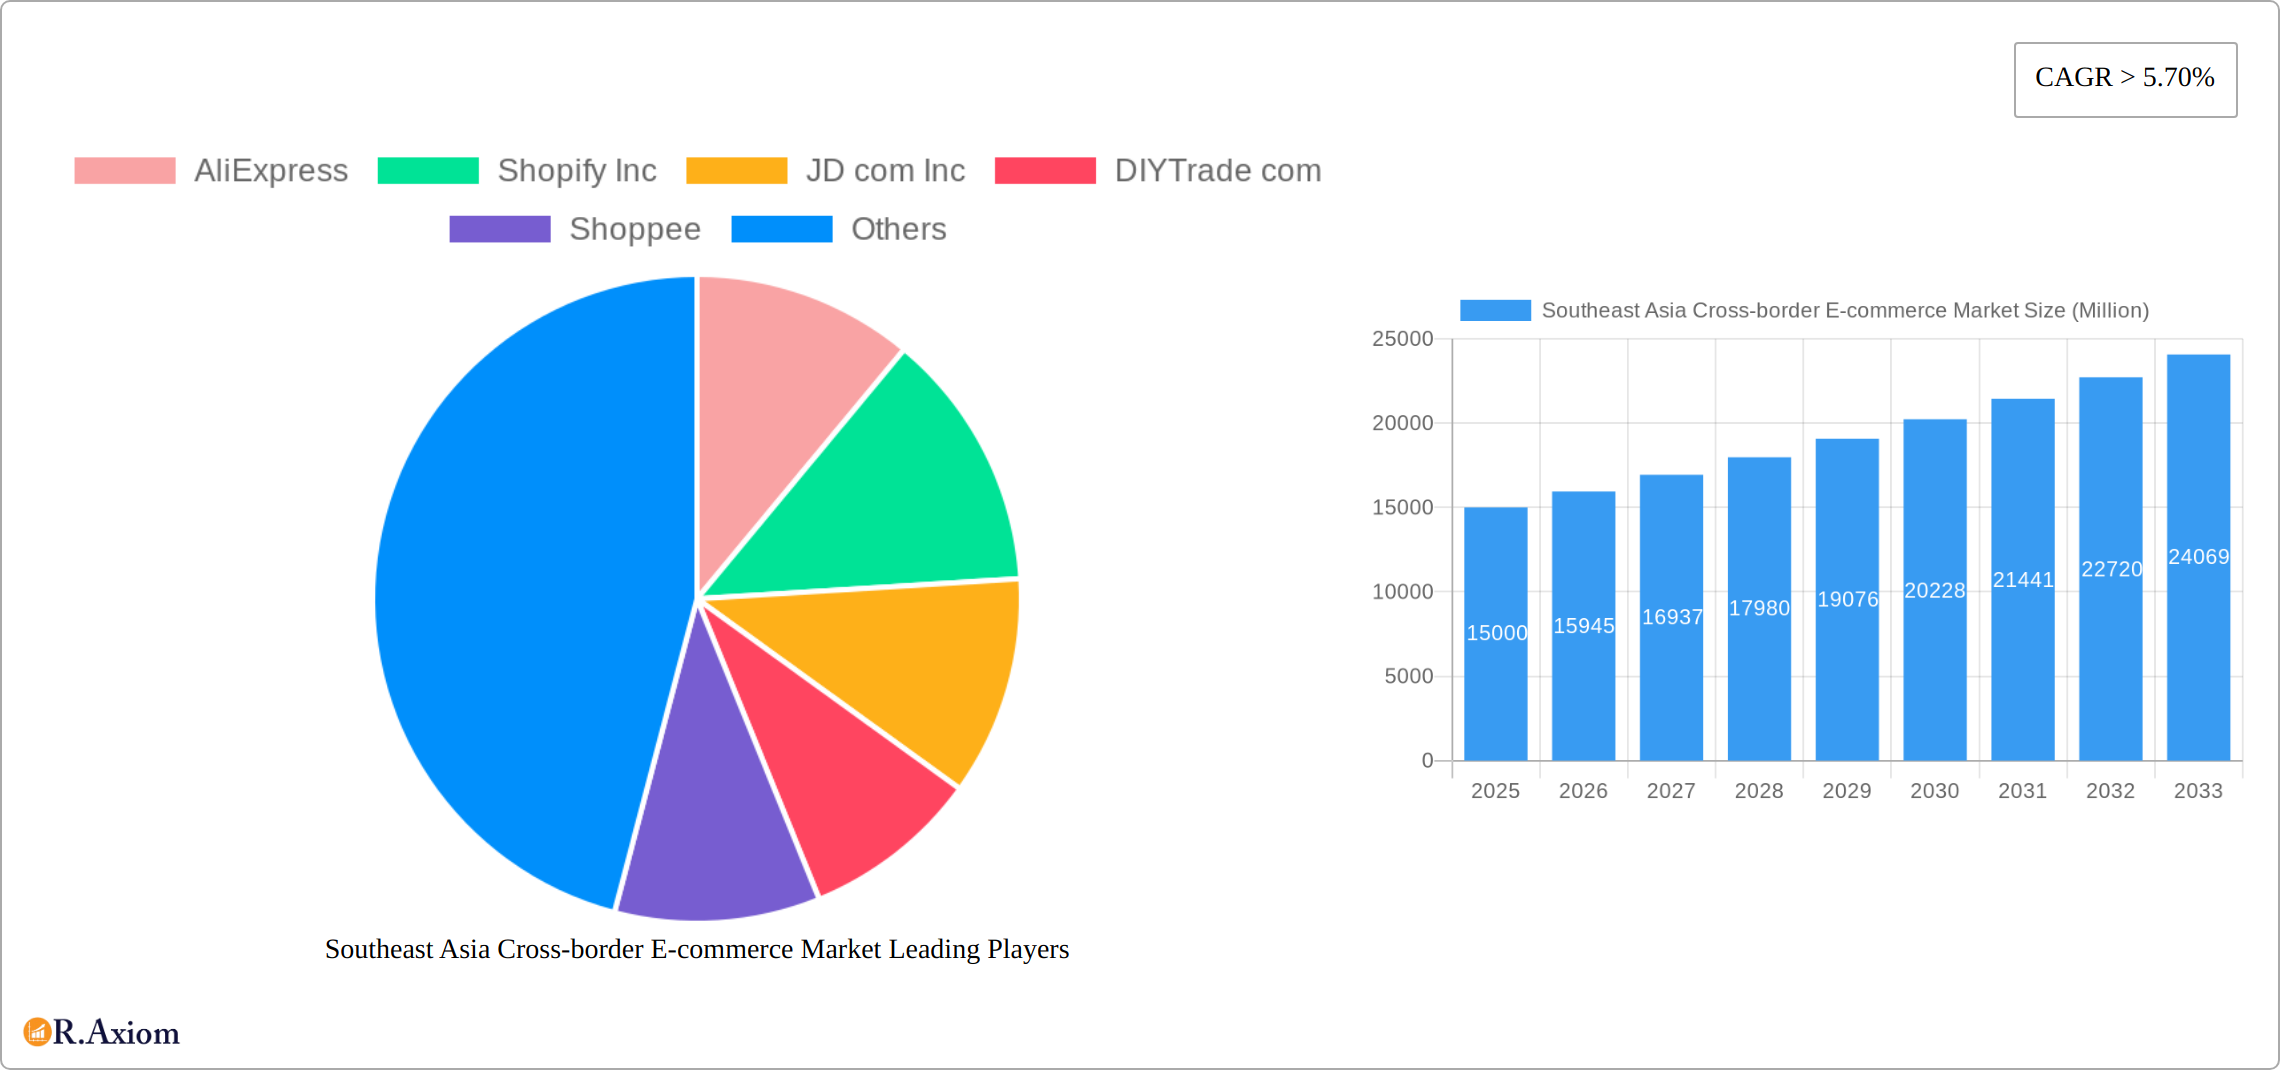
Southeast Asia Cross-border E-commerce Market Company Market Share
Southeast Asia Cross-border E-commerce Market: A Comprehensive Report (2019-2033)
This detailed report provides a comprehensive analysis of the Southeast Asia cross-border e-commerce market, covering its current state, future projections, and key players. The study period spans from 2019 to 2033, with 2025 serving as both the base and estimated year. The forecast period is 2025-2033, and the historical period covers 2019-2024. This report is crucial for businesses, investors, and policymakers seeking to understand this rapidly evolving market.
Southeast Asia Cross-border E-commerce Market Market Concentration & Innovation
The Southeast Asia cross-border e-commerce market is a dynamic landscape characterized by a blend of established global giants and rapidly expanding regional players. While Shopee and Lazada currently hold significant market share, the overall market remains fragmented, with numerous smaller competitors vying for position. This competitive environment is further fueled by the influx of players like AliExpress and Amazon, constantly reshaping the market dynamics. Precise market share figures, however, fluctuate rapidly and require continuous analysis, as detailed in this report.
Beyond market share fluctuations, the sector witnesses substantial mergers and acquisitions (M&A) activity. Deal values vary considerably, depending on the target company's size and strategic importance. For example, while the Razorpay-Curlec deal in February 2022 involved an undisclosed sum, other acquisitions have ranged from tens to hundreds of millions of dollars, illustrating the significant investment flowing into the sector.
- Market Concentration: A dynamic, moderately fragmented market with a few dominant players and a large number of smaller, agile competitors constantly vying for market share.
- Innovation Drivers: Rapid growth in smartphone penetration, expanding internet access, evolving consumer preferences (e.g., a shift towards mobile-first shopping), and increasing digital literacy are key drivers of innovation within the market.
- Regulatory Frameworks: Navigating the diverse and often evolving regulatory landscapes across Southeast Asian nations presents both challenges and opportunities, impacting market entry strategies and operational compliance.
- Product Substitutes: Traditional retail channels, domestic e-commerce platforms, and even social commerce present a complex competitive landscape demanding differentiation and value-added services.
- End-User Trends: Consumers increasingly demand convenience, a wider selection of products, competitive pricing, and secure payment options, pushing platforms to continuously adapt and improve their offerings.
- M&A Activities: The ongoing wave of mergers and acquisitions is driven by expansion strategies, technological integration, and the pursuit of market dominance. While precise figures are constantly changing, projections for M&A activity suggest a significant increase in investment over the next decade.
Southeast Asia Cross-border E-commerce Market Industry Trends & Insights
This section delves into the key industry trends and insights shaping the Southeast Asia cross-border e-commerce market. Market growth is propelled by several factors, including rising disposable incomes, increasing internet and mobile penetration, and the expanding adoption of digital payment methods. Technological disruptions such as the rise of mobile commerce, social commerce, and artificial intelligence are further accelerating market expansion. Consumer preferences are shifting towards convenience, personalized experiences, and secure online transactions. Competitive dynamics are intense, with both global and local players vying for market share through strategic pricing, marketing, and logistics optimization. The Compound Annual Growth Rate (CAGR) for the forecast period (2025-2033) is estimated to be xx%, while market penetration is projected to reach xx% by 2033. Further details on specific CAGR and penetration rates for different segments will be provided in this report.
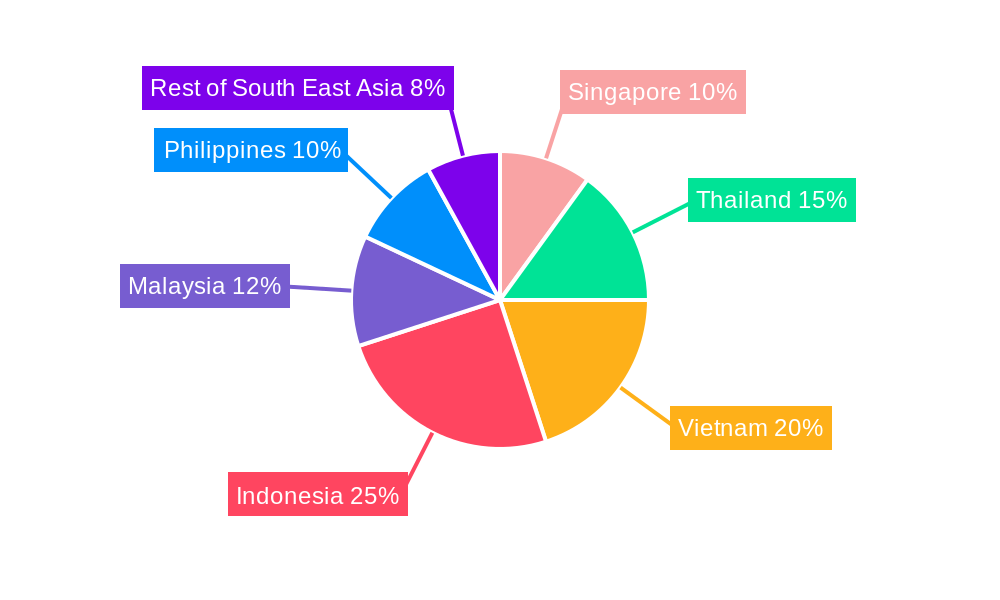
Dominant Markets & Segments in Southeast Asia Cross-border E-commerce Market
This section identifies the leading regions, countries, and segments within the Southeast Asia cross-border e-commerce market. Indonesia, with its large population and expanding middle class, is expected to remain a dominant market. Other key markets include Thailand, Vietnam, the Philippines, and Malaysia.
- By Business: B2C dominates the market, driven by consumer demand for convenience and wide selection, while B2B is growing due to increasing cross-border trade.
- By Product: Fashion and apparel, consumer electronics, and beauty and personal care products are leading product segments.
- By Country: Indonesia, Vietnam, and Thailand are leading countries due to large populations, expanding internet penetration, and strong economic growth.
The dominance of certain segments and countries is primarily driven by factors such as favorable economic policies, rapidly developing infrastructure, and supportive regulatory environments. The report will provide a deeper analysis of these factors and their influence on market dominance.
Southeast Asia Cross-border E-commerce Market Product Developments
The Southeast Asia cross-border e-commerce market witnesses continuous product innovation, driven by technological advancements and evolving consumer needs. This includes advancements in mobile payment systems, improved logistics and delivery networks, and personalized shopping experiences. These innovations enhance convenience, security, and efficiency, enhancing market competitiveness. The trend is towards seamless cross-border transactions and localized shopping experiences catering to specific cultural preferences.
Report Scope & Segmentation Analysis
This report comprehensively segments the Southeast Asia cross-border e-commerce market across various parameters:
- By Business (B2B & B2C): Detailed analysis of market size, growth projections, and competitive landscape for both segments.
- By Product (Fashion & Apparel, Consumer Electronics, Home Appliances, Furniture, Beauty & Personal Care Products, Other Products): Individual market size estimations and growth projections for each product category.
- By Country (Singapore, Thailand, Vietnam, Indonesia, Malaysia, Philippines, Rest of South East Asia): Country-specific market size, growth forecasts, and competitive dynamics.
Each segment's analysis will include insights into market size (in Millions), growth projections, and competitive dynamics.
Key Drivers of Southeast Asia Cross-border E-commerce Market Growth
Several factors fuel the growth of the Southeast Asia cross-border e-commerce market:
- Technological advancements: Improved internet infrastructure, mobile penetration, and digital payment solutions.
- Economic growth: Rising disposable incomes and expanding middle class in several Southeast Asian countries.
- Favorable government policies: Initiatives promoting digital economy growth and e-commerce adoption.
These factors collectively contribute to the market's expansion and its potential for future growth.
Challenges in the Southeast Asia Cross-border E-commerce Market Sector
The Southeast Asia cross-border e-commerce sector faces several challenges:
- Logistics and delivery complexities: High shipping costs and lengthy delivery times impact consumer experience.
- Varying regulations across countries: Navigating diverse legal and regulatory frameworks poses operational difficulties.
- Payment gateway limitations: Lack of universally accepted payment methods can hinder cross-border transactions.
These challenges require effective solutions to ensure sustainable market growth.
Emerging Opportunities in Southeast Asia Cross-border E-commerce Market
Several emerging opportunities exist within the Southeast Asia cross-border e-commerce market:
- Expansion into underserved markets: Reaching smaller cities and rural areas with affordable and accessible online shopping.
- Leveraging social commerce: Utilizing social media platforms for enhanced customer engagement and sales.
- Adoption of innovative technologies: Integrating AI, blockchain, and big data for improved personalization and efficiency.
These opportunities present significant growth potential for businesses in the sector.
Leading Players in the Southeast Asia Cross-border E-commerce Market Market
- AliExpress
- Shopify Inc
- JD.com Inc
- DIYTrade.com
- Shopee
- Lazada
- ChinaAseanTrade.com
- Bukalapak
- Amazon.com Inc
- Qoo10
- eBay Inc
- Tokopedia
- Alibaba Group Holding Limited
List Not Exhaustive
Key Developments in Southeast Asia Cross-border E-commerce Market Industry
- September 2022: Akulaku partners with Alipay+, expanding BNPL options for Indonesian consumers. This development enhances payment options and boosts cross-border transactions.
- February 2022: Razorpay's acquisition of Curlec marks its entry into Southeast Asia, strengthening recurring payment solutions for businesses. This acquisition signifies increased investment and competition in the fintech sector.
Strategic Outlook for Southeast Asia Cross-border E-commerce Market Market
The Southeast Asia cross-border e-commerce market holds immense growth potential, driven by ongoing digitalization, rising consumer spending, and favorable regulatory environments. Strategic investments in logistics infrastructure, technological advancements, and tailored customer experiences will be crucial for success. The market’s future hinges on addressing existing challenges while capitalizing on emerging opportunities, ultimately fostering a more inclusive and efficient cross-border e-commerce ecosystem.
Southeast Asia Cross-border E-commerce Market Segmentation
-
1. Business
- 1.1. B2B
- 1.2. B2C
-
2. Product
- 2.1. Fashion and Apparel
- 2.2. Consumer Electronics
- 2.3. Home Appliances
- 2.4. Furniture
- 2.5. Beauty and Personal Care Products
- 2.6. Other Products (Toys, Food Products, etc.)
Southeast Asia Cross-border E-commerce Market Segmentation By Geography
-
1. North America
- 1.1. United States
- 1.2. Canada
- 1.3. Mexico
-
2. South America
- 2.1. Brazil
- 2.2. Argentina
- 2.3. Rest of South America
-
3. Europe
- 3.1. United Kingdom
- 3.2. Germany
- 3.3. France
- 3.4. Italy
- 3.5. Spain
- 3.6. Russia
- 3.7. Benelux
- 3.8. Nordics
- 3.9. Rest of Europe
-
4. Middle East & Africa
- 4.1. Turkey
- 4.2. Israel
- 4.3. GCC
- 4.4. North Africa
- 4.5. South Africa
- 4.6. Rest of Middle East & Africa
-
5. Asia Pacific
- 5.1. China
- 5.2. India
- 5.3. Japan
- 5.4. South Korea
- 5.5. ASEAN
- 5.6. Oceania
- 5.7. Rest of Asia Pacific
Southeast Asia Cross-border E-commerce Market Regional Market Share
Geographic Coverage of Southeast Asia Cross-border E-commerce Market
Southeast Asia Cross-border E-commerce Market REPORT HIGHLIGHTS
| Aspects | Details |
|---|---|
| Study Period | 2020-2034 |
| Base Year | 2025 |
| Estimated Year | 2026 |
| Forecast Period | 2026-2034 |
| Historical Period | 2020-2025 |
| Growth Rate | CAGR of 21.13% from 2020-2034 |
| Segmentation |
|
Table of Contents
- 1. Introduction
- 1.1. Research Scope
- 1.2. Market Segmentation
- 1.3. Research Objective
- 1.4. Definitions and Assumptions
- 2. Executive Summary
- 2.1. Market Snapshot
- 3. Market Dynamics
- 3.1. Market Drivers
- 3.2. Market Restrains
- 3.3. Market Trends
- 3.4. Market Opportunities
- 4. Market Factor Analysis
- 4.1. Porters Five Forces
- 4.1.1. Bargaining Power of Suppliers
- 4.1.2. Bargaining Power of Buyers
- 4.1.3. Threat of New Entrants
- 4.1.4. Threat of Substitutes
- 4.1.5. Competitive Rivalry
- 4.2. PESTEL analysis
- 4.3. BCG Analysis
- 4.3.1. Stars (High Growth, High Market Share)
- 4.3.2. Cash Cows (Low Growth, High Market Share)
- 4.3.3. Question Mark (High Growth, Low Market Share)
- 4.3.4. Dogs (Low Growth, Low Market Share)
- 4.4. Ansoff Matrix Analysis
- 4.5. Supply Chain Analysis
- 4.6. Regulatory Landscape
- 4.7. Current Market Potential and Opportunity Assessment (TAM–SAM–SOM Framework)
- 4.8. RAX Analyst Note
- 4.1. Porters Five Forces
- 5. Market Analysis, Insights and Forecast 2021-2033
- 5.1. Market Analysis, Insights and Forecast - by Business
- 5.1.1. B2B
- 5.1.2. B2C
- 5.2. Market Analysis, Insights and Forecast - by Product
- 5.2.1. Fashion and Apparel
- 5.2.2. Consumer Electronics
- 5.2.3. Home Appliances
- 5.2.4. Furniture
- 5.2.5. Beauty and Personal Care Products
- 5.2.6. Other Products (Toys, Food Products, etc.)
- 5.3. Market Analysis, Insights and Forecast - by Region
- 5.3.1. North America
- 5.3.2. South America
- 5.3.3. Europe
- 5.3.4. Middle East & Africa
- 5.3.5. Asia Pacific
- 5.1. Market Analysis, Insights and Forecast - by Business
- 6. Global Southeast Asia Cross-border E-commerce Market Analysis, Insights and Forecast, 2021-2033
- 6.1. Market Analysis, Insights and Forecast - by Business
- 6.1.1. B2B
- 6.1.2. B2C
- 6.2. Market Analysis, Insights and Forecast - by Product
- 6.2.1. Fashion and Apparel
- 6.2.2. Consumer Electronics
- 6.2.3. Home Appliances
- 6.2.4. Furniture
- 6.2.5. Beauty and Personal Care Products
- 6.2.6. Other Products (Toys, Food Products, etc.)
- 6.1. Market Analysis, Insights and Forecast - by Business
- 7. North America Southeast Asia Cross-border E-commerce Market Analysis, Insights and Forecast, 2020-2032
- 7.1. Market Analysis, Insights and Forecast - by Business
- 7.1.1. B2B
- 7.1.2. B2C
- 7.2. Market Analysis, Insights and Forecast - by Product
- 7.2.1. Fashion and Apparel
- 7.2.2. Consumer Electronics
- 7.2.3. Home Appliances
- 7.2.4. Furniture
- 7.2.5. Beauty and Personal Care Products
- 7.2.6. Other Products (Toys, Food Products, etc.)
- 7.1. Market Analysis, Insights and Forecast - by Business
- 8. South America Southeast Asia Cross-border E-commerce Market Analysis, Insights and Forecast, 2020-2032
- 8.1. Market Analysis, Insights and Forecast - by Business
- 8.1.1. B2B
- 8.1.2. B2C
- 8.2. Market Analysis, Insights and Forecast - by Product
- 8.2.1. Fashion and Apparel
- 8.2.2. Consumer Electronics
- 8.2.3. Home Appliances
- 8.2.4. Furniture
- 8.2.5. Beauty and Personal Care Products
- 8.2.6. Other Products (Toys, Food Products, etc.)
- 8.1. Market Analysis, Insights and Forecast - by Business
- 9. Europe Southeast Asia Cross-border E-commerce Market Analysis, Insights and Forecast, 2020-2032
- 9.1. Market Analysis, Insights and Forecast - by Business
- 9.1.1. B2B
- 9.1.2. B2C
- 9.2. Market Analysis, Insights and Forecast - by Product
- 9.2.1. Fashion and Apparel
- 9.2.2. Consumer Electronics
- 9.2.3. Home Appliances
- 9.2.4. Furniture
- 9.2.5. Beauty and Personal Care Products
- 9.2.6. Other Products (Toys, Food Products, etc.)
- 9.1. Market Analysis, Insights and Forecast - by Business
- 10. Middle East & Africa Southeast Asia Cross-border E-commerce Market Analysis, Insights and Forecast, 2020-2032
- 10.1. Market Analysis, Insights and Forecast - by Business
- 10.1.1. B2B
- 10.1.2. B2C
- 10.2. Market Analysis, Insights and Forecast - by Product
- 10.2.1. Fashion and Apparel
- 10.2.2. Consumer Electronics
- 10.2.3. Home Appliances
- 10.2.4. Furniture
- 10.2.5. Beauty and Personal Care Products
- 10.2.6. Other Products (Toys, Food Products, etc.)
- 10.1. Market Analysis, Insights and Forecast - by Business
- 11. Asia Pacific Southeast Asia Cross-border E-commerce Market Analysis, Insights and Forecast, 2020-2032
- 11.1. Market Analysis, Insights and Forecast - by Business
- 11.1.1. B2B
- 11.1.2. B2C
- 11.2. Market Analysis, Insights and Forecast - by Product
- 11.2.1. Fashion and Apparel
- 11.2.2. Consumer Electronics
- 11.2.3. Home Appliances
- 11.2.4. Furniture
- 11.2.5. Beauty and Personal Care Products
- 11.2.6. Other Products (Toys, Food Products, etc.)
- 11.1. Market Analysis, Insights and Forecast - by Business
- 12. Competitive Analysis
- 12.1. Company Profiles
- 12.1.1 AliExpress
- 12.1.1.1. Company Overview
- 12.1.1.2. Products
- 12.1.1.3. Company Financials
- 12.1.1.4. SWOT Analysis
- 12.1.2 Shopify Inc
- 12.1.2.1. Company Overview
- 12.1.2.2. Products
- 12.1.2.3. Company Financials
- 12.1.2.4. SWOT Analysis
- 12.1.3 JD com Inc
- 12.1.3.1. Company Overview
- 12.1.3.2. Products
- 12.1.3.3. Company Financials
- 12.1.3.4. SWOT Analysis
- 12.1.4 DIYTrade com
- 12.1.4.1. Company Overview
- 12.1.4.2. Products
- 12.1.4.3. Company Financials
- 12.1.4.4. SWOT Analysis
- 12.1.5 Shoppee
- 12.1.5.1. Company Overview
- 12.1.5.2. Products
- 12.1.5.3. Company Financials
- 12.1.5.4. SWOT Analysis
- 12.1.6 Lazada
- 12.1.6.1. Company Overview
- 12.1.6.2. Products
- 12.1.6.3. Company Financials
- 12.1.6.4. SWOT Analysis
- 12.1.7 ChinaAseanTrade com
- 12.1.7.1. Company Overview
- 12.1.7.2. Products
- 12.1.7.3. Company Financials
- 12.1.7.4. SWOT Analysis
- 12.1.8 Bukalapak
- 12.1.8.1. Company Overview
- 12.1.8.2. Products
- 12.1.8.3. Company Financials
- 12.1.8.4. SWOT Analysis
- 12.1.9 Amazon com Inc
- 12.1.9.1. Company Overview
- 12.1.9.2. Products
- 12.1.9.3. Company Financials
- 12.1.9.4. SWOT Analysis
- 12.1.10 Qoo
- 12.1.10.1. Company Overview
- 12.1.10.2. Products
- 12.1.10.3. Company Financials
- 12.1.10.4. SWOT Analysis
- 12.1.11 eBay Inc
- 12.1.11.1. Company Overview
- 12.1.11.2. Products
- 12.1.11.3. Company Financials
- 12.1.11.4. SWOT Analysis
- 12.1.12 Tokopedia
- 12.1.12.1. Company Overview
- 12.1.12.2. Products
- 12.1.12.3. Company Financials
- 12.1.12.4. SWOT Analysis
- 12.1.13 Alibaba Group Holding Limited **List Not Exhaustive
- 12.1.13.1. Company Overview
- 12.1.13.2. Products
- 12.1.13.3. Company Financials
- 12.1.13.4. SWOT Analysis
- 12.1.1 AliExpress
- 12.2. Market Entropy
- 12.2.1 Company's Key Areas Served
- 12.2.2 Recent Developments
- 12.3. Company Market Share Analysis 2025
- 12.3.1 Top 5 Companies Market Share Analysis
- 12.3.2 Top 3 Companies Market Share Analysis
- 12.4. List of Potential Customers
- 13. Research Methodology
List of Figures
- Figure 1: Global Southeast Asia Cross-border E-commerce Market Revenue Breakdown (billion, %) by Region 2025 & 2033
- Figure 2: North America Southeast Asia Cross-border E-commerce Market Revenue (billion), by Business 2025 & 2033
- Figure 3: North America Southeast Asia Cross-border E-commerce Market Revenue Share (%), by Business 2025 & 2033
- Figure 4: North America Southeast Asia Cross-border E-commerce Market Revenue (billion), by Product 2025 & 2033
- Figure 5: North America Southeast Asia Cross-border E-commerce Market Revenue Share (%), by Product 2025 & 2033
- Figure 6: North America Southeast Asia Cross-border E-commerce Market Revenue (billion), by Country 2025 & 2033
- Figure 7: North America Southeast Asia Cross-border E-commerce Market Revenue Share (%), by Country 2025 & 2033
- Figure 8: South America Southeast Asia Cross-border E-commerce Market Revenue (billion), by Business 2025 & 2033
- Figure 9: South America Southeast Asia Cross-border E-commerce Market Revenue Share (%), by Business 2025 & 2033
- Figure 10: South America Southeast Asia Cross-border E-commerce Market Revenue (billion), by Product 2025 & 2033
- Figure 11: South America Southeast Asia Cross-border E-commerce Market Revenue Share (%), by Product 2025 & 2033
- Figure 12: South America Southeast Asia Cross-border E-commerce Market Revenue (billion), by Country 2025 & 2033
- Figure 13: South America Southeast Asia Cross-border E-commerce Market Revenue Share (%), by Country 2025 & 2033
- Figure 14: Europe Southeast Asia Cross-border E-commerce Market Revenue (billion), by Business 2025 & 2033
- Figure 15: Europe Southeast Asia Cross-border E-commerce Market Revenue Share (%), by Business 2025 & 2033
- Figure 16: Europe Southeast Asia Cross-border E-commerce Market Revenue (billion), by Product 2025 & 2033
- Figure 17: Europe Southeast Asia Cross-border E-commerce Market Revenue Share (%), by Product 2025 & 2033
- Figure 18: Europe Southeast Asia Cross-border E-commerce Market Revenue (billion), by Country 2025 & 2033
- Figure 19: Europe Southeast Asia Cross-border E-commerce Market Revenue Share (%), by Country 2025 & 2033
- Figure 20: Middle East & Africa Southeast Asia Cross-border E-commerce Market Revenue (billion), by Business 2025 & 2033
- Figure 21: Middle East & Africa Southeast Asia Cross-border E-commerce Market Revenue Share (%), by Business 2025 & 2033
- Figure 22: Middle East & Africa Southeast Asia Cross-border E-commerce Market Revenue (billion), by Product 2025 & 2033
- Figure 23: Middle East & Africa Southeast Asia Cross-border E-commerce Market Revenue Share (%), by Product 2025 & 2033
- Figure 24: Middle East & Africa Southeast Asia Cross-border E-commerce Market Revenue (billion), by Country 2025 & 2033
- Figure 25: Middle East & Africa Southeast Asia Cross-border E-commerce Market Revenue Share (%), by Country 2025 & 2033
- Figure 26: Asia Pacific Southeast Asia Cross-border E-commerce Market Revenue (billion), by Business 2025 & 2033
- Figure 27: Asia Pacific Southeast Asia Cross-border E-commerce Market Revenue Share (%), by Business 2025 & 2033
- Figure 28: Asia Pacific Southeast Asia Cross-border E-commerce Market Revenue (billion), by Product 2025 & 2033
- Figure 29: Asia Pacific Southeast Asia Cross-border E-commerce Market Revenue Share (%), by Product 2025 & 2033
- Figure 30: Asia Pacific Southeast Asia Cross-border E-commerce Market Revenue (billion), by Country 2025 & 2033
- Figure 31: Asia Pacific Southeast Asia Cross-border E-commerce Market Revenue Share (%), by Country 2025 & 2033
List of Tables
- Table 1: Global Southeast Asia Cross-border E-commerce Market Revenue billion Forecast, by Business 2020 & 2033
- Table 2: Global Southeast Asia Cross-border E-commerce Market Revenue billion Forecast, by Product 2020 & 2033
- Table 3: Global Southeast Asia Cross-border E-commerce Market Revenue billion Forecast, by Region 2020 & 2033
- Table 4: Global Southeast Asia Cross-border E-commerce Market Revenue billion Forecast, by Business 2020 & 2033
- Table 5: Global Southeast Asia Cross-border E-commerce Market Revenue billion Forecast, by Product 2020 & 2033
- Table 6: Global Southeast Asia Cross-border E-commerce Market Revenue billion Forecast, by Country 2020 & 2033
- Table 7: United States Southeast Asia Cross-border E-commerce Market Revenue (billion) Forecast, by Application 2020 & 2033
- Table 8: Canada Southeast Asia Cross-border E-commerce Market Revenue (billion) Forecast, by Application 2020 & 2033
- Table 9: Mexico Southeast Asia Cross-border E-commerce Market Revenue (billion) Forecast, by Application 2020 & 2033
- Table 10: Global Southeast Asia Cross-border E-commerce Market Revenue billion Forecast, by Business 2020 & 2033
- Table 11: Global Southeast Asia Cross-border E-commerce Market Revenue billion Forecast, by Product 2020 & 2033
- Table 12: Global Southeast Asia Cross-border E-commerce Market Revenue billion Forecast, by Country 2020 & 2033
- Table 13: Brazil Southeast Asia Cross-border E-commerce Market Revenue (billion) Forecast, by Application 2020 & 2033
- Table 14: Argentina Southeast Asia Cross-border E-commerce Market Revenue (billion) Forecast, by Application 2020 & 2033
- Table 15: Rest of South America Southeast Asia Cross-border E-commerce Market Revenue (billion) Forecast, by Application 2020 & 2033
- Table 16: Global Southeast Asia Cross-border E-commerce Market Revenue billion Forecast, by Business 2020 & 2033
- Table 17: Global Southeast Asia Cross-border E-commerce Market Revenue billion Forecast, by Product 2020 & 2033
- Table 18: Global Southeast Asia Cross-border E-commerce Market Revenue billion Forecast, by Country 2020 & 2033
- Table 19: United Kingdom Southeast Asia Cross-border E-commerce Market Revenue (billion) Forecast, by Application 2020 & 2033
- Table 20: Germany Southeast Asia Cross-border E-commerce Market Revenue (billion) Forecast, by Application 2020 & 2033
- Table 21: France Southeast Asia Cross-border E-commerce Market Revenue (billion) Forecast, by Application 2020 & 2033
- Table 22: Italy Southeast Asia Cross-border E-commerce Market Revenue (billion) Forecast, by Application 2020 & 2033
- Table 23: Spain Southeast Asia Cross-border E-commerce Market Revenue (billion) Forecast, by Application 2020 & 2033
- Table 24: Russia Southeast Asia Cross-border E-commerce Market Revenue (billion) Forecast, by Application 2020 & 2033
- Table 25: Benelux Southeast Asia Cross-border E-commerce Market Revenue (billion) Forecast, by Application 2020 & 2033
- Table 26: Nordics Southeast Asia Cross-border E-commerce Market Revenue (billion) Forecast, by Application 2020 & 2033
- Table 27: Rest of Europe Southeast Asia Cross-border E-commerce Market Revenue (billion) Forecast, by Application 2020 & 2033
- Table 28: Global Southeast Asia Cross-border E-commerce Market Revenue billion Forecast, by Business 2020 & 2033
- Table 29: Global Southeast Asia Cross-border E-commerce Market Revenue billion Forecast, by Product 2020 & 2033
- Table 30: Global Southeast Asia Cross-border E-commerce Market Revenue billion Forecast, by Country 2020 & 2033
- Table 31: Turkey Southeast Asia Cross-border E-commerce Market Revenue (billion) Forecast, by Application 2020 & 2033
- Table 32: Israel Southeast Asia Cross-border E-commerce Market Revenue (billion) Forecast, by Application 2020 & 2033
- Table 33: GCC Southeast Asia Cross-border E-commerce Market Revenue (billion) Forecast, by Application 2020 & 2033
- Table 34: North Africa Southeast Asia Cross-border E-commerce Market Revenue (billion) Forecast, by Application 2020 & 2033
- Table 35: South Africa Southeast Asia Cross-border E-commerce Market Revenue (billion) Forecast, by Application 2020 & 2033
- Table 36: Rest of Middle East & Africa Southeast Asia Cross-border E-commerce Market Revenue (billion) Forecast, by Application 2020 & 2033
- Table 37: Global Southeast Asia Cross-border E-commerce Market Revenue billion Forecast, by Business 2020 & 2033
- Table 38: Global Southeast Asia Cross-border E-commerce Market Revenue billion Forecast, by Product 2020 & 2033
- Table 39: Global Southeast Asia Cross-border E-commerce Market Revenue billion Forecast, by Country 2020 & 2033
- Table 40: China Southeast Asia Cross-border E-commerce Market Revenue (billion) Forecast, by Application 2020 & 2033
- Table 41: India Southeast Asia Cross-border E-commerce Market Revenue (billion) Forecast, by Application 2020 & 2033
- Table 42: Japan Southeast Asia Cross-border E-commerce Market Revenue (billion) Forecast, by Application 2020 & 2033
- Table 43: South Korea Southeast Asia Cross-border E-commerce Market Revenue (billion) Forecast, by Application 2020 & 2033
- Table 44: ASEAN Southeast Asia Cross-border E-commerce Market Revenue (billion) Forecast, by Application 2020 & 2033
- Table 45: Oceania Southeast Asia Cross-border E-commerce Market Revenue (billion) Forecast, by Application 2020 & 2033
- Table 46: Rest of Asia Pacific Southeast Asia Cross-border E-commerce Market Revenue (billion) Forecast, by Application 2020 & 2033
Frequently Asked Questions
1. What is the projected Compound Annual Growth Rate (CAGR) of the Southeast Asia Cross-border E-commerce Market?
The projected CAGR is approximately 21.13%.
2. Which companies are prominent players in the Southeast Asia Cross-border E-commerce Market?
Key companies in the market include AliExpress, Shopify Inc, JD com Inc, DIYTrade com, Shoppee, Lazada, ChinaAseanTrade com, Bukalapak, Amazon com Inc, Qoo, eBay Inc, Tokopedia, Alibaba Group Holding Limited **List Not Exhaustive.
3. What are the main segments of the Southeast Asia Cross-border E-commerce Market?
The market segments include Business, Product.
4. Can you provide details about the market size?
The market size is estimated to be USD 201.92 billion as of 2022.
5. What are some drivers contributing to market growth?
4.; Increasing International Trade Driving the Market4.; Increasing online users driving the market.
6. What are the notable trends driving market growth?
Growth in E-commerce sector in the region driving the market.
7. Are there any restraints impacting market growth?
4.; Regulatory Compliance Affecting the Market4.; High Competition in the Market.
8. Can you provide examples of recent developments in the market?
September 2022: Akulaku, a leading Southeast Asian banking and digital finance platform announced a partnership with Alipay+ that will allow Indonesian consumers to use its BNPL solution Akulaku PayLater at Alipay+'s global merchants. Alipay+, a suite of global cross-border digital payments and marketing solutions, will now support Akulaku PayLater, and merchants will be able to accept Akulaku PayLater as a payment method.
9. What pricing options are available for accessing the report?
Pricing options include single-user, multi-user, and enterprise licenses priced at USD 4750, USD 4950, and USD 6800 respectively.
10. Is the market size provided in terms of value or volume?
The market size is provided in terms of value, measured in billion.
11. Are there any specific market keywords associated with the report?
Yes, the market keyword associated with the report is "Southeast Asia Cross-border E-commerce Market," which aids in identifying and referencing the specific market segment covered.
12. How do I determine which pricing option suits my needs best?
The pricing options vary based on user requirements and access needs. Individual users may opt for single-user licenses, while businesses requiring broader access may choose multi-user or enterprise licenses for cost-effective access to the report.
13. Are there any additional resources or data provided in the Southeast Asia Cross-border E-commerce Market report?
While the report offers comprehensive insights, it's advisable to review the specific contents or supplementary materials provided to ascertain if additional resources or data are available.
14. How can I stay updated on further developments or reports in the Southeast Asia Cross-border E-commerce Market?
To stay informed about further developments, trends, and reports in the Southeast Asia Cross-border E-commerce Market, consider subscribing to industry newsletters, following relevant companies and organizations, or regularly checking reputable industry news sources and publications.
Methodology
Step 1 - Identification of Relevant Samples Size from Population Database


Step 2 - Approaches for Defining Global Market Size (Value, Volume* & Price*)

Note*: In applicable scenarios
Step 3 - Data Sources
Primary Research
- Web Analytics
- Survey Reports
- Research Institute
- Latest Research Reports
- Opinion Leaders
Secondary Research
- Annual Reports
- White Paper
- Latest Press Release
- Industry Association
- Paid Database
- Investor Presentations

Step 4 - Data Triangulation
Involves using different sources of information in order to increase the validity of a study
These sources are likely to be stakeholders in a program - participants, other researchers, program staff, other community members, and so on.
Then we put all data in single framework & apply various statistical tools to find out the dynamic on the market.
During the analysis stage, feedback from the stakeholder groups would be compared to determine areas of agreement as well as areas of divergence