

Key Insights
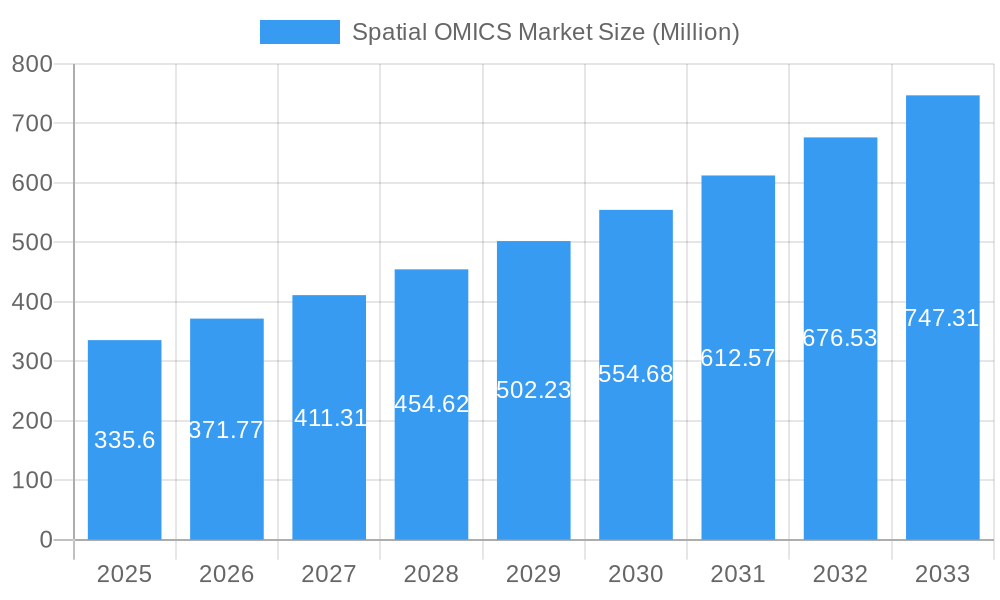
The Spatial Omics market, valued at $335.60 million in 2025, is experiencing robust growth, projected to expand at a compound annual growth rate (CAGR) of 10.60% from 2025 to 2033. This significant expansion is driven by several key factors. Advances in technology, particularly in spatial transcriptomics, spatial genomics, and spatial proteomics, are enabling researchers to gain a more comprehensive understanding of biological processes at a single-cell resolution. This heightened resolution is crucial for breakthroughs in drug discovery and development, diagnostics, and translational research. The increasing adoption of these technologies across academic and translational research institutes, pharmaceutical and biotechnology companies further fuels market growth. The rising prevalence of chronic diseases and the consequent need for more precise and personalized medicine are also significant contributing factors. Furthermore, the growing availability of high-quality data analysis software and the expansion of collaborative research initiatives are accelerating market expansion.
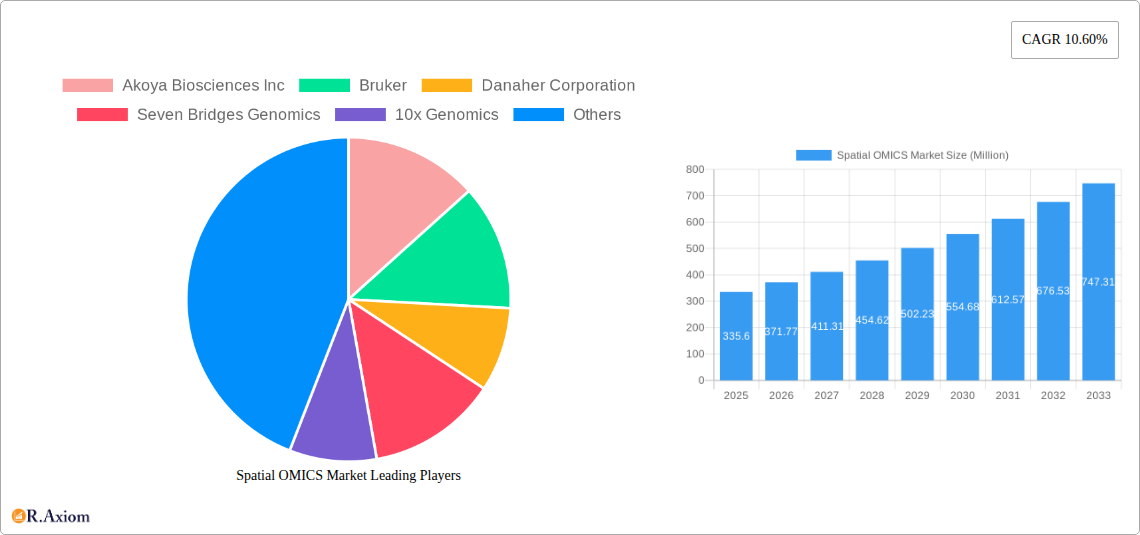
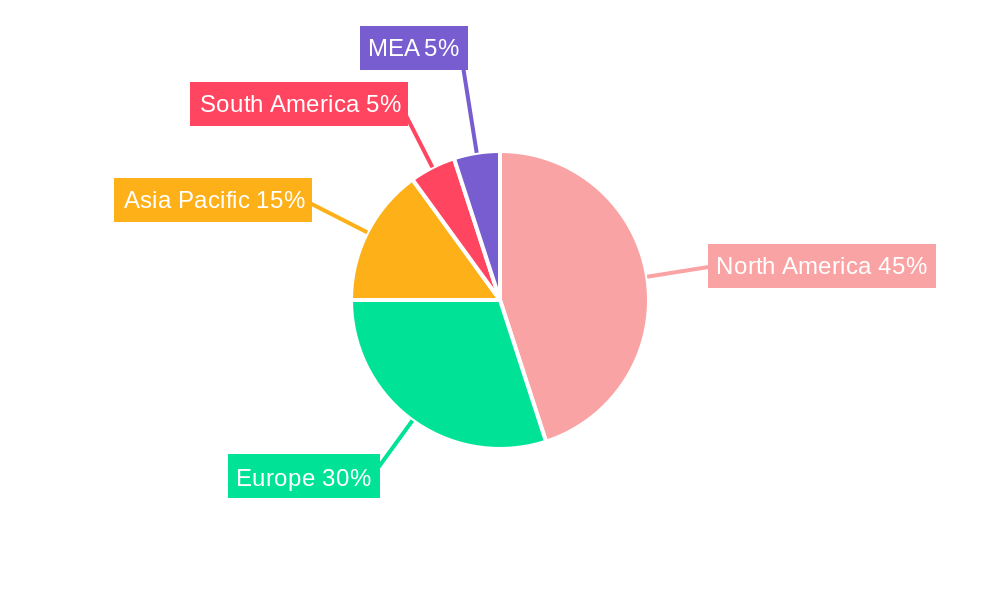
Spatial OMICS Market Market Size (In Million)
Market segmentation reveals a diverse landscape. While instruments represent a substantial portion of the market, consumables and software are also experiencing considerable growth as researchers increasingly rely on integrated solutions. In terms of sample type, formalin-fixed paraffin-embedded (FFPE) tissues remain dominant, though the use of fresh frozen samples is growing, particularly in applications requiring high-quality RNA preservation. Applications range from diagnostics and drug discovery to cell biology and single-cell analysis, highlighting the versatility of Spatial Omics technologies. Geographically, North America currently holds the largest market share, driven by substantial investment in research and development and the presence of key market players. However, the Asia-Pacific region is poised for significant growth due to increasing research funding and growing healthcare infrastructure. Competition is fierce, with established players like 10x Genomics, Akoya Biosciences, and Bruker alongside emerging companies constantly innovating and expanding their product portfolios. This dynamic competitive landscape is pushing innovation and driving down costs, ultimately benefiting researchers and accelerating the broader adoption of spatial omics techniques.
Spatial OMICS Market Company Market Share
This detailed report provides a comprehensive analysis of the Spatial OMICS market, encompassing market size, segmentation, growth drivers, challenges, key players, and future outlook. The study period covers 2019-2033, with 2025 as the base and estimated year. The forecast period is 2025-2033, and the historical period is 2019-2024. The market is segmented by product (Instruments, Consumables, Software), sample type (Formalin-Fixed Paraffin-Embedded (FFPE), Fresh Frozen), application (Diagnostics, Translational Research, Drug Discovery and Development, Single Cell Analysis, Cell Biology, Other), end-user (Academic & Translational Research Institutes, Pharmaceutical & Biotechnology Companies, Others), and technology (Spatial Transcriptomics, Spatial Genomics, Spatial Proteomics). Key players include Akoya Biosciences Inc, Bruker, Danaher Corporation, Seven Bridges Genomics, 10x Genomics, Biognosys, Dovetail Genomics (Cantata Bio), Bio-Techne, Ionpath Inc, PerkinElmer Inc, S2 Genomics Inc, and NanoString Technologies Inc. This report offers actionable insights for industry stakeholders, investors, and researchers.
Spatial OMICS Market Concentration & Innovation
The Spatial OMICS market exhibits a moderately concentrated landscape with several major players holding significant market share. The exact market share distribution is difficult to pinpoint precisely without access to internal company data; however, companies like 10x Genomics and Illumina (through acquisitions) have substantial presence. Innovation is a key driver, fueled by advancements in technologies such as single-cell analysis, high-throughput sequencing, and image analysis. This leads to the development of more sophisticated instruments, consumables, and software solutions. The regulatory landscape varies by region, impacting market access and approval processes for new products. The market witnesses ongoing M&A activities, with deal values reaching into the hundreds of Millions of dollars in recent years (exact figures unavailable, denoted as xx Million). The introduction of innovative products and competitive pricing strategies significantly influence the market's competitive dynamics. Substitutes currently pose a limited threat, given the unique capabilities of spatial omics technologies. However, evolving technologies may introduce alternatives in the future. End-user trends show increasing demand from pharmaceutical and biotechnology companies for drug discovery and development purposes.
- Market Concentration: Moderately concentrated, with several dominant players.
- Innovation Drivers: Advancements in single-cell analysis, sequencing, and image analysis.
- Regulatory Frameworks: Vary by region, influencing market access.
- Product Substitutes: Currently limited, but potential for future alternatives.
- End-User Trends: Growing demand from pharmaceutical and biotechnology companies.
- M&A Activities: Frequent, with deal values in the xx Million range.
Spatial OMICS Market Industry Trends & Insights
The Spatial OMICS market is experiencing robust growth, driven by several key factors. The increasing adoption of spatial omics technologies in research and diagnostics is a major contributor. Technological advancements, such as improvements in image resolution and data analysis capabilities, further propel market expansion. Consumer preferences are shifting towards higher-throughput, more accurate, and user-friendly solutions. The competitive landscape is characterized by both established players and emerging companies. This dynamic environment fosters innovation and drives down costs. The market's Compound Annual Growth Rate (CAGR) during the forecast period (2025-2033) is projected to be approximately xx%, with market penetration steadily increasing. Specific regional variations exist based on healthcare infrastructure and research funding. The shift towards personalized medicine is expected to be a significant growth driver in the coming years. The market is witnessing an accelerated adoption of AI and Machine Learning tools for better data analysis and interpretation, creating exciting growth opportunities.
Dominant Markets & Segments in Spatial OMICS Market
The North American region currently dominates the Spatial OMICS market, driven by substantial research funding, a robust healthcare infrastructure, and a high concentration of pharmaceutical and biotechnology companies. Within this region, the United States holds the largest market share.
Key Drivers for North American Dominance:
- High level of research and development funding.
- Strong presence of pharmaceutical and biotechnology companies.
- Well-established healthcare infrastructure.
- Favorable regulatory environment.
Segment Dominance:
- By Product: Instruments currently represent the largest segment, followed by consumables and then software. Growth in consumables is expected to be robust.
- By Sample: FFPE samples currently hold a larger market share compared to fresh frozen samples due to their wider availability.
- By Application: Drug discovery and development, along with translational research, are the most significant application areas. The diagnostic segment is anticipated to grow strongly.
- By End User: Pharmaceutical & Biotechnology Companies are the dominant end users, followed by Academic & Translational Research Institutes.
- By Technology: Spatial Transcriptomics currently leads the market, with Spatial Genomics and Spatial Proteomics experiencing rapid growth.
Spatial OMICS Market Product Developments
Recent product innovations showcase advancements in spatial resolution, throughput, and data analysis. New instruments provide higher sensitivity and better resolution, while software solutions are becoming more user-friendly and integrated. These advancements lead to broader applications across various research areas and diagnostics, improving market fit. For instance, the launch of 10x Genomics' Visium HD highlights the trend toward higher-resolution spatial gene expression analysis. Competitors are responding with similarly innovative offerings, creating a highly dynamic and competitive landscape.
Report Scope & Segmentation Analysis
This report provides a comprehensive analysis of the Spatial OMICS market, segmented by product (instruments, consumables, software), sample type (FFPE, fresh frozen), application (diagnostics, translational research, drug discovery and development, single-cell analysis, cell biology, other), end-user (academic & translational research institutes, pharmaceutical & biotechnology companies, others), and technology (spatial transcriptomics, spatial genomics, spatial proteomics). Each segment's growth projections, market size, and competitive dynamics are explored in detail. The market is expected to witness significant growth across all segments, with instruments and consumables exhibiting the highest growth potential.
Key Drivers of Spatial OMICS Market Growth
The Spatial OMICS market is experiencing strong growth due to several factors. Technological advancements resulting in higher resolution and throughput are key drivers. Increased research funding in genomics and proteomics, coupled with government initiatives supporting personalized medicine, fuels market expansion. Furthermore, the growing demand for accurate diagnostics and improved drug discovery tools in the pharmaceutical industry propels market growth. Regulations surrounding data privacy and data security are also affecting market evolution.
Challenges in the Spatial OMICS Market Sector
Several challenges hinder Spatial OMICS market growth. High costs associated with instruments and consumables limit accessibility. Complex data analysis requirements and the need for specialized expertise pose barriers to wider adoption. Regulatory hurdles for new diagnostic applications cause delays in market entry. Furthermore, intense competition among established and emerging players intensifies the pressure on pricing and profitability. Supply chain disruptions caused by factors such as geopolitical events and raw material shortages have led to production delays.
Emerging Opportunities in Spatial OMICS Market
Emerging opportunities lie in the integration of artificial intelligence and machine learning for automated image analysis and data interpretation. The expansion into new application areas, such as oncology and infectious disease research, presents further growth potential. Developing more user-friendly instruments and software, thereby broadening accessibility, also represents a significant opportunity. The development of new technologies for improved spatial resolution and higher throughput will further increase market opportunities.
Leading Players in the Spatial OMICS Market Market
- Akoya Biosciences Inc
- Bruker
- Danaher Corporation
- Seven Bridges Genomics
- 10x Genomics
- Biognosys
- Dovetail Genomics (Cantata Bio)
- Bio-Techne
- Ionpath Inc
- PerkinElmer Inc
- S2 Genomics Inc
- NanoString Technologies Inc
Key Developments in Spatial OMICS Market Industry
- March 2024: 10x Genomics launched the Visium HD Spatial Gene Expression instrument, enabling high-resolution analysis of FFPE tissue samples. This significantly enhances the capabilities of spatial transcriptomics and strengthens 10x Genomics' market position.
- January 2024: SimBioSys received FDA 510(k) clearance for TumorSight Viz, a software application for 3D visualization of breast tumors. This expands the analytical capabilities within the spatial omics workflow and accelerates adoption in clinical settings.
Strategic Outlook for Spatial OMICS Market Market
The Spatial OMICS market is poised for continued strong growth, driven by technological advancements, increasing research funding, and the expanding adoption of spatial omics technologies in research and diagnostics. Opportunities exist in expanding applications, improving accessibility, and integrating artificial intelligence for data analysis. The market's future is bright, with significant potential for innovation and growth across various segments and applications.
Spatial OMICS Market Segmentation
-
1. Technology
- 1.1. Spatial Transcriptomics
- 1.2. Spatial Genomics
- 1.3. Spatial Proteomics
-
2. Product
- 2.1. Instruments
- 2.2. Consumables
- 2.3. Software
-
3. Sample
- 3.1. Formalin-Fixed Paraffin-Embedded (FFPE)
- 3.2. Fresh Frozen
-
4. Application
- 4.1. Diagnostics
- 4.2. Translation Research
- 4.3. Drug Discovery and Development
- 4.4. Single Cell Analysis
- 4.5. Cell Biology
- 4.6. Other
-
5. End User
- 5.1. Academic & Translational Research Institutes
- 5.2. Pharmaceutical & Biotechnology Companies
- 5.3. Others
Spatial OMICS Market Segmentation By Geography
-
1. North America
- 1.1. United States
- 1.2. Canada
- 1.3. Mexico
-
2. Europe
- 2.1. Germany
- 2.2. United Kingdom
- 2.3. France
- 2.4. Italy
- 2.5. Spain
- 2.6. Rest of Europe
-
3. Asia Pacific
- 3.1. China
- 3.2. Japan
- 3.3. India
- 3.4. Australia
- 3.5. South Korea
- 3.6. Rest of Asia Pacific
- 4. Rest of the World
Spatial OMICS Market Regional Market Share
Geographic Coverage of Spatial OMICS Market
Spatial OMICS Market REPORT HIGHLIGHTS
| Aspects | Details |
|---|---|
| Study Period | 2020-2034 |
| Base Year | 2025 |
| Estimated Year | 2026 |
| Forecast Period | 2026-2034 |
| Historical Period | 2020-2025 |
| Growth Rate | CAGR of 10.60% from 2020-2034 |
| Segmentation |
|
Table of Contents
- 1. Introduction
- 1.1. Research Scope
- 1.2. Market Segmentation
- 1.3. Research Objective
- 1.4. Definitions and Assumptions
- 2. Executive Summary
- 2.1. Market Snapshot
- 3. Market Dynamics
- 3.1. Market Drivers
- 3.2. Market Restrains
- 3.3. Market Trends
- 3.4. Market Opportunities
- 4. Market Factor Analysis
- 4.1. Porters Five Forces
- 4.1.1. Bargaining Power of Suppliers
- 4.1.2. Bargaining Power of Buyers
- 4.1.3. Threat of New Entrants
- 4.1.4. Threat of Substitutes
- 4.1.5. Competitive Rivalry
- 4.2. PESTEL analysis
- 4.3. BCG Analysis
- 4.3.1. Stars (High Growth, High Market Share)
- 4.3.2. Cash Cows (Low Growth, High Market Share)
- 4.3.3. Question Mark (High Growth, Low Market Share)
- 4.3.4. Dogs (Low Growth, Low Market Share)
- 4.4. Ansoff Matrix Analysis
- 4.5. Supply Chain Analysis
- 4.6. Regulatory Landscape
- 4.7. Current Market Potential and Opportunity Assessment (TAM–SAM–SOM Framework)
- 4.8. RAX Analyst Note
- 4.1. Porters Five Forces
- 5. Market Analysis, Insights and Forecast 2021-2033
- 5.1. Market Analysis, Insights and Forecast - by Technology
- 5.1.1. Spatial Transcriptomics
- 5.1.2. Spatial Genomics
- 5.1.3. Spatial Proteomics
- 5.2. Market Analysis, Insights and Forecast - by Product
- 5.2.1. Instruments
- 5.2.2. Consumables
- 5.2.3. Software
- 5.3. Market Analysis, Insights and Forecast - by Sample
- 5.3.1. Formalin-Fixed Paraffin-Embedded (FFPE)
- 5.3.2. Fresh Frozen
- 5.4. Market Analysis, Insights and Forecast - by Application
- 5.4.1. Diagnostics
- 5.4.2. Translation Research
- 5.4.3. Drug Discovery and Development
- 5.4.4. Single Cell Analysis
- 5.4.5. Cell Biology
- 5.4.6. Other
- 5.5. Market Analysis, Insights and Forecast - by End User
- 5.5.1. Academic & Translational Research Institutes
- 5.5.2. Pharmaceutical & Biotechnology Companies
- 5.5.3. Others
- 5.6. Market Analysis, Insights and Forecast - by Region
- 5.6.1. North America
- 5.6.2. Europe
- 5.6.3. Asia Pacific
- 5.6.4. Rest of the World
- 5.1. Market Analysis, Insights and Forecast - by Technology
- 6. Global Spatial OMICS Market Analysis, Insights and Forecast, 2021-2033
- 6.1. Market Analysis, Insights and Forecast - by Technology
- 6.1.1. Spatial Transcriptomics
- 6.1.2. Spatial Genomics
- 6.1.3. Spatial Proteomics
- 6.2. Market Analysis, Insights and Forecast - by Product
- 6.2.1. Instruments
- 6.2.2. Consumables
- 6.2.3. Software
- 6.3. Market Analysis, Insights and Forecast - by Sample
- 6.3.1. Formalin-Fixed Paraffin-Embedded (FFPE)
- 6.3.2. Fresh Frozen
- 6.4. Market Analysis, Insights and Forecast - by Application
- 6.4.1. Diagnostics
- 6.4.2. Translation Research
- 6.4.3. Drug Discovery and Development
- 6.4.4. Single Cell Analysis
- 6.4.5. Cell Biology
- 6.4.6. Other
- 6.5. Market Analysis, Insights and Forecast - by End User
- 6.5.1. Academic & Translational Research Institutes
- 6.5.2. Pharmaceutical & Biotechnology Companies
- 6.5.3. Others
- 6.1. Market Analysis, Insights and Forecast - by Technology
- 7. North America Spatial OMICS Market Analysis, Insights and Forecast, 2020-2032
- 7.1. Market Analysis, Insights and Forecast - by Technology
- 7.1.1. Spatial Transcriptomics
- 7.1.2. Spatial Genomics
- 7.1.3. Spatial Proteomics
- 7.2. Market Analysis, Insights and Forecast - by Product
- 7.2.1. Instruments
- 7.2.2. Consumables
- 7.2.3. Software
- 7.3. Market Analysis, Insights and Forecast - by Sample
- 7.3.1. Formalin-Fixed Paraffin-Embedded (FFPE)
- 7.3.2. Fresh Frozen
- 7.4. Market Analysis, Insights and Forecast - by Application
- 7.4.1. Diagnostics
- 7.4.2. Translation Research
- 7.4.3. Drug Discovery and Development
- 7.4.4. Single Cell Analysis
- 7.4.5. Cell Biology
- 7.4.6. Other
- 7.5. Market Analysis, Insights and Forecast - by End User
- 7.5.1. Academic & Translational Research Institutes
- 7.5.2. Pharmaceutical & Biotechnology Companies
- 7.5.3. Others
- 7.1. Market Analysis, Insights and Forecast - by Technology
- 8. Europe Spatial OMICS Market Analysis, Insights and Forecast, 2020-2032
- 8.1. Market Analysis, Insights and Forecast - by Technology
- 8.1.1. Spatial Transcriptomics
- 8.1.2. Spatial Genomics
- 8.1.3. Spatial Proteomics
- 8.2. Market Analysis, Insights and Forecast - by Product
- 8.2.1. Instruments
- 8.2.2. Consumables
- 8.2.3. Software
- 8.3. Market Analysis, Insights and Forecast - by Sample
- 8.3.1. Formalin-Fixed Paraffin-Embedded (FFPE)
- 8.3.2. Fresh Frozen
- 8.4. Market Analysis, Insights and Forecast - by Application
- 8.4.1. Diagnostics
- 8.4.2. Translation Research
- 8.4.3. Drug Discovery and Development
- 8.4.4. Single Cell Analysis
- 8.4.5. Cell Biology
- 8.4.6. Other
- 8.5. Market Analysis, Insights and Forecast - by End User
- 8.5.1. Academic & Translational Research Institutes
- 8.5.2. Pharmaceutical & Biotechnology Companies
- 8.5.3. Others
- 8.1. Market Analysis, Insights and Forecast - by Technology
- 9. Asia Pacific Spatial OMICS Market Analysis, Insights and Forecast, 2020-2032
- 9.1. Market Analysis, Insights and Forecast - by Technology
- 9.1.1. Spatial Transcriptomics
- 9.1.2. Spatial Genomics
- 9.1.3. Spatial Proteomics
- 9.2. Market Analysis, Insights and Forecast - by Product
- 9.2.1. Instruments
- 9.2.2. Consumables
- 9.2.3. Software
- 9.3. Market Analysis, Insights and Forecast - by Sample
- 9.3.1. Formalin-Fixed Paraffin-Embedded (FFPE)
- 9.3.2. Fresh Frozen
- 9.4. Market Analysis, Insights and Forecast - by Application
- 9.4.1. Diagnostics
- 9.4.2. Translation Research
- 9.4.3. Drug Discovery and Development
- 9.4.4. Single Cell Analysis
- 9.4.5. Cell Biology
- 9.4.6. Other
- 9.5. Market Analysis, Insights and Forecast - by End User
- 9.5.1. Academic & Translational Research Institutes
- 9.5.2. Pharmaceutical & Biotechnology Companies
- 9.5.3. Others
- 9.1. Market Analysis, Insights and Forecast - by Technology
- 10. Rest of the World Spatial OMICS Market Analysis, Insights and Forecast, 2020-2032
- 10.1. Market Analysis, Insights and Forecast - by Technology
- 10.1.1. Spatial Transcriptomics
- 10.1.2. Spatial Genomics
- 10.1.3. Spatial Proteomics
- 10.2. Market Analysis, Insights and Forecast - by Product
- 10.2.1. Instruments
- 10.2.2. Consumables
- 10.2.3. Software
- 10.3. Market Analysis, Insights and Forecast - by Sample
- 10.3.1. Formalin-Fixed Paraffin-Embedded (FFPE)
- 10.3.2. Fresh Frozen
- 10.4. Market Analysis, Insights and Forecast - by Application
- 10.4.1. Diagnostics
- 10.4.2. Translation Research
- 10.4.3. Drug Discovery and Development
- 10.4.4. Single Cell Analysis
- 10.4.5. Cell Biology
- 10.4.6. Other
- 10.5. Market Analysis, Insights and Forecast - by End User
- 10.5.1. Academic & Translational Research Institutes
- 10.5.2. Pharmaceutical & Biotechnology Companies
- 10.5.3. Others
- 10.1. Market Analysis, Insights and Forecast - by Technology
- 11. Competitive Analysis
- 11.1. Company Profiles
- 11.1.1 Akoya Biosciences Inc
- 11.1.1.1. Company Overview
- 11.1.1.2. Products
- 11.1.1.3. Company Financials
- 11.1.1.4. SWOT Analysis
- 11.1.2 Bruker
- 11.1.2.1. Company Overview
- 11.1.2.2. Products
- 11.1.2.3. Company Financials
- 11.1.2.4. SWOT Analysis
- 11.1.3 Danaher Corporation
- 11.1.3.1. Company Overview
- 11.1.3.2. Products
- 11.1.3.3. Company Financials
- 11.1.3.4. SWOT Analysis
- 11.1.4 Seven Bridges Genomics
- 11.1.4.1. Company Overview
- 11.1.4.2. Products
- 11.1.4.3. Company Financials
- 11.1.4.4. SWOT Analysis
- 11.1.5 10x Genomics
- 11.1.5.1. Company Overview
- 11.1.5.2. Products
- 11.1.5.3. Company Financials
- 11.1.5.4. SWOT Analysis
- 11.1.6 Biognosys*List Not Exhaustive
- 11.1.6.1. Company Overview
- 11.1.6.2. Products
- 11.1.6.3. Company Financials
- 11.1.6.4. SWOT Analysis
- 11.1.7 Dovetail Genomics (Cantata Bio )
- 11.1.7.1. Company Overview
- 11.1.7.2. Products
- 11.1.7.3. Company Financials
- 11.1.7.4. SWOT Analysis
- 11.1.8 Bio-Techne
- 11.1.8.1. Company Overview
- 11.1.8.2. Products
- 11.1.8.3. Company Financials
- 11.1.8.4. SWOT Analysis
- 11.1.9 Ionpath Inc
- 11.1.9.1. Company Overview
- 11.1.9.2. Products
- 11.1.9.3. Company Financials
- 11.1.9.4. SWOT Analysis
- 11.1.10 PerkinElmer Inc
- 11.1.10.1. Company Overview
- 11.1.10.2. Products
- 11.1.10.3. Company Financials
- 11.1.10.4. SWOT Analysis
- 11.1.11 S2 Genomics Inc
- 11.1.11.1. Company Overview
- 11.1.11.2. Products
- 11.1.11.3. Company Financials
- 11.1.11.4. SWOT Analysis
- 11.1.12 NanoString Technologies Inc
- 11.1.12.1. Company Overview
- 11.1.12.2. Products
- 11.1.12.3. Company Financials
- 11.1.12.4. SWOT Analysis
- 11.1.1 Akoya Biosciences Inc
- 11.2. Market Entropy
- 11.2.1 Company's Key Areas Served
- 11.2.2 Recent Developments
- 11.3. Company Market Share Analysis 2025
- 11.3.1 Top 5 Companies Market Share Analysis
- 11.3.2 Top 3 Companies Market Share Analysis
- 11.4. List of Potential Customers
- 12. Research Methodology
List of Figures
- Figure 1: Global Spatial OMICS Market Revenue Breakdown (Million, %) by Region 2025 & 2033
- Figure 2: North America Spatial OMICS Market Revenue (Million), by Technology 2025 & 2033
- Figure 3: North America Spatial OMICS Market Revenue Share (%), by Technology 2025 & 2033
- Figure 4: North America Spatial OMICS Market Revenue (Million), by Product 2025 & 2033
- Figure 5: North America Spatial OMICS Market Revenue Share (%), by Product 2025 & 2033
- Figure 6: North America Spatial OMICS Market Revenue (Million), by Sample 2025 & 2033
- Figure 7: North America Spatial OMICS Market Revenue Share (%), by Sample 2025 & 2033
- Figure 8: North America Spatial OMICS Market Revenue (Million), by Application 2025 & 2033
- Figure 9: North America Spatial OMICS Market Revenue Share (%), by Application 2025 & 2033
- Figure 10: North America Spatial OMICS Market Revenue (Million), by End User 2025 & 2033
- Figure 11: North America Spatial OMICS Market Revenue Share (%), by End User 2025 & 2033
- Figure 12: North America Spatial OMICS Market Revenue (Million), by Country 2025 & 2033
- Figure 13: North America Spatial OMICS Market Revenue Share (%), by Country 2025 & 2033
- Figure 14: Europe Spatial OMICS Market Revenue (Million), by Technology 2025 & 2033
- Figure 15: Europe Spatial OMICS Market Revenue Share (%), by Technology 2025 & 2033
- Figure 16: Europe Spatial OMICS Market Revenue (Million), by Product 2025 & 2033
- Figure 17: Europe Spatial OMICS Market Revenue Share (%), by Product 2025 & 2033
- Figure 18: Europe Spatial OMICS Market Revenue (Million), by Sample 2025 & 2033
- Figure 19: Europe Spatial OMICS Market Revenue Share (%), by Sample 2025 & 2033
- Figure 20: Europe Spatial OMICS Market Revenue (Million), by Application 2025 & 2033
- Figure 21: Europe Spatial OMICS Market Revenue Share (%), by Application 2025 & 2033
- Figure 22: Europe Spatial OMICS Market Revenue (Million), by End User 2025 & 2033
- Figure 23: Europe Spatial OMICS Market Revenue Share (%), by End User 2025 & 2033
- Figure 24: Europe Spatial OMICS Market Revenue (Million), by Country 2025 & 2033
- Figure 25: Europe Spatial OMICS Market Revenue Share (%), by Country 2025 & 2033
- Figure 26: Asia Pacific Spatial OMICS Market Revenue (Million), by Technology 2025 & 2033
- Figure 27: Asia Pacific Spatial OMICS Market Revenue Share (%), by Technology 2025 & 2033
- Figure 28: Asia Pacific Spatial OMICS Market Revenue (Million), by Product 2025 & 2033
- Figure 29: Asia Pacific Spatial OMICS Market Revenue Share (%), by Product 2025 & 2033
- Figure 30: Asia Pacific Spatial OMICS Market Revenue (Million), by Sample 2025 & 2033
- Figure 31: Asia Pacific Spatial OMICS Market Revenue Share (%), by Sample 2025 & 2033
- Figure 32: Asia Pacific Spatial OMICS Market Revenue (Million), by Application 2025 & 2033
- Figure 33: Asia Pacific Spatial OMICS Market Revenue Share (%), by Application 2025 & 2033
- Figure 34: Asia Pacific Spatial OMICS Market Revenue (Million), by End User 2025 & 2033
- Figure 35: Asia Pacific Spatial OMICS Market Revenue Share (%), by End User 2025 & 2033
- Figure 36: Asia Pacific Spatial OMICS Market Revenue (Million), by Country 2025 & 2033
- Figure 37: Asia Pacific Spatial OMICS Market Revenue Share (%), by Country 2025 & 2033
- Figure 38: Rest of the World Spatial OMICS Market Revenue (Million), by Technology 2025 & 2033
- Figure 39: Rest of the World Spatial OMICS Market Revenue Share (%), by Technology 2025 & 2033
- Figure 40: Rest of the World Spatial OMICS Market Revenue (Million), by Product 2025 & 2033
- Figure 41: Rest of the World Spatial OMICS Market Revenue Share (%), by Product 2025 & 2033
- Figure 42: Rest of the World Spatial OMICS Market Revenue (Million), by Sample 2025 & 2033
- Figure 43: Rest of the World Spatial OMICS Market Revenue Share (%), by Sample 2025 & 2033
- Figure 44: Rest of the World Spatial OMICS Market Revenue (Million), by Application 2025 & 2033
- Figure 45: Rest of the World Spatial OMICS Market Revenue Share (%), by Application 2025 & 2033
- Figure 46: Rest of the World Spatial OMICS Market Revenue (Million), by End User 2025 & 2033
- Figure 47: Rest of the World Spatial OMICS Market Revenue Share (%), by End User 2025 & 2033
- Figure 48: Rest of the World Spatial OMICS Market Revenue (Million), by Country 2025 & 2033
- Figure 49: Rest of the World Spatial OMICS Market Revenue Share (%), by Country 2025 & 2033
List of Tables
- Table 1: Global Spatial OMICS Market Revenue Million Forecast, by Technology 2020 & 2033
- Table 2: Global Spatial OMICS Market Revenue Million Forecast, by Product 2020 & 2033
- Table 3: Global Spatial OMICS Market Revenue Million Forecast, by Sample 2020 & 2033
- Table 4: Global Spatial OMICS Market Revenue Million Forecast, by Application 2020 & 2033
- Table 5: Global Spatial OMICS Market Revenue Million Forecast, by End User 2020 & 2033
- Table 6: Global Spatial OMICS Market Revenue Million Forecast, by Region 2020 & 2033
- Table 7: Global Spatial OMICS Market Revenue Million Forecast, by Technology 2020 & 2033
- Table 8: Global Spatial OMICS Market Revenue Million Forecast, by Product 2020 & 2033
- Table 9: Global Spatial OMICS Market Revenue Million Forecast, by Sample 2020 & 2033
- Table 10: Global Spatial OMICS Market Revenue Million Forecast, by Application 2020 & 2033
- Table 11: Global Spatial OMICS Market Revenue Million Forecast, by End User 2020 & 2033
- Table 12: Global Spatial OMICS Market Revenue Million Forecast, by Country 2020 & 2033
- Table 13: United States Spatial OMICS Market Revenue (Million) Forecast, by Application 2020 & 2033
- Table 14: Canada Spatial OMICS Market Revenue (Million) Forecast, by Application 2020 & 2033
- Table 15: Mexico Spatial OMICS Market Revenue (Million) Forecast, by Application 2020 & 2033
- Table 16: Global Spatial OMICS Market Revenue Million Forecast, by Technology 2020 & 2033
- Table 17: Global Spatial OMICS Market Revenue Million Forecast, by Product 2020 & 2033
- Table 18: Global Spatial OMICS Market Revenue Million Forecast, by Sample 2020 & 2033
- Table 19: Global Spatial OMICS Market Revenue Million Forecast, by Application 2020 & 2033
- Table 20: Global Spatial OMICS Market Revenue Million Forecast, by End User 2020 & 2033
- Table 21: Global Spatial OMICS Market Revenue Million Forecast, by Country 2020 & 2033
- Table 22: Germany Spatial OMICS Market Revenue (Million) Forecast, by Application 2020 & 2033
- Table 23: United Kingdom Spatial OMICS Market Revenue (Million) Forecast, by Application 2020 & 2033
- Table 24: France Spatial OMICS Market Revenue (Million) Forecast, by Application 2020 & 2033
- Table 25: Italy Spatial OMICS Market Revenue (Million) Forecast, by Application 2020 & 2033
- Table 26: Spain Spatial OMICS Market Revenue (Million) Forecast, by Application 2020 & 2033
- Table 27: Rest of Europe Spatial OMICS Market Revenue (Million) Forecast, by Application 2020 & 2033
- Table 28: Global Spatial OMICS Market Revenue Million Forecast, by Technology 2020 & 2033
- Table 29: Global Spatial OMICS Market Revenue Million Forecast, by Product 2020 & 2033
- Table 30: Global Spatial OMICS Market Revenue Million Forecast, by Sample 2020 & 2033
- Table 31: Global Spatial OMICS Market Revenue Million Forecast, by Application 2020 & 2033
- Table 32: Global Spatial OMICS Market Revenue Million Forecast, by End User 2020 & 2033
- Table 33: Global Spatial OMICS Market Revenue Million Forecast, by Country 2020 & 2033
- Table 34: China Spatial OMICS Market Revenue (Million) Forecast, by Application 2020 & 2033
- Table 35: Japan Spatial OMICS Market Revenue (Million) Forecast, by Application 2020 & 2033
- Table 36: India Spatial OMICS Market Revenue (Million) Forecast, by Application 2020 & 2033
- Table 37: Australia Spatial OMICS Market Revenue (Million) Forecast, by Application 2020 & 2033
- Table 38: South Korea Spatial OMICS Market Revenue (Million) Forecast, by Application 2020 & 2033
- Table 39: Rest of Asia Pacific Spatial OMICS Market Revenue (Million) Forecast, by Application 2020 & 2033
- Table 40: Global Spatial OMICS Market Revenue Million Forecast, by Technology 2020 & 2033
- Table 41: Global Spatial OMICS Market Revenue Million Forecast, by Product 2020 & 2033
- Table 42: Global Spatial OMICS Market Revenue Million Forecast, by Sample 2020 & 2033
- Table 43: Global Spatial OMICS Market Revenue Million Forecast, by Application 2020 & 2033
- Table 44: Global Spatial OMICS Market Revenue Million Forecast, by End User 2020 & 2033
- Table 45: Global Spatial OMICS Market Revenue Million Forecast, by Country 2020 & 2033
Frequently Asked Questions
1. What is the projected Compound Annual Growth Rate (CAGR) of the Spatial OMICS Market?
The projected CAGR is approximately 10.60%.
2. Which companies are prominent players in the Spatial OMICS Market?
Key companies in the market include Akoya Biosciences Inc, Bruker, Danaher Corporation, Seven Bridges Genomics, 10x Genomics, Biognosys*List Not Exhaustive, Dovetail Genomics (Cantata Bio ), Bio-Techne, Ionpath Inc, PerkinElmer Inc, S2 Genomics Inc, NanoString Technologies Inc.
3. What are the main segments of the Spatial OMICS Market?
The market segments include Technology, Product, Sample, Application, End User.
4. Can you provide details about the market size?
The market size is estimated to be USD 335.60 Million as of 2022.
5. What are some drivers contributing to market growth?
High Burden of Cancer and Genetic Diseases; Advancement in Omics Technologies and Increasing Demand for Personalized Medicine; Rising Government Initiatives and Funding Activities.
6. What are the notable trends driving market growth?
The Spatial Transcriptomics Segment is Expected to Hold a Significant Market Share Over the Forecast Period.
7. Are there any restraints impacting market growth?
High Cost of Instruments and Data Storage; Complex Regulatory Requirement and Standardization Issues.
8. Can you provide examples of recent developments in the market?
March 2024: 10x Genomics initiated commercial distribution of its eagerly anticipated Visium HD Spatial Gene Expression instrument. Visium HD is engineered to empower researchers with the ability to thoroughly analyze FFPE tissue samples by quantifying spatial gene expression across the entire transcriptome at a single-cell resolution.
9. What pricing options are available for accessing the report?
Pricing options include single-user, multi-user, and enterprise licenses priced at USD 4750, USD 5250, and USD 8750 respectively.
10. Is the market size provided in terms of value or volume?
The market size is provided in terms of value, measured in Million.
11. Are there any specific market keywords associated with the report?
Yes, the market keyword associated with the report is "Spatial OMICS Market," which aids in identifying and referencing the specific market segment covered.
12. How do I determine which pricing option suits my needs best?
The pricing options vary based on user requirements and access needs. Individual users may opt for single-user licenses, while businesses requiring broader access may choose multi-user or enterprise licenses for cost-effective access to the report.
13. Are there any additional resources or data provided in the Spatial OMICS Market report?
While the report offers comprehensive insights, it's advisable to review the specific contents or supplementary materials provided to ascertain if additional resources or data are available.
14. How can I stay updated on further developments or reports in the Spatial OMICS Market?
To stay informed about further developments, trends, and reports in the Spatial OMICS Market, consider subscribing to industry newsletters, following relevant companies and organizations, or regularly checking reputable industry news sources and publications.
Methodology
Step 1 - Identification of Relevant Samples Size from Population Database


Step 2 - Approaches for Defining Global Market Size (Value, Volume* & Price*)

Note*: In applicable scenarios
Step 3 - Data Sources
Primary Research
- Web Analytics
- Survey Reports
- Research Institute
- Latest Research Reports
- Opinion Leaders
Secondary Research
- Annual Reports
- White Paper
- Latest Press Release
- Industry Association
- Paid Database
- Investor Presentations

Step 4 - Data Triangulation
Involves using different sources of information in order to increase the validity of a study
These sources are likely to be stakeholders in a program - participants, other researchers, program staff, other community members, and so on.
Then we put all data in single framework & apply various statistical tools to find out the dynamic on the market.
During the analysis stage, feedback from the stakeholder groups would be compared to determine areas of agreement as well as areas of divergence