


Key Insights for Specialty Insurance Market
The global Specialty Insurance Market, valued at an estimated $100.4 billion in 2024, is poised for robust expansion, projected to achieve a Compound Annual Growth Rate (CAGR) of 7% from 2024 to 2034. This trajectory indicates a substantial market valuation approaching $197.5 billion by the end of the forecast period. The market's significant growth is primarily underpinned by the escalating complexity of global risks, including advanced cyber threats, climate change impacts, geopolitical instability, and intricate regulatory landscapes across diverse industries. Demand for highly customized and nuanced insurance solutions is intensifying, driven by sectors such as aerospace, marine, energy, and technology, which face unique and specialized risk exposures beyond the scope of traditional general insurance offerings. The fundamental shift towards a more interconnected and volatile global economy mandates bespoke coverage, moving beyond the broader provisions of the General Insurance Market.
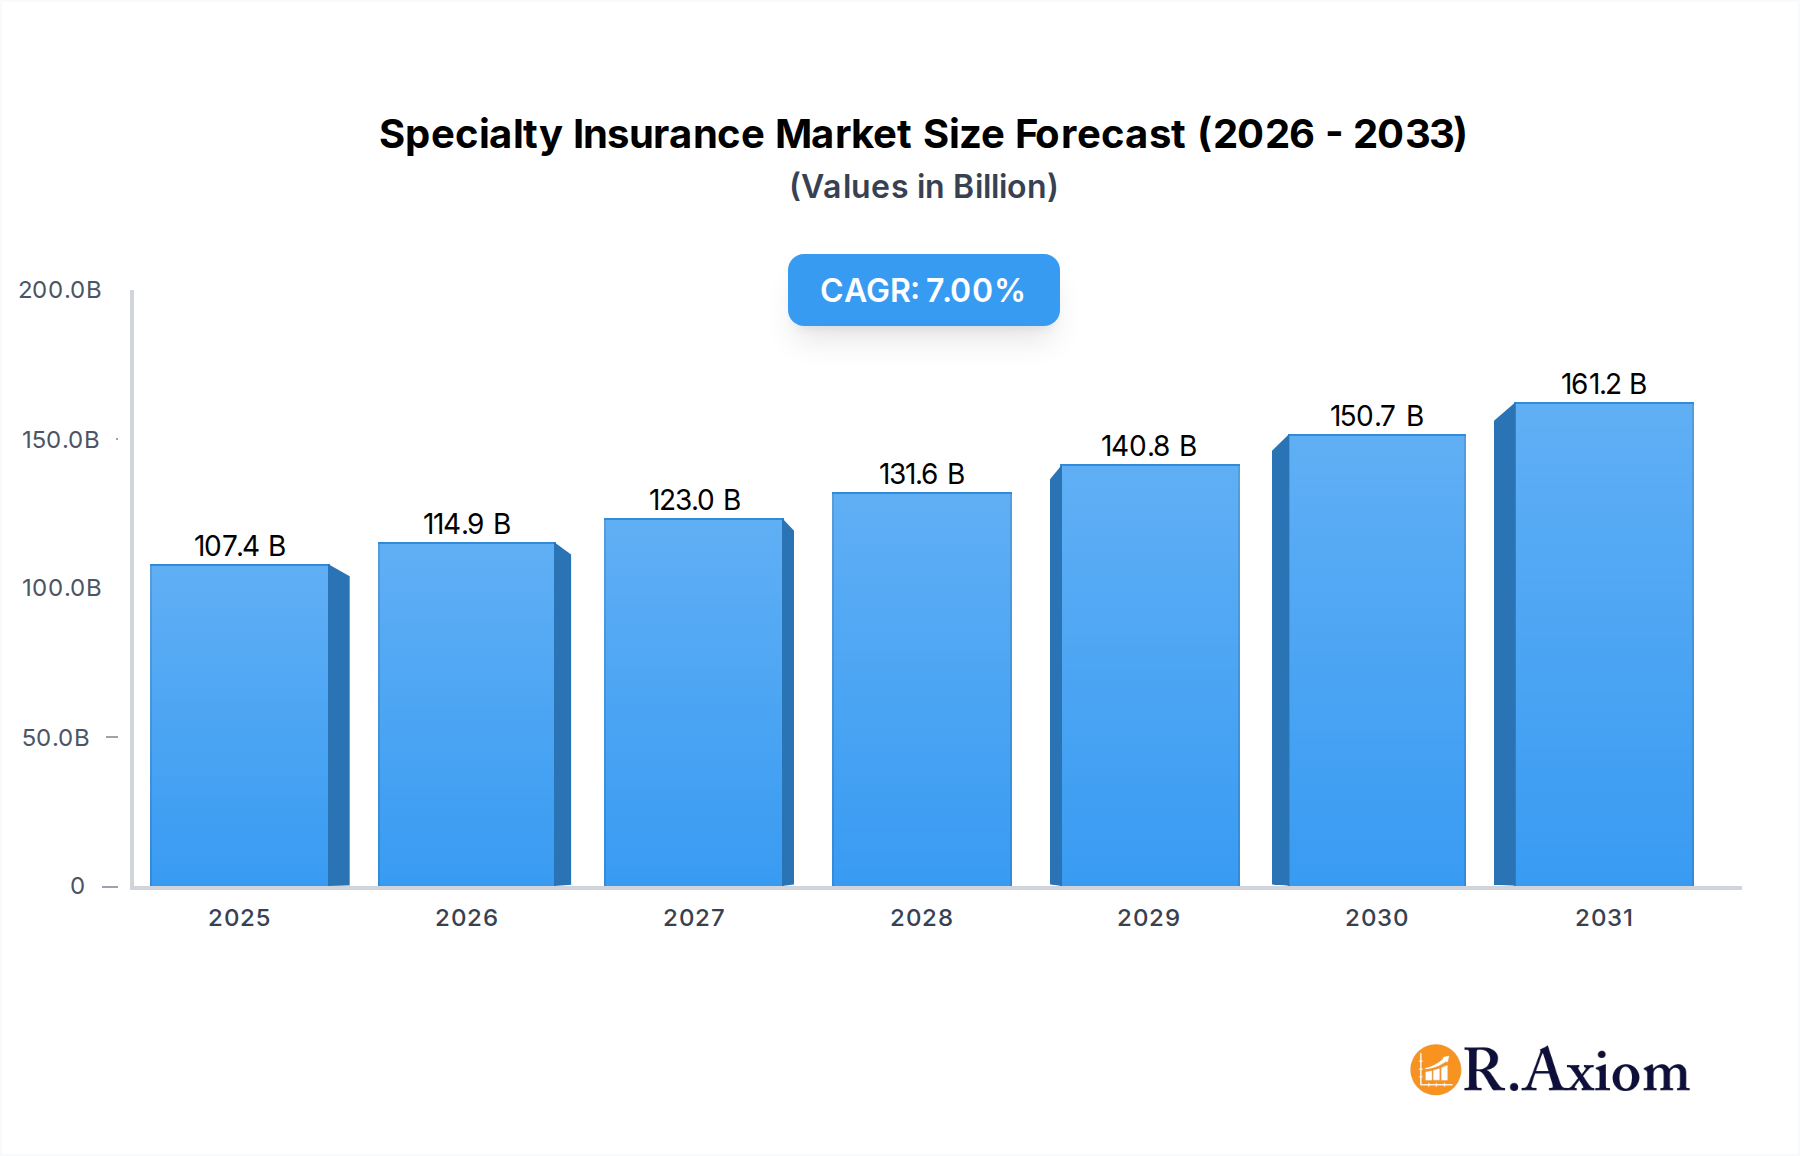
Specialty Insurance Market Size (In Billion)

Key demand drivers encompass the rapid digital transformation across enterprises, which fuels the expansion of the Cyber Liability Insurance Market, alongside the increasing frequency and severity of natural catastrophic events necessitating specialized property and business interruption coverage. Furthermore, the continuous emergence of niche industries and specialized professions, ranging from drone operations to biotechnology and renewable energy projects, inherently creates new risk profiles requiring tailored protection. Macro tailwinds, such as sustained global economic growth in developing regions, increased foreign direct investment, and advancements in scientific and industrial technologies, contribute to a broader risk landscape that demands sophisticated mitigation strategies. The proliferation of digital platforms is also transforming distribution, making specialized products more accessible, thereby contributing to market penetration and growth. The overall outlook for the Specialty Insurance Market remains exceptionally positive, characterized by continuous innovation in product design, strategic partnerships to broaden expertise, and a concerted effort by insurers to enhance their specialized underwriting capabilities. This adaptation is crucial for effectively navigating an increasingly complex and evolving global risk environment, which also benefits from the capabilities offered by the expanding Insurtech Market. The growing awareness and demand for tailored protection in consumer segments, evidenced by the rising adoption in the Pet Insurance Market, further underscores the market's diversification and underlying resilience. Insurers are increasingly leveraging advanced analytics and data-driven insights to develop innovative policies and pricing models, ensuring they remain agile in addressing dynamic risk exposures and maintaining competitive advantage within this lucrative sector.
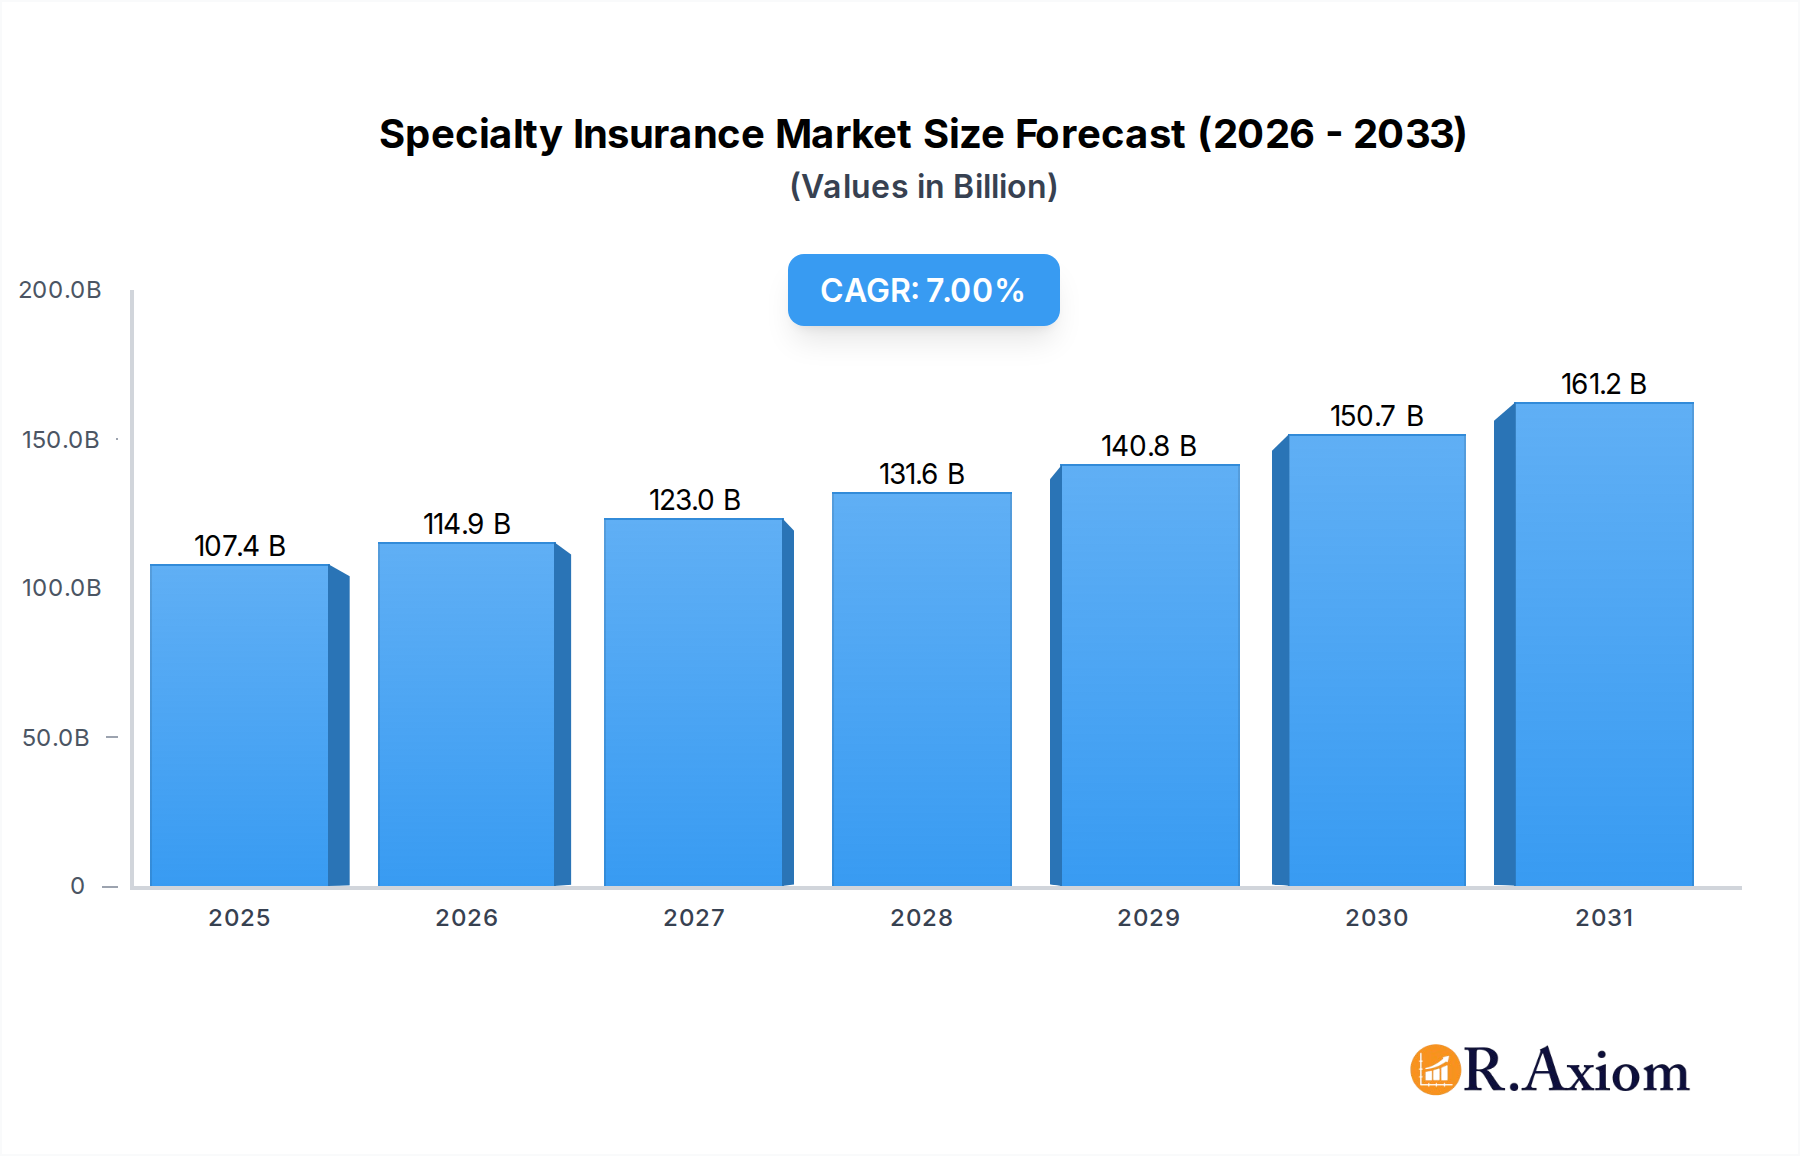
Specialty Insurance Company Market Share
Dominant Commercial Auto Insurance Market in Specialty Insurance Market
Within the diverse landscape of the Specialty Insurance Market, the Commercial Auto Insurance Market stands out as a dominant segment, contributing a substantial share to the overall revenue. This segment's preeminence is attributable to several intrinsic factors that underscore its critical role in commercial operations globally. Businesses of all sizes, from small local enterprises to large multinational corporations, rely heavily on fleets of vehicles for transportation, logistics, and service delivery across myriad sectors, including retail, construction, manufacturing, and ride-sharing. This ubiquitous reliance creates an inherent and constant demand for comprehensive commercial auto coverage that extends beyond standard personal policies. The mandatory nature of commercial auto insurance in most jurisdictions worldwide, driven by stringent regulatory frameworks concerning liability, driver safety, and vehicle operation, further solidifies its market position and ensures a consistent premium base. The continuous expansion of the global transportation and logistics industry, propelled by e-commerce growth and evolving supply chain demands, directly correlates with the rising need for robust commercial auto insurance solutions. Furthermore, the increasing adoption of advanced fleet management technologies, such as telematics and predictive analytics, is transforming risk assessment and pricing models within this segment, allowing for more granular and usage-based insurance products, thereby driving innovation and market value.
Key players in the broader Specialty Insurance Market, including giants like Travelers, Liberty Mutual, and The Hartford, dedicate significant resources to their commercial auto offerings, recognizing the segment's consistent premium volume and growth potential. These insurers provide a wide array of specialized coverages, such as collision, comprehensive, liability, uninsured/underinsured motorist, and fleet-specific policies designed to address the unique operational risks faced by businesses. The market dominance is also fueled by the increasing complexity of commercial fleet management, which involves diverse vehicle types, varying usage patterns, and evolving regulatory compliance requirements that influence risk assessment. Specialized niches within this segment, such as coverage for hazardous materials transport, oversized load carriers, or ride-sharing and last-mile delivery fleets, showcase the market's capability to offer highly tailored products. While other segments like the Ocean Marine Insurance Market or Cyber Liability Insurance Market demonstrate high growth in their respective niches, the sheer volume and regulatory imperative associated with commercial vehicular operations ensure the Commercial Auto Insurance Market maintains its leading revenue share. The segment is characterized by steady growth, driven by sustained economic activity and the essential function of commercial vehicles in a globalized economy, rather than rapid consolidation, as demand remains widespread across myriad industries and enterprise sizes, consistently expanding to meet new operational paradigms.
Key Market Drivers & Constraints in Specialty Insurance Market
The Specialty Insurance Market is profoundly influenced by a complex interplay of drivers and constraints, each presenting distinct opportunities and challenges. A primary driver is the escalation of complex and emerging risks, particularly the exponential growth in cyber threats. The global economic cost of cybercrime is projected to rise significantly, pushing enterprises across all sectors to invest in the Cyber Liability Insurance Market to mitigate financial and reputational damage from data breaches and ransomware attacks. This is further intensified by digital transformation initiatives, with an estimated 70% of organizations expected to increase their cybersecurity spending by 2025.
Another significant driver is the increasing regulatory complexity and compliance mandates. Industries such as healthcare, finance, and energy face ever-evolving national and international regulations. For instance, new data privacy laws globally necessitate specialized professional liability and errors & omissions coverage for sectors like the Healthcare Insurance Market. Moreover, the dynamic geopolitical landscape and trade uncertainties spur demand for political risk, trade credit, and supply chain disruption insurance as companies protect investments in volatile regions. Climate change acts as a critical driver, with the increasing frequency and severity of extreme weather events necessitating specialized catastrophe and property insurance solutions. Data from the World Economic Forum consistently ranks climate action failure as a top global risk, driving demand for innovative insurance products.
Conversely, several constraints impede the Specialty Insurance Market's full potential. Economic volatility and geopolitical instability can reduce business investments, consequently dampening demand for project-specific or M&A-related specialty coverages. The lack of highly specialized underwriting talent represents a significant bottleneck. Underwriting niche risks requires deep industry-specific knowledge, a skill set that is scarce and costly to develop, leading to capacity limitations. Furthermore, the difficulty in accurate risk modeling for novel risks (e.g., advanced AI, space tourism) poses a challenge. Traditional actuarial models often lack sufficient historical data, making pricing and reserving more complex. While the adoption of advanced analytics and Risk Management Software Market solutions is growing, the initial investment and integration complexity can slow market response. Finally, intense price competition in more mature specialty segments can compress profit margins, pushing insurers to continually innovate while maintaining underwriting discipline.
Competitive Ecosystem of Specialty Insurance Market
The competitive landscape of the Specialty Insurance Market is characterized by a blend of global giants, specialized underwriters, and innovative Insurtech Market players, all vying for market share by offering tailored risk solutions. The market demands deep underwriting expertise and robust capital to cover unique and often high-severity exposures. Key participants include:
- AIG: This multinational finance and insurance corporation maintains a strong presence across various specialty lines, focusing on areas like aerospace, environmental, and political risk insurance through its global network.
- Chubb: Known for its superior underwriting and claims service, Chubb is a significant player in commercial specialty segments, offering customized solutions for industries such as technology, life sciences, and entertainment.
- Zurich Insurance Group: A leading multi-line insurer, Zurich offers a broad portfolio of specialty products globally, including marine, energy, and construction insurance, with a strategic focus on expanding digital capabilities.
- Allianz: As one of the world's largest insurers, Allianz provides a comprehensive range of specialty coverages through its AGCS unit, specializing in corporate, industrial, and highly specific insurance needs like marine and aviation.
- AXA XL: A division of AXA, AXA XL is renowned for its commercial property & casualty and specialty insurance offerings, with a strong emphasis on large corporate risks across various sectors, including fine art and professional lines.
- Munich Re: As a leading global reinsurer, Munich Re provides crucial capacity and expertise to primary insurers in the Specialty Insurance Market, particularly for complex and catastrophic risks, including cyber and climate-related exposures.
- Swiss Re: Another major global reinsurer, Swiss Re offers a wide range of reinsurance products and services across property, casualty, and life and health segments, supporting the Specialty Insurance Market with significant capital and risk transfer solutions.
- The Hartford: With a strong focus on property & casualty insurance, The Hartford offers specialty solutions for various business segments, including construction, technology, and marine, emphasizing risk management services.
- Travelers: A diversified insurance company, Travelers provides specialty coverages for specific industries and unique risks, including public entities, national accounts, and marine insurance, leveraging its extensive distribution network.
- Liberty Mutual: A global insurer, Liberty Mutual offers a comprehensive suite of specialty products through its Global Risk Solutions division, catering to large commercial and specialty clients across industries like energy and construction.
- Tokio Marine Holdings: A prominent Japanese insurance group with a significant international footprint, Tokio Marine offers a range of specialty products globally, including marine, aviation, and energy insurance, supported by its strong financial standing.
- Lloyd's of London: A unique insurance marketplace, Lloyd's is central to the Specialty Insurance Market, providing a platform for underwriters to cover highly unusual, complex, and large-scale risks across virtually every sector.
- Sompo Holdings: A leading Japanese insurer with expanding global operations, Sompo Holdings provides various specialty insurance products, including agriculture, cyber, and marine insurance, with a strategic focus on its international commercial lines.
Recent Developments & Milestones in Specialty Insurance Market
The Specialty Insurance Market has witnessed dynamic activity reflecting its adaptability and growth orientation. These developments underscore the industry's response to evolving risk landscapes and technological advancements.
- January 2024: Major insurers, driven by heightened demand from the Cyber Liability Insurance Market, announced enhanced cyber risk assessment platforms integrating AI-driven threat intelligence to improve underwriting accuracy and expedite claims processing for corporate clients.
- March 2024: A consortium of leading insurers and Insurtech Market startups launched a new blockchain-based platform designed to streamline the placement and management of complex specialty risks, particularly in the Ocean Marine Insurance Market, aiming for greater transparency and efficiency in policy administration.
- May 2024: Several European carriers expanded their offerings in the Healthcare Insurance Market, introducing new professional liability policies specifically tailored for emerging medical technologies and telemedicine practices, responding to regulatory shifts and digital health adoption.
- July 2024: A prominent global insurer announced a strategic partnership with a leading analytics firm to develop advanced parametric insurance products for climate-related risks, specifically targeting agricultural and Construction Insurance Market clients in climate-vulnerable regions.
- September 2024: Following the growth in unique consumer risk profiles, a specialized underwriter introduced an innovative suite of bespoke policies for the Pet Insurance Market, including coverage for exotic animals and high-value pet surgeries, alongside digital claims processing enhancements.
- November 2024: Regulatory bodies in North America initiated consultations on harmonizing standards for specialized data privacy insurance, aiming to provide clearer guidelines for insurers and policyholders in the increasingly complex data protection landscape.
Regional Market Breakdown for Specialty Insurance Market
The global Specialty Insurance Market exhibits significant regional variations in terms of size, growth dynamics, and dominant risk profiles. Analyzing at least four key regions provides a comprehensive understanding of these disparities.
North America holds the largest revenue share in the Specialty Insurance Market, primarily driven by the United States and Canada. This dominance stems from a highly mature and sophisticated insurance industry, a robust regulatory framework, high corporate awareness of complex risks, and significant technological adoption. The region is a hub for innovation, with strong demand across segments like the Cyber Liability Insurance Market, professional liability, and aviation. Its large enterprise base and diverse, specialized industries ensure a stable yet strong growth rate.
Europe represents the second-largest market, characterized by a complex and comprehensive regulatory environment (e.g., Solvency II) and a strong demand from traditional industries such as manufacturing, marine, and energy. Countries like the UK (particularly Lloyd's of London) and Germany are key contributors, specializing in areas such as the Ocean Marine Insurance Market, political risk, and environmental liability. The European market sees consistent growth, driven by cross-border trade, evolving climate-related regulations, and the need for sophisticated risk transfer solutions. Its robust CAGR reflects ongoing adaptation to new risk paradigms.
Asia Pacific is identified as the fastest-growing region within the Specialty Insurance Market. Countries such as China, India, and Japan are experiencing rapid industrialization, urbanization, and technological advancement, leading to an increased demand for specialized coverage in areas like infrastructure development, technology, and supply chain. While penetration rates were historically lower than in Western markets, rising affluence, increasing risk awareness, and supportive government initiatives are fueling significant expansion. The region's diverse economic landscape and susceptibility to natural catastrophes further amplify the need for tailored insurance products, projecting a superior CAGR over the forecast period.
Middle East & Africa (MEA) and South America collectively constitute emerging but rapidly expanding markets for specialty insurance. In MEA, significant infrastructure projects, energy sector investments, and growing commercial ventures, particularly within the GCC, drive demand for project-specific, political risk, and energy insurance. South America, led by Brazil and Argentina, shows increasing demand tied to natural resources, agriculture, and construction activities. Both regions are characterized by lower current market penetration but demonstrate substantial growth potential as economies mature and businesses become more attuned to specialized risk management, contributing to a healthy collective CAGR. These regions are actively addressing specific local challenges through tailored specialty insurance products, reflecting their dynamic evolution.
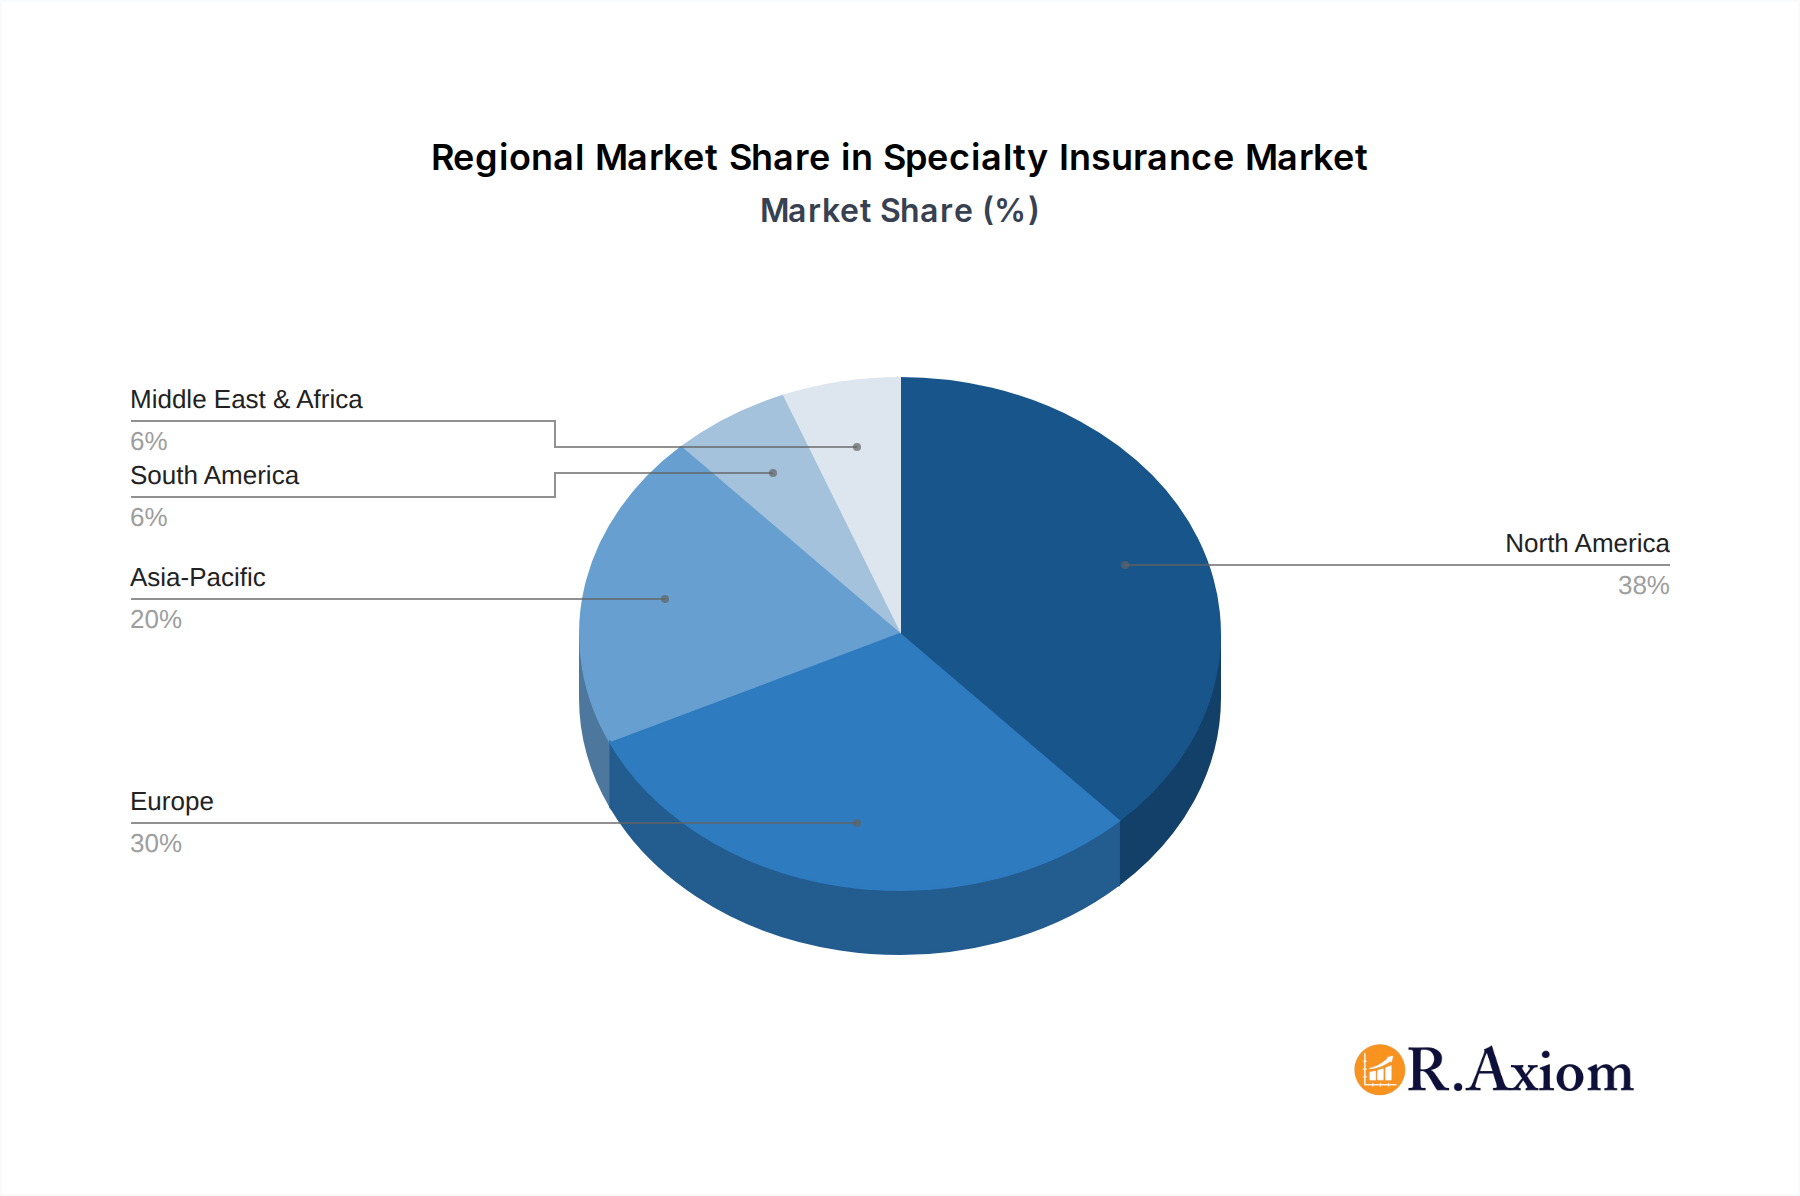
Specialty Insurance Regional Market Share
Supply Chain & Raw Material Dynamics for Specialty Insurance Market
While not reliant on tangible raw materials in the traditional sense, the Specialty Insurance Market operates within a sophisticated 'information supply chain' that is critical for its functioning and resilience. The core 'raw materials' for specialty insurers are high-quality data, actuarial expertise, underwriting intelligence, and capital. Upstream dependencies include specialized data providers offering insights into weather patterns, cyber threat landscapes, property valuations, and claims history. Vendors of advanced analytics and Risk Management Software Market solutions are crucial, as these tools transform raw data into actionable intelligence for risk assessment and pricing. Reinsurance capacity is another fundamental input, acting as a financial backstop that enables primary insurers to underwrite large and complex risks by transferring a portion of their exposure.
Sourcing risks in this chain are substantial. Data accuracy and integrity are paramount; erroneous data can lead to mispriced policies and significant losses. Data privacy regulations, such as GDPR and CCPA, introduce complexities in data sourcing and management, increasing compliance costs and potential legal risks. The availability and cost of reinsurance capacity can fluctuate significantly, particularly after major catastrophic events, leading to higher premiums for primary insurers and potentially impacting the capacity to underwrite new risks. For instance, global reinsurance rates have seen upward trends, with property catastrophe reinsurance experiencing price increases in the range of 10-30% in recent renewal cycles, driven by higher loss ratios. The specialized human capital—underwriters, actuaries, and claims specialists with deep sector-specific knowledge—is also a 'raw material' in short supply, creating wage inflation and capacity constraints.
Supply chain disruptions for specialty insurers can manifest as failures in data delivery, cybersecurity breaches affecting proprietary models, or a sudden contraction in reinsurance market capacity. Historically, large-scale natural disasters or global financial crises have constrained reinsurance availability, leading to tighter underwriting conditions and increased premiums across various specialty lines, including the Ocean Marine Insurance Market. Geopolitical tensions can also disrupt data flows and impact the financial stability of reinsurance markets. The ongoing development of AI and machine learning tools, while enhancing capabilities, also introduces new dependencies on sophisticated IT infrastructure and skilled data scientists, creating new points of potential vulnerability in this 'information supply chain'.
Regulatory & Policy Landscape Shaping Specialty Insurance Market
The Specialty Insurance Market operates under a multifaceted and often intricate regulatory and policy landscape that varies significantly across jurisdictions, reflecting the diverse and specialized nature of the risks it covers. Key regulatory frameworks include Solvency II in the European Union, the National Association of Insurance Commissioners (NAIC) in the United States, and the Prudential Regulation Authority (PRA) in the UK, among others. These frameworks primarily focus on capital adequacy, governance, risk management, and transparency to ensure the financial stability of insurers and protect policyholders.
For specific segments like the Ocean Marine Insurance Market, international conventions such as the International Maritime Organization (IMO) regulations and local maritime laws heavily influence policy design and liability limits. The Cyber Liability Insurance Market is increasingly shaped by evolving data privacy laws globally, including GDPR (Europe), CCPA (California), and other national data protection acts, which dictate reporting requirements and define insurable events related to data breaches. Recent policy changes include increased scrutiny on systemic risks, such as climate-related financial disclosures and the embedding of environmental, social, and governance (ESG) factors into underwriting processes. Regulators are pressing insurers to better assess and disclose their exposures to climate risks and how they are supporting the transition to a low-carbon economy. For instance, the EU's Sustainable Finance Disclosure Regulation (SFDR) impacts how insurers classify and market their products.
Moreover, sector-specific regulations play a crucial role. For the Healthcare Insurance Market, policies are heavily influenced by national healthcare laws, patient data protection (e.g., HIPAA in the US), and medical malpractice statutes. The Construction Insurance Market is shaped by national building codes, project finance regulations, and specific liability laws pertaining to large-scale infrastructure projects. The increasing complexity of international trade and global supply chains also necessitates compliance with sanctions regimes and anti-money laundering (AML) regulations, directly impacting trade credit and political risk insurance. The absence of a single, unified global regulatory body means insurers must navigate a patchwork of national and regional rules, often requiring localized expertise and adaptive compliance strategies. The ongoing evolution of technology, particularly in areas like AI and blockchain, is prompting regulators to develop new guidelines to address emerging risks and ensure market integrity and consumer protection.
Specialty Insurance Segmentation
-
1. Type
- 1.1. Ocean Marine Insurance
- 1.2. Commercial Auto Insurance
- 1.3. Flood Insurance
- 1.4. Pet Insurance
- 1.5. Wedding Insurance
- 1.6. Jewelry Insurance
- 1.7. Cyber Liability Insurance
- 1.8. Commercial Umbrella Insurance
- 1.9. Others
-
2. Enterprise Size
- 2.1. Large Enterprises
- 2.2. Small & Medium Enterprises (SMEs)
-
3. Distribution Channel
- 3.1. Direct Sales
- 3.2. Brokers & Agents
- 3.3. Bancassurance
- 3.4. Digital Platforms
-
4. End User Industry
- 4.1. BFSI
- 4.2. Healthcare & Life Sciences
- 4.3. Manufacturing
- 4.4. Energy & Utilities
- 4.5. Construction & Infrastructure
- 4.6. Transportation & Logistics
- 4.7. Aerospace & Defense
- 4.8. Marine & Shipping
- 4.9. Others
Specialty Insurance Segmentation By Geography
-
1. North America
- 1.1. United States
- 1.2. Canada
- 1.3. Mexico
-
2. South America
- 2.1. Brazil
- 2.2. Argentina
- 2.3. Rest of South America
-
3. Europe
- 3.1. United Kingdom
- 3.2. Germany
- 3.3. France
- 3.4. Italy
- 3.5. Spain
- 3.6. Russia
- 3.7. Benelux
- 3.8. Nordics
- 3.9. Rest of Europe
-
4. Middle East & Africa
- 4.1. Turkey
- 4.2. Israel
- 4.3. GCC
- 4.4. North Africa
- 4.5. South Africa
- 4.6. Rest of Middle East & Africa
-
5. Asia Pacific
- 5.1. China
- 5.2. India
- 5.3. Japan
- 5.4. South Korea
- 5.5. ASEAN
- 5.6. Oceania
- 5.7. Rest of Asia Pacific
Specialty Insurance Regional Market Share
Geographic Coverage of Specialty Insurance
Specialty Insurance REPORT HIGHLIGHTS
| Aspects | Details |
|---|---|
| Study Period | 2020-2034 |
| Base Year | 2025 |
| Estimated Year | 2026 |
| Forecast Period | 2026-2034 |
| Historical Period | 2020-2025 |
| Growth Rate | CAGR of 7% from 2020-2034 |
| Segmentation |
|
Table of Contents
- 1. Introduction
- 1.1. Research Scope
- 1.2. Market Segmentation
- 1.3. Research Objective
- 1.4. Definitions and Assumptions
- 2. Executive Summary
- 2.1. Market Snapshot
- 3. Market Dynamics
- 3.1. Market Drivers
- 3.2. Market Restrains
- 3.3. Market Trends
- 3.4. Market Opportunities
- 4. Market Factor Analysis
- 4.1. Porters Five Forces
- 4.1.1. Bargaining Power of Suppliers
- 4.1.2. Bargaining Power of Buyers
- 4.1.3. Threat of New Entrants
- 4.1.4. Threat of Substitutes
- 4.1.5. Competitive Rivalry
- 4.2. PESTEL analysis
- 4.3. BCG Analysis
- 4.3.1. Stars (High Growth, High Market Share)
- 4.3.2. Cash Cows (Low Growth, High Market Share)
- 4.3.3. Question Mark (High Growth, Low Market Share)
- 4.3.4. Dogs (Low Growth, Low Market Share)
- 4.4. Ansoff Matrix Analysis
- 4.5. Supply Chain Analysis
- 4.6. Regulatory Landscape
- 4.7. Current Market Potential and Opportunity Assessment (TAM–SAM–SOM Framework)
- 4.8. RAX Analyst Note
- 4.1. Porters Five Forces
- 5. Market Analysis, Insights and Forecast 2021-2033
- 5.1. Market Analysis, Insights and Forecast - by Type
- 5.1.1. Ocean Marine Insurance
- 5.1.2. Commercial Auto Insurance
- 5.1.3. Flood Insurance
- 5.1.4. Pet Insurance
- 5.1.5. Wedding Insurance
- 5.1.6. Jewelry Insurance
- 5.1.7. Cyber Liability Insurance
- 5.1.8. Commercial Umbrella Insurance
- 5.1.9. Others
- 5.2. Market Analysis, Insights and Forecast - by Enterprise Size
- 5.2.1. Large Enterprises
- 5.2.2. Small & Medium Enterprises (SMEs)
- 5.3. Market Analysis, Insights and Forecast - by Distribution Channel
- 5.3.1. Direct Sales
- 5.3.2. Brokers & Agents
- 5.3.3. Bancassurance
- 5.3.4. Digital Platforms
- 5.4. Market Analysis, Insights and Forecast - by End User Industry
- 5.4.1. BFSI
- 5.4.2. Healthcare & Life Sciences
- 5.4.3. Manufacturing
- 5.4.4. Energy & Utilities
- 5.4.5. Construction & Infrastructure
- 5.4.6. Transportation & Logistics
- 5.4.7. Aerospace & Defense
- 5.4.8. Marine & Shipping
- 5.4.9. Others
- 5.5. Market Analysis, Insights and Forecast - by Region
- 5.5.1. North America
- 5.5.2. South America
- 5.5.3. Europe
- 5.5.4. Middle East & Africa
- 5.5.5. Asia Pacific
- 5.1. Market Analysis, Insights and Forecast - by Type
- 6. Global Specialty Insurance Analysis, Insights and Forecast, 2021-2033
- 6.1. Market Analysis, Insights and Forecast - by Type
- 6.1.1. Ocean Marine Insurance
- 6.1.2. Commercial Auto Insurance
- 6.1.3. Flood Insurance
- 6.1.4. Pet Insurance
- 6.1.5. Wedding Insurance
- 6.1.6. Jewelry Insurance
- 6.1.7. Cyber Liability Insurance
- 6.1.8. Commercial Umbrella Insurance
- 6.1.9. Others
- 6.2. Market Analysis, Insights and Forecast - by Enterprise Size
- 6.2.1. Large Enterprises
- 6.2.2. Small & Medium Enterprises (SMEs)
- 6.3. Market Analysis, Insights and Forecast - by Distribution Channel
- 6.3.1. Direct Sales
- 6.3.2. Brokers & Agents
- 6.3.3. Bancassurance
- 6.3.4. Digital Platforms
- 6.4. Market Analysis, Insights and Forecast - by End User Industry
- 6.4.1. BFSI
- 6.4.2. Healthcare & Life Sciences
- 6.4.3. Manufacturing
- 6.4.4. Energy & Utilities
- 6.4.5. Construction & Infrastructure
- 6.4.6. Transportation & Logistics
- 6.4.7. Aerospace & Defense
- 6.4.8. Marine & Shipping
- 6.4.9. Others
- 6.1. Market Analysis, Insights and Forecast - by Type
- 7. North America Specialty Insurance Analysis, Insights and Forecast, 2020-2032
- 7.1. Market Analysis, Insights and Forecast - by Type
- 7.1.1. Ocean Marine Insurance
- 7.1.2. Commercial Auto Insurance
- 7.1.3. Flood Insurance
- 7.1.4. Pet Insurance
- 7.1.5. Wedding Insurance
- 7.1.6. Jewelry Insurance
- 7.1.7. Cyber Liability Insurance
- 7.1.8. Commercial Umbrella Insurance
- 7.1.9. Others
- 7.2. Market Analysis, Insights and Forecast - by Enterprise Size
- 7.2.1. Large Enterprises
- 7.2.2. Small & Medium Enterprises (SMEs)
- 7.3. Market Analysis, Insights and Forecast - by Distribution Channel
- 7.3.1. Direct Sales
- 7.3.2. Brokers & Agents
- 7.3.3. Bancassurance
- 7.3.4. Digital Platforms
- 7.4. Market Analysis, Insights and Forecast - by End User Industry
- 7.4.1. BFSI
- 7.4.2. Healthcare & Life Sciences
- 7.4.3. Manufacturing
- 7.4.4. Energy & Utilities
- 7.4.5. Construction & Infrastructure
- 7.4.6. Transportation & Logistics
- 7.4.7. Aerospace & Defense
- 7.4.8. Marine & Shipping
- 7.4.9. Others
- 7.1. Market Analysis, Insights and Forecast - by Type
- 8. South America Specialty Insurance Analysis, Insights and Forecast, 2020-2032
- 8.1. Market Analysis, Insights and Forecast - by Type
- 8.1.1. Ocean Marine Insurance
- 8.1.2. Commercial Auto Insurance
- 8.1.3. Flood Insurance
- 8.1.4. Pet Insurance
- 8.1.5. Wedding Insurance
- 8.1.6. Jewelry Insurance
- 8.1.7. Cyber Liability Insurance
- 8.1.8. Commercial Umbrella Insurance
- 8.1.9. Others
- 8.2. Market Analysis, Insights and Forecast - by Enterprise Size
- 8.2.1. Large Enterprises
- 8.2.2. Small & Medium Enterprises (SMEs)
- 8.3. Market Analysis, Insights and Forecast - by Distribution Channel
- 8.3.1. Direct Sales
- 8.3.2. Brokers & Agents
- 8.3.3. Bancassurance
- 8.3.4. Digital Platforms
- 8.4. Market Analysis, Insights and Forecast - by End User Industry
- 8.4.1. BFSI
- 8.4.2. Healthcare & Life Sciences
- 8.4.3. Manufacturing
- 8.4.4. Energy & Utilities
- 8.4.5. Construction & Infrastructure
- 8.4.6. Transportation & Logistics
- 8.4.7. Aerospace & Defense
- 8.4.8. Marine & Shipping
- 8.4.9. Others
- 8.1. Market Analysis, Insights and Forecast - by Type
- 9. Europe Specialty Insurance Analysis, Insights and Forecast, 2020-2032
- 9.1. Market Analysis, Insights and Forecast - by Type
- 9.1.1. Ocean Marine Insurance
- 9.1.2. Commercial Auto Insurance
- 9.1.3. Flood Insurance
- 9.1.4. Pet Insurance
- 9.1.5. Wedding Insurance
- 9.1.6. Jewelry Insurance
- 9.1.7. Cyber Liability Insurance
- 9.1.8. Commercial Umbrella Insurance
- 9.1.9. Others
- 9.2. Market Analysis, Insights and Forecast - by Enterprise Size
- 9.2.1. Large Enterprises
- 9.2.2. Small & Medium Enterprises (SMEs)
- 9.3. Market Analysis, Insights and Forecast - by Distribution Channel
- 9.3.1. Direct Sales
- 9.3.2. Brokers & Agents
- 9.3.3. Bancassurance
- 9.3.4. Digital Platforms
- 9.4. Market Analysis, Insights and Forecast - by End User Industry
- 9.4.1. BFSI
- 9.4.2. Healthcare & Life Sciences
- 9.4.3. Manufacturing
- 9.4.4. Energy & Utilities
- 9.4.5. Construction & Infrastructure
- 9.4.6. Transportation & Logistics
- 9.4.7. Aerospace & Defense
- 9.4.8. Marine & Shipping
- 9.4.9. Others
- 9.1. Market Analysis, Insights and Forecast - by Type
- 10. Middle East & Africa Specialty Insurance Analysis, Insights and Forecast, 2020-2032
- 10.1. Market Analysis, Insights and Forecast - by Type
- 10.1.1. Ocean Marine Insurance
- 10.1.2. Commercial Auto Insurance
- 10.1.3. Flood Insurance
- 10.1.4. Pet Insurance
- 10.1.5. Wedding Insurance
- 10.1.6. Jewelry Insurance
- 10.1.7. Cyber Liability Insurance
- 10.1.8. Commercial Umbrella Insurance
- 10.1.9. Others
- 10.2. Market Analysis, Insights and Forecast - by Enterprise Size
- 10.2.1. Large Enterprises
- 10.2.2. Small & Medium Enterprises (SMEs)
- 10.3. Market Analysis, Insights and Forecast - by Distribution Channel
- 10.3.1. Direct Sales
- 10.3.2. Brokers & Agents
- 10.3.3. Bancassurance
- 10.3.4. Digital Platforms
- 10.4. Market Analysis, Insights and Forecast - by End User Industry
- 10.4.1. BFSI
- 10.4.2. Healthcare & Life Sciences
- 10.4.3. Manufacturing
- 10.4.4. Energy & Utilities
- 10.4.5. Construction & Infrastructure
- 10.4.6. Transportation & Logistics
- 10.4.7. Aerospace & Defense
- 10.4.8. Marine & Shipping
- 10.4.9. Others
- 10.1. Market Analysis, Insights and Forecast - by Type
- 11. Asia Pacific Specialty Insurance Analysis, Insights and Forecast, 2020-2032
- 11.1. Market Analysis, Insights and Forecast - by Type
- 11.1.1. Ocean Marine Insurance
- 11.1.2. Commercial Auto Insurance
- 11.1.3. Flood Insurance
- 11.1.4. Pet Insurance
- 11.1.5. Wedding Insurance
- 11.1.6. Jewelry Insurance
- 11.1.7. Cyber Liability Insurance
- 11.1.8. Commercial Umbrella Insurance
- 11.1.9. Others
- 11.2. Market Analysis, Insights and Forecast - by Enterprise Size
- 11.2.1. Large Enterprises
- 11.2.2. Small & Medium Enterprises (SMEs)
- 11.3. Market Analysis, Insights and Forecast - by Distribution Channel
- 11.3.1. Direct Sales
- 11.3.2. Brokers & Agents
- 11.3.3. Bancassurance
- 11.3.4. Digital Platforms
- 11.4. Market Analysis, Insights and Forecast - by End User Industry
- 11.4.1. BFSI
- 11.4.2. Healthcare & Life Sciences
- 11.4.3. Manufacturing
- 11.4.4. Energy & Utilities
- 11.4.5. Construction & Infrastructure
- 11.4.6. Transportation & Logistics
- 11.4.7. Aerospace & Defense
- 11.4.8. Marine & Shipping
- 11.4.9. Others
- 11.1. Market Analysis, Insights and Forecast - by Type
- 12. Competitive Analysis
- 12.1. Company Profiles
- 12.1.1 AIG
- 12.1.1.1. Company Overview
- 12.1.1.2. Products
- 12.1.1.3. Company Financials
- 12.1.1.4. SWOT Analysis
- 12.1.2 Chubb
- 12.1.2.1. Company Overview
- 12.1.2.2. Products
- 12.1.2.3. Company Financials
- 12.1.2.4. SWOT Analysis
- 12.1.3 Zurich Insurance Group
- 12.1.3.1. Company Overview
- 12.1.3.2. Products
- 12.1.3.3. Company Financials
- 12.1.3.4. SWOT Analysis
- 12.1.4 Allianz
- 12.1.4.1. Company Overview
- 12.1.4.2. Products
- 12.1.4.3. Company Financials
- 12.1.4.4. SWOT Analysis
- 12.1.5 AXA XL
- 12.1.5.1. Company Overview
- 12.1.5.2. Products
- 12.1.5.3. Company Financials
- 12.1.5.4. SWOT Analysis
- 12.1.6 Munich Re
- 12.1.6.1. Company Overview
- 12.1.6.2. Products
- 12.1.6.3. Company Financials
- 12.1.6.4. SWOT Analysis
- 12.1.7 Swiss Re
- 12.1.7.1. Company Overview
- 12.1.7.2. Products
- 12.1.7.3. Company Financials
- 12.1.7.4. SWOT Analysis
- 12.1.8 The Hartford
- 12.1.8.1. Company Overview
- 12.1.8.2. Products
- 12.1.8.3. Company Financials
- 12.1.8.4. SWOT Analysis
- 12.1.9 Travelers
- 12.1.9.1. Company Overview
- 12.1.9.2. Products
- 12.1.9.3. Company Financials
- 12.1.9.4. SWOT Analysis
- 12.1.10 Liberty Mutual
- 12.1.10.1. Company Overview
- 12.1.10.2. Products
- 12.1.10.3. Company Financials
- 12.1.10.4. SWOT Analysis
- 12.1.11 Tokio Marine Holdings
- 12.1.11.1. Company Overview
- 12.1.11.2. Products
- 12.1.11.3. Company Financials
- 12.1.11.4. SWOT Analysis
- 12.1.12 Lloyd's of London
- 12.1.12.1. Company Overview
- 12.1.12.2. Products
- 12.1.12.3. Company Financials
- 12.1.12.4. SWOT Analysis
- 12.1.13 Sompo Holdings
- 12.1.13.1. Company Overview
- 12.1.13.2. Products
- 12.1.13.3. Company Financials
- 12.1.13.4. SWOT Analysis
- 12.1.14 Others
- 12.1.14.1. Company Overview
- 12.1.14.2. Products
- 12.1.14.3. Company Financials
- 12.1.14.4. SWOT Analysis
- 12.1.1 AIG
- 12.2. Market Entropy
- 12.2.1 Company's Key Areas Served
- 12.2.2 Recent Developments
- 12.3. Company Market Share Analysis 2025
- 12.3.1 Top 5 Companies Market Share Analysis
- 12.3.2 Top 3 Companies Market Share Analysis
- 12.4. List of Potential Customers
- 13. Research Methodology
List of Figures
- Figure 1: Global Specialty Insurance Revenue Breakdown (billion, %) by Region 2025 & 2033
- Figure 2: North America Specialty Insurance Revenue (billion), by Type 2025 & 2033
- Figure 3: North America Specialty Insurance Revenue Share (%), by Type 2025 & 2033
- Figure 4: North America Specialty Insurance Revenue (billion), by Enterprise Size 2025 & 2033
- Figure 5: North America Specialty Insurance Revenue Share (%), by Enterprise Size 2025 & 2033
- Figure 6: North America Specialty Insurance Revenue (billion), by Distribution Channel 2025 & 2033
- Figure 7: North America Specialty Insurance Revenue Share (%), by Distribution Channel 2025 & 2033
- Figure 8: North America Specialty Insurance Revenue (billion), by End User Industry 2025 & 2033
- Figure 9: North America Specialty Insurance Revenue Share (%), by End User Industry 2025 & 2033
- Figure 10: North America Specialty Insurance Revenue (billion), by Country 2025 & 2033
- Figure 11: North America Specialty Insurance Revenue Share (%), by Country 2025 & 2033
- Figure 12: South America Specialty Insurance Revenue (billion), by Type 2025 & 2033
- Figure 13: South America Specialty Insurance Revenue Share (%), by Type 2025 & 2033
- Figure 14: South America Specialty Insurance Revenue (billion), by Enterprise Size 2025 & 2033
- Figure 15: South America Specialty Insurance Revenue Share (%), by Enterprise Size 2025 & 2033
- Figure 16: South America Specialty Insurance Revenue (billion), by Distribution Channel 2025 & 2033
- Figure 17: South America Specialty Insurance Revenue Share (%), by Distribution Channel 2025 & 2033
- Figure 18: South America Specialty Insurance Revenue (billion), by End User Industry 2025 & 2033
- Figure 19: South America Specialty Insurance Revenue Share (%), by End User Industry 2025 & 2033
- Figure 20: South America Specialty Insurance Revenue (billion), by Country 2025 & 2033
- Figure 21: South America Specialty Insurance Revenue Share (%), by Country 2025 & 2033
- Figure 22: Europe Specialty Insurance Revenue (billion), by Type 2025 & 2033
- Figure 23: Europe Specialty Insurance Revenue Share (%), by Type 2025 & 2033
- Figure 24: Europe Specialty Insurance Revenue (billion), by Enterprise Size 2025 & 2033
- Figure 25: Europe Specialty Insurance Revenue Share (%), by Enterprise Size 2025 & 2033
- Figure 26: Europe Specialty Insurance Revenue (billion), by Distribution Channel 2025 & 2033
- Figure 27: Europe Specialty Insurance Revenue Share (%), by Distribution Channel 2025 & 2033
- Figure 28: Europe Specialty Insurance Revenue (billion), by End User Industry 2025 & 2033
- Figure 29: Europe Specialty Insurance Revenue Share (%), by End User Industry 2025 & 2033
- Figure 30: Europe Specialty Insurance Revenue (billion), by Country 2025 & 2033
- Figure 31: Europe Specialty Insurance Revenue Share (%), by Country 2025 & 2033
- Figure 32: Middle East & Africa Specialty Insurance Revenue (billion), by Type 2025 & 2033
- Figure 33: Middle East & Africa Specialty Insurance Revenue Share (%), by Type 2025 & 2033
- Figure 34: Middle East & Africa Specialty Insurance Revenue (billion), by Enterprise Size 2025 & 2033
- Figure 35: Middle East & Africa Specialty Insurance Revenue Share (%), by Enterprise Size 2025 & 2033
- Figure 36: Middle East & Africa Specialty Insurance Revenue (billion), by Distribution Channel 2025 & 2033
- Figure 37: Middle East & Africa Specialty Insurance Revenue Share (%), by Distribution Channel 2025 & 2033
- Figure 38: Middle East & Africa Specialty Insurance Revenue (billion), by End User Industry 2025 & 2033
- Figure 39: Middle East & Africa Specialty Insurance Revenue Share (%), by End User Industry 2025 & 2033
- Figure 40: Middle East & Africa Specialty Insurance Revenue (billion), by Country 2025 & 2033
- Figure 41: Middle East & Africa Specialty Insurance Revenue Share (%), by Country 2025 & 2033
- Figure 42: Asia Pacific Specialty Insurance Revenue (billion), by Type 2025 & 2033
- Figure 43: Asia Pacific Specialty Insurance Revenue Share (%), by Type 2025 & 2033
- Figure 44: Asia Pacific Specialty Insurance Revenue (billion), by Enterprise Size 2025 & 2033
- Figure 45: Asia Pacific Specialty Insurance Revenue Share (%), by Enterprise Size 2025 & 2033
- Figure 46: Asia Pacific Specialty Insurance Revenue (billion), by Distribution Channel 2025 & 2033
- Figure 47: Asia Pacific Specialty Insurance Revenue Share (%), by Distribution Channel 2025 & 2033
- Figure 48: Asia Pacific Specialty Insurance Revenue (billion), by End User Industry 2025 & 2033
- Figure 49: Asia Pacific Specialty Insurance Revenue Share (%), by End User Industry 2025 & 2033
- Figure 50: Asia Pacific Specialty Insurance Revenue (billion), by Country 2025 & 2033
- Figure 51: Asia Pacific Specialty Insurance Revenue Share (%), by Country 2025 & 2033
List of Tables
- Table 1: Global Specialty Insurance Revenue billion Forecast, by Type 2020 & 2033
- Table 2: Global Specialty Insurance Revenue billion Forecast, by Enterprise Size 2020 & 2033
- Table 3: Global Specialty Insurance Revenue billion Forecast, by Distribution Channel 2020 & 2033
- Table 4: Global Specialty Insurance Revenue billion Forecast, by End User Industry 2020 & 2033
- Table 5: Global Specialty Insurance Revenue billion Forecast, by Region 2020 & 2033
- Table 6: Global Specialty Insurance Revenue billion Forecast, by Type 2020 & 2033
- Table 7: Global Specialty Insurance Revenue billion Forecast, by Enterprise Size 2020 & 2033
- Table 8: Global Specialty Insurance Revenue billion Forecast, by Distribution Channel 2020 & 2033
- Table 9: Global Specialty Insurance Revenue billion Forecast, by End User Industry 2020 & 2033
- Table 10: Global Specialty Insurance Revenue billion Forecast, by Country 2020 & 2033
- Table 11: United States Specialty Insurance Revenue (billion) Forecast, by Application 2020 & 2033
- Table 12: Canada Specialty Insurance Revenue (billion) Forecast, by Application 2020 & 2033
- Table 13: Mexico Specialty Insurance Revenue (billion) Forecast, by Application 2020 & 2033
- Table 14: Global Specialty Insurance Revenue billion Forecast, by Type 2020 & 2033
- Table 15: Global Specialty Insurance Revenue billion Forecast, by Enterprise Size 2020 & 2033
- Table 16: Global Specialty Insurance Revenue billion Forecast, by Distribution Channel 2020 & 2033
- Table 17: Global Specialty Insurance Revenue billion Forecast, by End User Industry 2020 & 2033
- Table 18: Global Specialty Insurance Revenue billion Forecast, by Country 2020 & 2033
- Table 19: Brazil Specialty Insurance Revenue (billion) Forecast, by Application 2020 & 2033
- Table 20: Argentina Specialty Insurance Revenue (billion) Forecast, by Application 2020 & 2033
- Table 21: Rest of South America Specialty Insurance Revenue (billion) Forecast, by Application 2020 & 2033
- Table 22: Global Specialty Insurance Revenue billion Forecast, by Type 2020 & 2033
- Table 23: Global Specialty Insurance Revenue billion Forecast, by Enterprise Size 2020 & 2033
- Table 24: Global Specialty Insurance Revenue billion Forecast, by Distribution Channel 2020 & 2033
- Table 25: Global Specialty Insurance Revenue billion Forecast, by End User Industry 2020 & 2033
- Table 26: Global Specialty Insurance Revenue billion Forecast, by Country 2020 & 2033
- Table 27: United Kingdom Specialty Insurance Revenue (billion) Forecast, by Application 2020 & 2033
- Table 28: Germany Specialty Insurance Revenue (billion) Forecast, by Application 2020 & 2033
- Table 29: France Specialty Insurance Revenue (billion) Forecast, by Application 2020 & 2033
- Table 30: Italy Specialty Insurance Revenue (billion) Forecast, by Application 2020 & 2033
- Table 31: Spain Specialty Insurance Revenue (billion) Forecast, by Application 2020 & 2033
- Table 32: Russia Specialty Insurance Revenue (billion) Forecast, by Application 2020 & 2033
- Table 33: Benelux Specialty Insurance Revenue (billion) Forecast, by Application 2020 & 2033
- Table 34: Nordics Specialty Insurance Revenue (billion) Forecast, by Application 2020 & 2033
- Table 35: Rest of Europe Specialty Insurance Revenue (billion) Forecast, by Application 2020 & 2033
- Table 36: Global Specialty Insurance Revenue billion Forecast, by Type 2020 & 2033
- Table 37: Global Specialty Insurance Revenue billion Forecast, by Enterprise Size 2020 & 2033
- Table 38: Global Specialty Insurance Revenue billion Forecast, by Distribution Channel 2020 & 2033
- Table 39: Global Specialty Insurance Revenue billion Forecast, by End User Industry 2020 & 2033
- Table 40: Global Specialty Insurance Revenue billion Forecast, by Country 2020 & 2033
- Table 41: Turkey Specialty Insurance Revenue (billion) Forecast, by Application 2020 & 2033
- Table 42: Israel Specialty Insurance Revenue (billion) Forecast, by Application 2020 & 2033
- Table 43: GCC Specialty Insurance Revenue (billion) Forecast, by Application 2020 & 2033
- Table 44: North Africa Specialty Insurance Revenue (billion) Forecast, by Application 2020 & 2033
- Table 45: South Africa Specialty Insurance Revenue (billion) Forecast, by Application 2020 & 2033
- Table 46: Rest of Middle East & Africa Specialty Insurance Revenue (billion) Forecast, by Application 2020 & 2033
- Table 47: Global Specialty Insurance Revenue billion Forecast, by Type 2020 & 2033
- Table 48: Global Specialty Insurance Revenue billion Forecast, by Enterprise Size 2020 & 2033
- Table 49: Global Specialty Insurance Revenue billion Forecast, by Distribution Channel 2020 & 2033
- Table 50: Global Specialty Insurance Revenue billion Forecast, by End User Industry 2020 & 2033
- Table 51: Global Specialty Insurance Revenue billion Forecast, by Country 2020 & 2033
- Table 52: China Specialty Insurance Revenue (billion) Forecast, by Application 2020 & 2033
- Table 53: India Specialty Insurance Revenue (billion) Forecast, by Application 2020 & 2033
- Table 54: Japan Specialty Insurance Revenue (billion) Forecast, by Application 2020 & 2033
- Table 55: South Korea Specialty Insurance Revenue (billion) Forecast, by Application 2020 & 2033
- Table 56: ASEAN Specialty Insurance Revenue (billion) Forecast, by Application 2020 & 2033
- Table 57: Oceania Specialty Insurance Revenue (billion) Forecast, by Application 2020 & 2033
- Table 58: Rest of Asia Pacific Specialty Insurance Revenue (billion) Forecast, by Application 2020 & 2033
Frequently Asked Questions
1. What is the projected Compound Annual Growth Rate (CAGR) of the Specialty Insurance?
The projected CAGR is approximately 7%.
2. Which companies are prominent players in the Specialty Insurance?
Key companies in the market include AIG, Chubb, Zurich Insurance Group, Allianz, AXA XL, Munich Re, Swiss Re, The Hartford, Travelers, Liberty Mutual, Tokio Marine Holdings, Lloyd's of London, Sompo Holdings, Others.
3. What are the main segments of the Specialty Insurance?
The market segments include Type, Enterprise Size, Distribution Channel, End User Industry.
4. Can you provide details about the market size?
The market size is estimated to be USD 100.4 billion as of 2022.
5. What are some drivers contributing to market growth?
N/A
6. What are the notable trends driving market growth?
N/A
7. Are there any restraints impacting market growth?
N/A
8. Can you provide examples of recent developments in the market?
N/A
9. What pricing options are available for accessing the report?
Pricing options include single-user, multi-user, and enterprise licenses priced at USD 4250.00, USD 6375.00, and USD 8500.00 respectively.
10. Is the market size provided in terms of value or volume?
The market size is provided in terms of value, measured in billion.
11. Are there any specific market keywords associated with the report?
Yes, the market keyword associated with the report is "Specialty Insurance," which aids in identifying and referencing the specific market segment covered.
12. How do I determine which pricing option suits my needs best?
The pricing options vary based on user requirements and access needs. Individual users may opt for single-user licenses, while businesses requiring broader access may choose multi-user or enterprise licenses for cost-effective access to the report.
13. Are there any additional resources or data provided in the Specialty Insurance report?
While the report offers comprehensive insights, it's advisable to review the specific contents or supplementary materials provided to ascertain if additional resources or data are available.
14. How can I stay updated on further developments or reports in the Specialty Insurance?
To stay informed about further developments, trends, and reports in the Specialty Insurance, consider subscribing to industry newsletters, following relevant companies and organizations, or regularly checking reputable industry news sources and publications.
Methodology
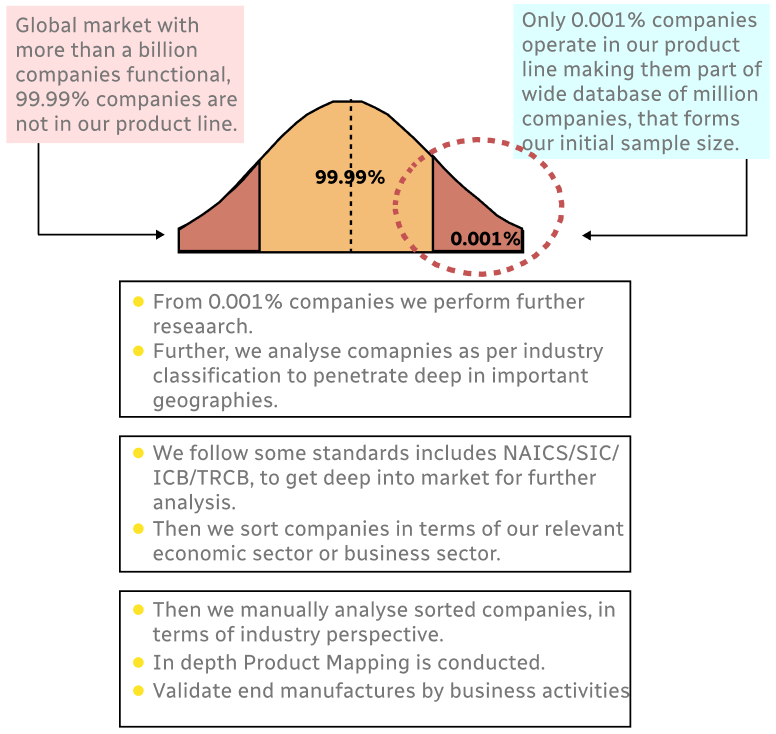
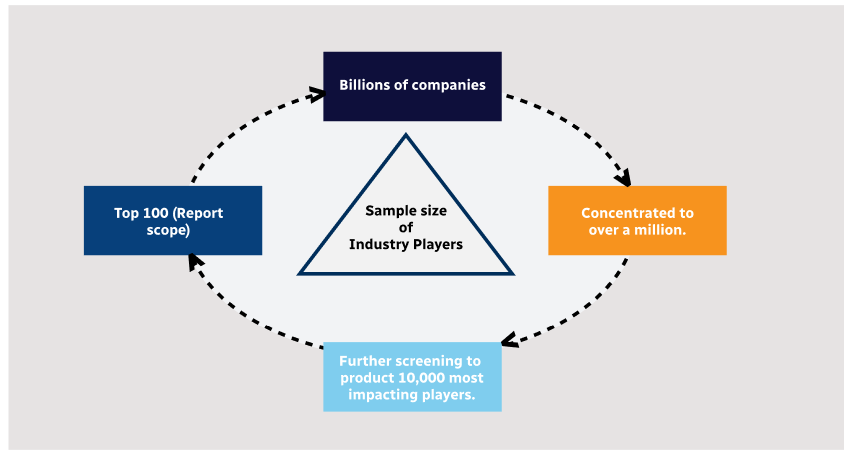
Step 1 - Identification of Relevant Samples Size from Population Database
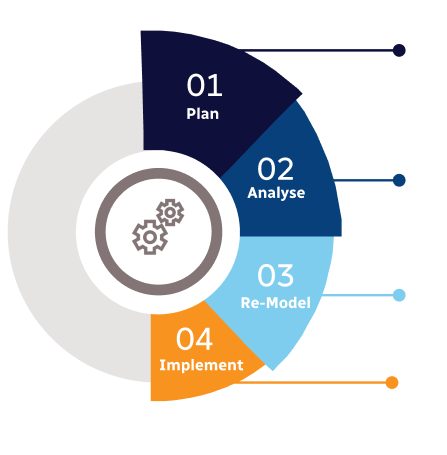
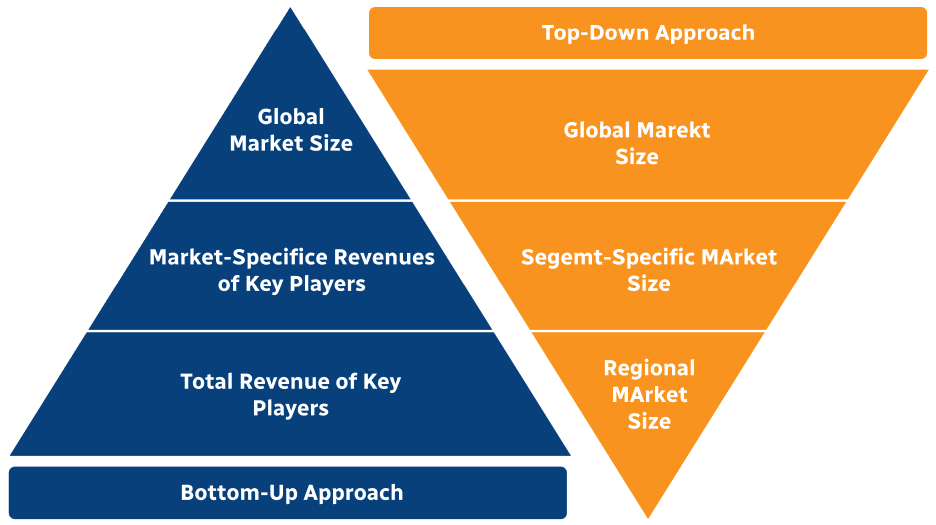
Step 2 - Approaches for Defining Global Market Size (Value, Volume* & Price*)
Note*: In applicable scenarios
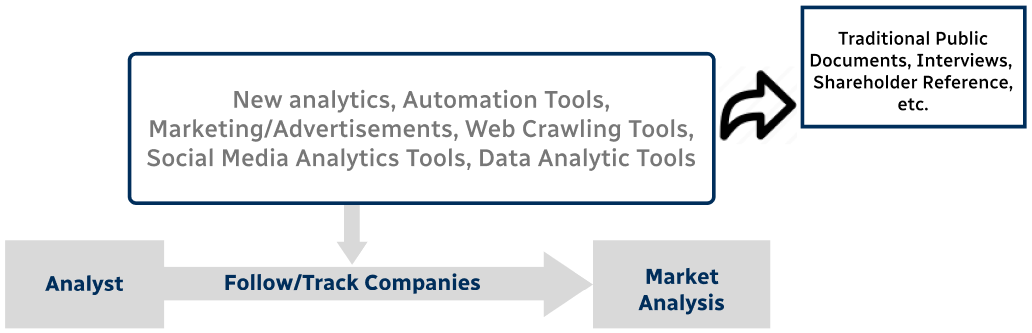
Step 3 - Data Sources
Primary Research
- Web Analytics
- Survey Reports
- Research Institute
- Latest Research Reports
- Opinion Leaders
Secondary Research
- Annual Reports
- White Paper
- Latest Press Release
- Industry Association
- Paid Database
- Investor Presentations
Step 4 - Data Triangulation
Involves using different sources of information in order to increase the validity of a study
These sources are likely to be stakeholders in a program - participants, other researchers, program staff, other community members, and so on.
Then we put all data in single framework & apply various statistical tools to find out the dynamic on the market.
During the analysis stage, feedback from the stakeholder groups would be compared to determine areas of agreement as well as areas of divergence