

Key Insights
The global Spent Fuel and Nuclear Waste Management market is set for significant expansion, fueled by rising global energy demands met by nuclear power and strict regulations for the secure handling of nuclear byproducts. With an estimated market size of $6.28 billion in the base year 2025, the industry is projected to grow at a Compound Annual Growth Rate (CAGR) of 0.9% over the forecast period. This growth is supported by substantial investments in advanced reprocessing technologies, deep geological repository development, and ongoing research into long-term storage solutions. The increasing number of operational nuclear power plants and the decommissioning of older facilities necessitate sophisticated waste management. Heightened awareness and global commitment to nuclear non-proliferation and environmental protection are driving increased resource allocation towards comprehensive waste management strategies.
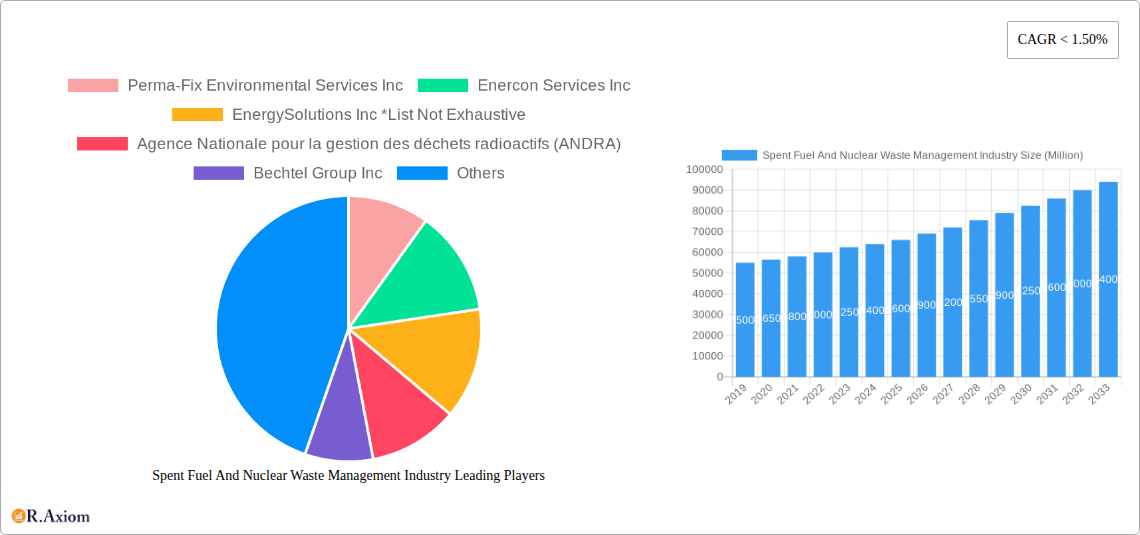
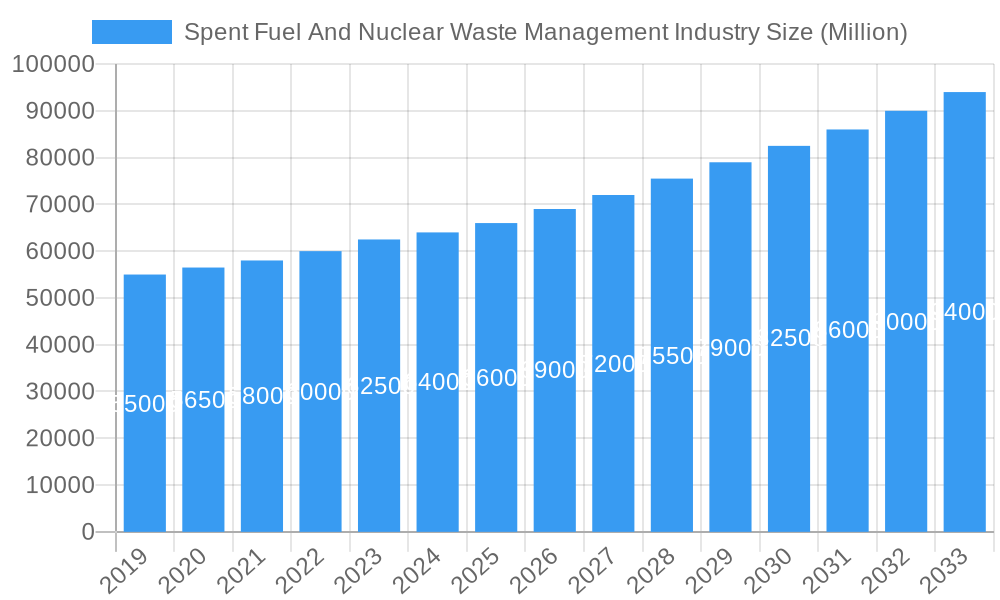
Spent Fuel And Nuclear Waste Management Industry Market Size (In Billion)
Market growth is further propelled by evolving international regulations and best practices emphasizing the lifecycle management of nuclear materials. Nations are adopting a cradle-to-grave approach, requiring continuous investment in infrastructure, technology, and skilled personnel. Demand for characterization, treatment, transportation, and storage services for spent nuclear fuel and radioactive waste is rising steadily. Regions with established nuclear power programs, such as North America and Europe, are leading current expenditure and future investment. Emerging economies with developing nuclear energy sectors are also expected to contribute significantly as they build waste management capabilities. The inherent complexities and long-term nature of nuclear waste management, coupled with the critical need for public safety and environmental stewardship, ensure sustained demand for specialized services and technologies.
Spent Fuel And Nuclear Waste Management Industry Company Market Share
This report provides a critical analysis of the global Spent Fuel and Nuclear Waste Management industry. The market size was estimated at $6.28 billion in the base year 2025, and is projected for robust growth. This analysis covers market concentration, innovation, regulatory frameworks, emerging trends, dominant segments, product developments, key drivers, challenges, opportunities, leading players, and strategic outlooks, offering actionable insights for stakeholders in this evolving sector.
Spent Fuel And Nuclear Waste Management Industry Market Concentration & Innovation
The Spent Fuel and Nuclear Waste Management industry exhibits a moderate level of market concentration, with a few large global players dominating the landscape alongside a significant number of regional specialists. Innovation is a key differentiator, driven by the perpetual need for safer, more efficient, and cost-effective solutions for handling radioactive materials. Regulatory frameworks, such as those from the International Atomic Energy Agency (IAEA) and national bodies like the US Nuclear Regulatory Commission (NRC), are paramount, dictating stringent safety protocols and disposal standards, which in turn spur innovation. Product substitutes are limited due to the specialized nature of nuclear waste management, but advancements in interim storage and reprocessing technologies aim to optimize current solutions. End-user trends indicate a growing preference for integrated service providers offering end-to-end management solutions. Mergers and acquisitions (M&A) activities are strategic moves aimed at consolidating expertise, expanding service portfolios, and achieving economies of scale. For instance, significant M&A deals in the past have seen valuations in the XX million range, reflecting the strategic importance of acquiring specialized capabilities. Market share is influenced by a company's technological prowess, regulatory compliance history, and established relationships with nuclear power operators and government agencies.
Spent Fuel And Nuclear Waste Management Industry Industry Trends & Insights
The global Spent Fuel and Nuclear Waste Management industry is experiencing robust growth, projected to achieve a Compound Annual Growth Rate (CAGR) of XX% from 2025 to 2033, reaching an estimated market size of XX million by the end of the forecast period. This upward trajectory is primarily fueled by the expanding global nuclear power installed capacity and the increasing volume of spent fuel and radioactive waste generated. Technological advancements play a pivotal role, with ongoing research and development focused on advanced recycling techniques, improved waste immobilization methods, and the development of permanent geological repositories. For instance, innovations in dry cask storage technology have significantly enhanced the safety and efficiency of spent fuel management. Consumer preferences, or rather end-user demands, are shifting towards comprehensive lifecycle management services, encompassing everything from on-site storage to final disposal. Competitive dynamics are characterized by a blend of large, established engineering and environmental services firms, alongside specialized waste management companies. The increasing emphasis on sustainable energy sources, including nuclear power, necessitates the development of sophisticated and reliable nuclear waste management solutions, ensuring long-term safety and environmental protection. Market penetration for advanced disposal technologies is gradually increasing as regulatory pressures mount and public acceptance of nuclear energy evolves. The industry is also witnessing a trend towards modular and scalable solutions to cater to diverse operational needs and geographical requirements. The rising global energy demand, coupled with the need for low-carbon energy sources, underpins the sustained relevance and growth of the nuclear power sector, consequently driving the demand for associated waste management services.
Dominant Markets & Segments in Spent Fuel And Nuclear Waste Management Industry
The global Spent Fuel and Nuclear Waste Management market is segmented by waste type and source, with significant regional variations in dominance.
By Type:
- High-level Waste (HLW): This segment, primarily comprising spent nuclear fuel and waste from reprocessing, is the most challenging and expensive to manage. Its dominance is driven by the long-term safety requirements and the scarcity of operational geological repositories. Countries with active nuclear power programs, such as the United States, France, and Russia, represent the largest markets for HLW management. Economic policies supporting nuclear energy expansion and long-term energy security directly influence the growth of this segment.
- Intermediate-level Waste (ILW): This category includes reactor components and resins. Its management requires robust containment and disposal solutions. The increasing decommissioning of older nuclear facilities contributes to the growing volume of ILW. Infrastructure development for specialized ILW disposal facilities is a key driver in dominant regions.
- Low-level Waste (LLW): This segment, consisting of contaminated protective clothing, tools, and building materials, is the most voluminous but least radioactive. Its management is relatively less complex, with numerous disposal facilities globally. The sustained operation of nuclear power plants and research facilities ensures a steady demand for LLW management services. Stringent regulations for LLW disposal contribute to market stability.
By Source:
- Nuclear Fuel Cycle (Nuclear Power Reactors, Radioact): This is the largest and most influential segment, directly correlated with the operational status and expansion plans of nuclear power plants worldwide. The continued reliance on nuclear energy for electricity generation globally is the primary engine for this segment's dominance. Government policies supporting nuclear energy infrastructure and decommissioning programs are crucial growth catalysts.
- Research, Medical, and Industrial Source: While smaller in volume compared to the nuclear fuel cycle, this segment is critical for specialized waste management. The growing applications of radioisotopes in medicine and industry, alongside research activities, contribute to its consistent demand. Investment in advanced research facilities and medical technology increases the generation of these waste streams.
- Military and Defense Programs: Historically, military nuclear programs have generated significant volumes of radioactive waste. While often managed under government oversight, the ongoing decommissioning of military facilities and the management of legacy waste are substantial market components. National security policies and defense spending directly impact this segment.
- Other Sources: This residual category encompasses various minor sources of radioactive materials.
The dominance of specific regions is often tied to their nuclear energy portfolios, regulatory maturity, and investment in waste management infrastructure. North America and Europe currently lead in terms of market size due to established nuclear industries and advanced waste management practices.
Spent Fuel And Nuclear Waste Management Industry Product Developments
Product developments in the Spent Fuel and Nuclear Waste Management industry are intensely focused on enhancing safety, efficiency, and environmental sustainability. Innovations include advanced dry storage systems for spent nuclear fuel, which offer improved safety margins and reduced operational complexity compared to wet storage. Development of novel immobilization matrices, such as advanced ceramics and glasses, aims to create more durable and leach-resistant waste forms, particularly for high-level waste. Furthermore, research into advanced reprocessing technologies, like pyroprocessing, seeks to extract usable isotopes and reduce the volume and radiotoxicity of waste. Mobile treatment and processing units are also emerging, allowing for on-site management of certain waste streams, thereby reducing transportation risks and costs. These technological advancements provide competitive advantages by enabling companies to offer more effective, compliant, and cost-efficient solutions to their clients.
Report Scope & Segmentation Analysis
This report provides a comprehensive analysis of the Spent Fuel and Nuclear Waste Management market, segmented by waste type and source.
- Low-level Waste (LLW): This segment focuses on the management and disposal of the most voluminous but least radioactive waste streams. Projections indicate steady growth driven by the ongoing operations of nuclear power plants and research institutions, with an estimated market size of XX million in 2025, projected to reach XX million by 2033.
- Intermediate-level Waste (ILW): This segment encompasses waste with higher radioactivity than LLW, including reactor components. The increasing number of nuclear plant decommissioning projects will drive growth, with an estimated market of XX million in 2025, forecast to reach XX million by 2033.
- High-level Waste (HLW): This segment, primarily spent nuclear fuel and reprocessed waste, demands the most sophisticated and secure management solutions. Its market size is estimated at XX million in 2025 and is projected to grow significantly to XX million by 2033, driven by the long-term storage and disposal needs.
- Nuclear Fuel Cycle (Nuclear Power Reactors, Radioact): This segment, deriving from nuclear power generation, is the largest revenue generator. Its growth is directly tied to the operational lifespan and expansion of nuclear fleets, with projections of XX million in 2025, reaching XX million by 2033.
- Research, Medical, and Industrial Source: This segment represents diverse applications of radioactive materials. Growth is driven by advancements in medical imaging, cancer treatment, and industrial processes, estimated at XX million in 2025, reaching XX million by 2033.
- Military and Defense Programs: This segment involves the management of waste from historical and ongoing defense activities. Its market size is estimated at XX million in 2025, with projected growth to XX million by 2033.
- Other Sources: This includes miscellaneous radioactive waste. Its market is estimated at XX million in 2025, reaching XX million by 2033.
Key Drivers of Spent Fuel And Nuclear Waste Management Industry Growth
Several factors are propelling the growth of the Spent Fuel and Nuclear Waste Management industry. Firstly, the continued global reliance on nuclear energy for low-carbon electricity generation directly translates to an increasing volume of spent fuel and radioactive waste requiring management. Secondly, stringent and evolving regulatory frameworks worldwide mandate safe, secure, and environmentally sound disposal practices, compelling investment in advanced technologies and services. Thirdly, technological advancements in waste treatment, immobilization, and long-term storage solutions are making management more efficient and cost-effective. Finally, the increasing number of nuclear power plant decommissioning projects globally is creating substantial demand for comprehensive waste management services.
Challenges in the Spent Fuel And Nuclear Waste Management Industry Sector
Despite its growth potential, the Spent Fuel and Nuclear Waste Management industry faces significant challenges. Public perception and political opposition to nuclear power and waste disposal facilities can lead to delays and increased project costs. The long-term nature of HLW management, requiring secure geological repositories, presents immense technical and financial hurdles, with many countries still seeking viable long-term solutions. High capital investment is required for specialized facilities and technologies, creating a barrier to entry for smaller companies. Supply chain complexities and the need for highly specialized personnel also pose challenges. Furthermore, ensuring the security of radioactive materials against theft or misuse is a constant concern requiring robust security protocols.
Emerging Opportunities in Spent Fuel And Nuclear Waste Management Industry
The Spent Fuel and Nuclear Waste Management industry is ripe with emerging opportunities. The development and operationalization of permanent geological repositories for HLW represent a significant long-term opportunity for specialized engineering and construction firms. Advancements in nuclear fuel recycling and advanced reactor technologies, such as Small Modular Reactors (SMRs), will create new waste streams and management requirements, opening avenues for innovative solutions. The growing demand for decommissioning services for aging nuclear facilities worldwide presents a substantial market. Furthermore, the application of digital technologies, including AI and advanced modeling, for optimizing waste inventory management, risk assessment, and operational efficiency offers significant potential. Exploring new markets in emerging economies with growing nuclear programs also presents a promising avenue for growth.
Leading Players in the Spent Fuel And Nuclear Waste Management Industry Market
- Perma-Fix Environmental Services Inc
- Enercon Services Inc
- EnergySolutions Inc
- Agence Nationale pour la gestion des déchets radioactifs (ANDRA)
- Bechtel Group Inc
- Fluor Corporation
- Westinghouse Electric Company LLC (Toshiba)
- Veolia Environment SA
- Augean PLC
- Studsvik AB
Key Developments in Spent Fuel And Nuclear Waste Management Industry Industry
- August 2020: The US Department of Energy announced the authorization of radioactive operations at the Salt Waste Processing Facility (SWPF) at its Savannah River Site (SRS). This first-of-a-kind facility is designed to process approximately 31 million gallons of radioactive salt waste.
- August 2021: German utility companies PreussenElektra, RWE, ENBW, and Vattenfall signed contracts exceeding EUR 1 billion with Orano for the return of all German nuclear waste stored at the Orano la Hague plant.
Strategic Outlook for Spent Fuel And Nuclear Waste Management Industry Market
The strategic outlook for the Spent Fuel and Nuclear Waste Management industry is one of sustained growth and increasing technological sophistication. The fundamental need for safe and secure handling of nuclear waste, coupled with the continued role of nuclear energy in the global energy mix, ensures a robust market. Key growth catalysts will include the successful implementation of advanced waste treatment and disposal technologies, the ongoing decommissioning of nuclear power plants, and the development of solutions for emerging waste streams from new reactor designs. Companies that can offer integrated, end-to-end management services, demonstrate strong regulatory compliance, and invest in innovation will be best positioned to capitalize on future opportunities and maintain a competitive edge in this critical industry. The industry's evolution will be marked by a stronger emphasis on circular economy principles within the nuclear fuel cycle and the development of more sustainable and cost-effective waste management strategies.
Spent Fuel And Nuclear Waste Management Industry Segmentation
-
1. Type
- 1.1. Low-level Waste
- 1.2. Intermediate-level Waste
- 1.3. High-level Waste
-
2. Source
-
2.1. Nuclear Fuel Cycle
- 2.1.1. Nuclear Power Reactors
- 2.1.2. Radioact
- 2.2. Research, Medical, and Industrial Source
- 2.3. Military and Defense Programs
- 2.4. Other Sources
-
2.1. Nuclear Fuel Cycle
Spent Fuel And Nuclear Waste Management Industry Segmentation By Geography
- 1. North America
- 2. Europe
- 3. Asia Pacific
- 4. South America
- 5. Middle East
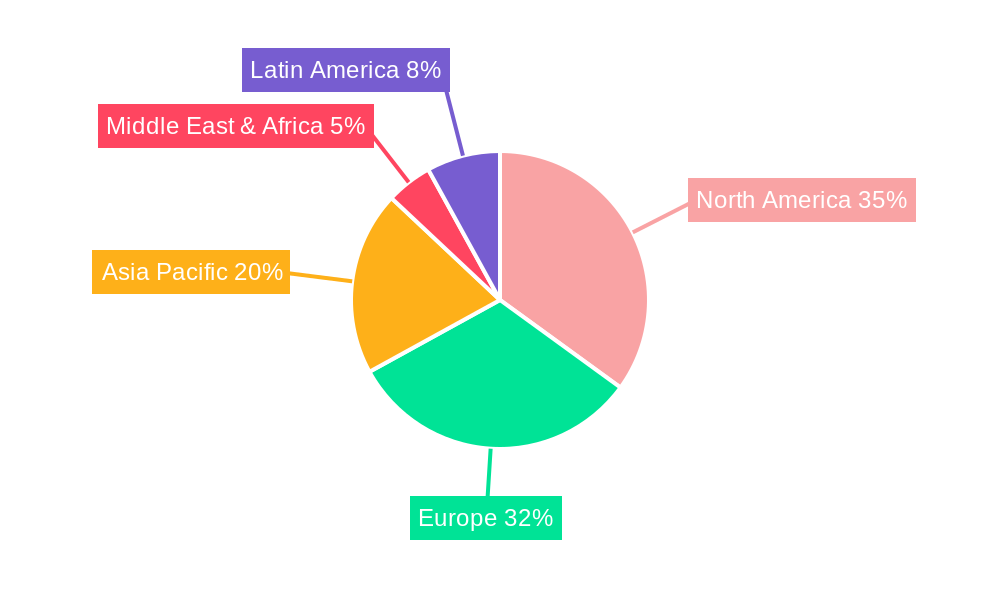
Spent Fuel And Nuclear Waste Management Industry Regional Market Share
Geographic Coverage of Spent Fuel And Nuclear Waste Management Industry
Spent Fuel And Nuclear Waste Management Industry REPORT HIGHLIGHTS
| Aspects | Details |
|---|---|
| Study Period | 2020-2034 |
| Base Year | 2025 |
| Estimated Year | 2026 |
| Forecast Period | 2026-2034 |
| Historical Period | 2020-2025 |
| Growth Rate | CAGR of 0.9% from 2020-2034 |
| Segmentation |
|
Table of Contents
- 1. Introduction
- 1.1. Research Scope
- 1.2. Market Segmentation
- 1.3. Research Methodology
- 1.4. Definitions and Assumptions
- 2. Executive Summary
- 2.1. Introduction
- 3. Market Dynamics
- 3.1. Introduction
- 3.2. Market Drivers
- 3.2.1. 4.; Increasing Infrastructure Development4.; Rising Emphasis Water and Wastewater Management
- 3.3. Market Restrains
- 3.3.1. 4.; Volatility in Raw Material Prices
- 3.4. Market Trends
- 3.4.1. Low-level Waste Expected to Dominate the Market
- 4. Market Factor Analysis
- 4.1. Porters Five Forces
- 4.2. Supply/Value Chain
- 4.3. PESTEL analysis
- 4.4. Market Entropy
- 4.5. Patent/Trademark Analysis
- 5. Global Spent Fuel And Nuclear Waste Management Industry Analysis, Insights and Forecast, 2020-2032
- 5.1. Market Analysis, Insights and Forecast - by Type
- 5.1.1. Low-level Waste
- 5.1.2. Intermediate-level Waste
- 5.1.3. High-level Waste
- 5.2. Market Analysis, Insights and Forecast - by Source
- 5.2.1. Nuclear Fuel Cycle
- 5.2.1.1. Nuclear Power Reactors
- 5.2.1.2. Radioact
- 5.2.2. Research, Medical, and Industrial Source
- 5.2.3. Military and Defense Programs
- 5.2.4. Other Sources
- 5.2.1. Nuclear Fuel Cycle
- 5.3. Market Analysis, Insights and Forecast - by Region
- 5.3.1. North America
- 5.3.2. Europe
- 5.3.3. Asia Pacific
- 5.3.4. South America
- 5.3.5. Middle East
- 5.1. Market Analysis, Insights and Forecast - by Type
- 6. North America Spent Fuel And Nuclear Waste Management Industry Analysis, Insights and Forecast, 2020-2032
- 6.1. Market Analysis, Insights and Forecast - by Type
- 6.1.1. Low-level Waste
- 6.1.2. Intermediate-level Waste
- 6.1.3. High-level Waste
- 6.2. Market Analysis, Insights and Forecast - by Source
- 6.2.1. Nuclear Fuel Cycle
- 6.2.1.1. Nuclear Power Reactors
- 6.2.1.2. Radioact
- 6.2.2. Research, Medical, and Industrial Source
- 6.2.3. Military and Defense Programs
- 6.2.4. Other Sources
- 6.2.1. Nuclear Fuel Cycle
- 6.1. Market Analysis, Insights and Forecast - by Type
- 7. Europe Spent Fuel And Nuclear Waste Management Industry Analysis, Insights and Forecast, 2020-2032
- 7.1. Market Analysis, Insights and Forecast - by Type
- 7.1.1. Low-level Waste
- 7.1.2. Intermediate-level Waste
- 7.1.3. High-level Waste
- 7.2. Market Analysis, Insights and Forecast - by Source
- 7.2.1. Nuclear Fuel Cycle
- 7.2.1.1. Nuclear Power Reactors
- 7.2.1.2. Radioact
- 7.2.2. Research, Medical, and Industrial Source
- 7.2.3. Military and Defense Programs
- 7.2.4. Other Sources
- 7.2.1. Nuclear Fuel Cycle
- 7.1. Market Analysis, Insights and Forecast - by Type
- 8. Asia Pacific Spent Fuel And Nuclear Waste Management Industry Analysis, Insights and Forecast, 2020-2032
- 8.1. Market Analysis, Insights and Forecast - by Type
- 8.1.1. Low-level Waste
- 8.1.2. Intermediate-level Waste
- 8.1.3. High-level Waste
- 8.2. Market Analysis, Insights and Forecast - by Source
- 8.2.1. Nuclear Fuel Cycle
- 8.2.1.1. Nuclear Power Reactors
- 8.2.1.2. Radioact
- 8.2.2. Research, Medical, and Industrial Source
- 8.2.3. Military and Defense Programs
- 8.2.4. Other Sources
- 8.2.1. Nuclear Fuel Cycle
- 8.1. Market Analysis, Insights and Forecast - by Type
- 9. South America Spent Fuel And Nuclear Waste Management Industry Analysis, Insights and Forecast, 2020-2032
- 9.1. Market Analysis, Insights and Forecast - by Type
- 9.1.1. Low-level Waste
- 9.1.2. Intermediate-level Waste
- 9.1.3. High-level Waste
- 9.2. Market Analysis, Insights and Forecast - by Source
- 9.2.1. Nuclear Fuel Cycle
- 9.2.1.1. Nuclear Power Reactors
- 9.2.1.2. Radioact
- 9.2.2. Research, Medical, and Industrial Source
- 9.2.3. Military and Defense Programs
- 9.2.4. Other Sources
- 9.2.1. Nuclear Fuel Cycle
- 9.1. Market Analysis, Insights and Forecast - by Type
- 10. Middle East Spent Fuel And Nuclear Waste Management Industry Analysis, Insights and Forecast, 2020-2032
- 10.1. Market Analysis, Insights and Forecast - by Type
- 10.1.1. Low-level Waste
- 10.1.2. Intermediate-level Waste
- 10.1.3. High-level Waste
- 10.2. Market Analysis, Insights and Forecast - by Source
- 10.2.1. Nuclear Fuel Cycle
- 10.2.1.1. Nuclear Power Reactors
- 10.2.1.2. Radioact
- 10.2.2. Research, Medical, and Industrial Source
- 10.2.3. Military and Defense Programs
- 10.2.4. Other Sources
- 10.2.1. Nuclear Fuel Cycle
- 10.1. Market Analysis, Insights and Forecast - by Type
- 11. Competitive Analysis
- 11.1. Global Market Share Analysis 2025
- 11.2. Company Profiles
- 11.2.1 Perma-Fix Environmental Services Inc
- 11.2.1.1. Overview
- 11.2.1.2. Products
- 11.2.1.3. SWOT Analysis
- 11.2.1.4. Recent Developments
- 11.2.1.5. Financials (Based on Availability)
- 11.2.2 Enercon Services Inc
- 11.2.2.1. Overview
- 11.2.2.2. Products
- 11.2.2.3. SWOT Analysis
- 11.2.2.4. Recent Developments
- 11.2.2.5. Financials (Based on Availability)
- 11.2.3 EnergySolutions Inc *List Not Exhaustive
- 11.2.3.1. Overview
- 11.2.3.2. Products
- 11.2.3.3. SWOT Analysis
- 11.2.3.4. Recent Developments
- 11.2.3.5. Financials (Based on Availability)
- 11.2.4 Agence Nationale pour la gestion des déchets radioactifs (ANDRA)
- 11.2.4.1. Overview
- 11.2.4.2. Products
- 11.2.4.3. SWOT Analysis
- 11.2.4.4. Recent Developments
- 11.2.4.5. Financials (Based on Availability)
- 11.2.5 Bechtel Group Inc
- 11.2.5.1. Overview
- 11.2.5.2. Products
- 11.2.5.3. SWOT Analysis
- 11.2.5.4. Recent Developments
- 11.2.5.5. Financials (Based on Availability)
- 11.2.6 Fluor Corporation
- 11.2.6.1. Overview
- 11.2.6.2. Products
- 11.2.6.3. SWOT Analysis
- 11.2.6.4. Recent Developments
- 11.2.6.5. Financials (Based on Availability)
- 11.2.7 Westinghouse Electric Company LLC (Toshiba)
- 11.2.7.1. Overview
- 11.2.7.2. Products
- 11.2.7.3. SWOT Analysis
- 11.2.7.4. Recent Developments
- 11.2.7.5. Financials (Based on Availability)
- 11.2.8 Veolia Environment SA
- 11.2.8.1. Overview
- 11.2.8.2. Products
- 11.2.8.3. SWOT Analysis
- 11.2.8.4. Recent Developments
- 11.2.8.5. Financials (Based on Availability)
- 11.2.9 Augean PLC
- 11.2.9.1. Overview
- 11.2.9.2. Products
- 11.2.9.3. SWOT Analysis
- 11.2.9.4. Recent Developments
- 11.2.9.5. Financials (Based on Availability)
- 11.2.10 Studsvik AB
- 11.2.10.1. Overview
- 11.2.10.2. Products
- 11.2.10.3. SWOT Analysis
- 11.2.10.4. Recent Developments
- 11.2.10.5. Financials (Based on Availability)
- 11.2.1 Perma-Fix Environmental Services Inc
List of Figures
- Figure 1: Global Spent Fuel And Nuclear Waste Management Industry Revenue Breakdown (billion, %) by Region 2025 & 2033
- Figure 2: North America Spent Fuel And Nuclear Waste Management Industry Revenue (billion), by Type 2025 & 2033
- Figure 3: North America Spent Fuel And Nuclear Waste Management Industry Revenue Share (%), by Type 2025 & 2033
- Figure 4: North America Spent Fuel And Nuclear Waste Management Industry Revenue (billion), by Source 2025 & 2033
- Figure 5: North America Spent Fuel And Nuclear Waste Management Industry Revenue Share (%), by Source 2025 & 2033
- Figure 6: North America Spent Fuel And Nuclear Waste Management Industry Revenue (billion), by Country 2025 & 2033
- Figure 7: North America Spent Fuel And Nuclear Waste Management Industry Revenue Share (%), by Country 2025 & 2033
- Figure 8: Europe Spent Fuel And Nuclear Waste Management Industry Revenue (billion), by Type 2025 & 2033
- Figure 9: Europe Spent Fuel And Nuclear Waste Management Industry Revenue Share (%), by Type 2025 & 2033
- Figure 10: Europe Spent Fuel And Nuclear Waste Management Industry Revenue (billion), by Source 2025 & 2033
- Figure 11: Europe Spent Fuel And Nuclear Waste Management Industry Revenue Share (%), by Source 2025 & 2033
- Figure 12: Europe Spent Fuel And Nuclear Waste Management Industry Revenue (billion), by Country 2025 & 2033
- Figure 13: Europe Spent Fuel And Nuclear Waste Management Industry Revenue Share (%), by Country 2025 & 2033
- Figure 14: Asia Pacific Spent Fuel And Nuclear Waste Management Industry Revenue (billion), by Type 2025 & 2033
- Figure 15: Asia Pacific Spent Fuel And Nuclear Waste Management Industry Revenue Share (%), by Type 2025 & 2033
- Figure 16: Asia Pacific Spent Fuel And Nuclear Waste Management Industry Revenue (billion), by Source 2025 & 2033
- Figure 17: Asia Pacific Spent Fuel And Nuclear Waste Management Industry Revenue Share (%), by Source 2025 & 2033
- Figure 18: Asia Pacific Spent Fuel And Nuclear Waste Management Industry Revenue (billion), by Country 2025 & 2033
- Figure 19: Asia Pacific Spent Fuel And Nuclear Waste Management Industry Revenue Share (%), by Country 2025 & 2033
- Figure 20: South America Spent Fuel And Nuclear Waste Management Industry Revenue (billion), by Type 2025 & 2033
- Figure 21: South America Spent Fuel And Nuclear Waste Management Industry Revenue Share (%), by Type 2025 & 2033
- Figure 22: South America Spent Fuel And Nuclear Waste Management Industry Revenue (billion), by Source 2025 & 2033
- Figure 23: South America Spent Fuel And Nuclear Waste Management Industry Revenue Share (%), by Source 2025 & 2033
- Figure 24: South America Spent Fuel And Nuclear Waste Management Industry Revenue (billion), by Country 2025 & 2033
- Figure 25: South America Spent Fuel And Nuclear Waste Management Industry Revenue Share (%), by Country 2025 & 2033
- Figure 26: Middle East Spent Fuel And Nuclear Waste Management Industry Revenue (billion), by Type 2025 & 2033
- Figure 27: Middle East Spent Fuel And Nuclear Waste Management Industry Revenue Share (%), by Type 2025 & 2033
- Figure 28: Middle East Spent Fuel And Nuclear Waste Management Industry Revenue (billion), by Source 2025 & 2033
- Figure 29: Middle East Spent Fuel And Nuclear Waste Management Industry Revenue Share (%), by Source 2025 & 2033
- Figure 30: Middle East Spent Fuel And Nuclear Waste Management Industry Revenue (billion), by Country 2025 & 2033
- Figure 31: Middle East Spent Fuel And Nuclear Waste Management Industry Revenue Share (%), by Country 2025 & 2033
List of Tables
- Table 1: Global Spent Fuel And Nuclear Waste Management Industry Revenue billion Forecast, by Type 2020 & 2033
- Table 2: Global Spent Fuel And Nuclear Waste Management Industry Revenue billion Forecast, by Source 2020 & 2033
- Table 3: Global Spent Fuel And Nuclear Waste Management Industry Revenue billion Forecast, by Region 2020 & 2033
- Table 4: Global Spent Fuel And Nuclear Waste Management Industry Revenue billion Forecast, by Type 2020 & 2033
- Table 5: Global Spent Fuel And Nuclear Waste Management Industry Revenue billion Forecast, by Source 2020 & 2033
- Table 6: Global Spent Fuel And Nuclear Waste Management Industry Revenue billion Forecast, by Country 2020 & 2033
- Table 7: Global Spent Fuel And Nuclear Waste Management Industry Revenue billion Forecast, by Type 2020 & 2033
- Table 8: Global Spent Fuel And Nuclear Waste Management Industry Revenue billion Forecast, by Source 2020 & 2033
- Table 9: Global Spent Fuel And Nuclear Waste Management Industry Revenue billion Forecast, by Country 2020 & 2033
- Table 10: Global Spent Fuel And Nuclear Waste Management Industry Revenue billion Forecast, by Type 2020 & 2033
- Table 11: Global Spent Fuel And Nuclear Waste Management Industry Revenue billion Forecast, by Source 2020 & 2033
- Table 12: Global Spent Fuel And Nuclear Waste Management Industry Revenue billion Forecast, by Country 2020 & 2033
- Table 13: Global Spent Fuel And Nuclear Waste Management Industry Revenue billion Forecast, by Type 2020 & 2033
- Table 14: Global Spent Fuel And Nuclear Waste Management Industry Revenue billion Forecast, by Source 2020 & 2033
- Table 15: Global Spent Fuel And Nuclear Waste Management Industry Revenue billion Forecast, by Country 2020 & 2033
- Table 16: Global Spent Fuel And Nuclear Waste Management Industry Revenue billion Forecast, by Type 2020 & 2033
- Table 17: Global Spent Fuel And Nuclear Waste Management Industry Revenue billion Forecast, by Source 2020 & 2033
- Table 18: Global Spent Fuel And Nuclear Waste Management Industry Revenue billion Forecast, by Country 2020 & 2033
Frequently Asked Questions
1. What is the projected Compound Annual Growth Rate (CAGR) of the Spent Fuel And Nuclear Waste Management Industry?
The projected CAGR is approximately 0.9%.
2. Which companies are prominent players in the Spent Fuel And Nuclear Waste Management Industry?
Key companies in the market include Perma-Fix Environmental Services Inc, Enercon Services Inc, EnergySolutions Inc *List Not Exhaustive, Agence Nationale pour la gestion des déchets radioactifs (ANDRA), Bechtel Group Inc, Fluor Corporation, Westinghouse Electric Company LLC (Toshiba), Veolia Environment SA, Augean PLC, Studsvik AB.
3. What are the main segments of the Spent Fuel And Nuclear Waste Management Industry?
The market segments include Type, Source.
4. Can you provide details about the market size?
The market size is estimated to be USD 6.28 billion as of 2022.
5. What are some drivers contributing to market growth?
4.; Increasing Infrastructure Development4.; Rising Emphasis Water and Wastewater Management.
6. What are the notable trends driving market growth?
Low-level Waste Expected to Dominate the Market.
7. Are there any restraints impacting market growth?
4.; Volatility in Raw Material Prices.
8. Can you provide examples of recent developments in the market?
The US Department of Energy, in August 2020, announced that it authorized the start of radioactive operations at the Salt Waste Processing Facility (SWPF) at its Savannah River Site (SRS). The first-of-a-kind facility is expected to process 31 million gallons of radioactive salt waste currently stored in underground tanks at the South Carolina location. The facility was designed and built and initially expected to be operated by Parsons Corporation. It is further expected to start normal operations later this year after hot commissioning is complete.
9. What pricing options are available for accessing the report?
Pricing options include single-user, multi-user, and enterprise licenses priced at USD 4750, USD 5250, and USD 8750 respectively.
10. Is the market size provided in terms of value or volume?
The market size is provided in terms of value, measured in billion.
11. Are there any specific market keywords associated with the report?
Yes, the market keyword associated with the report is "Spent Fuel And Nuclear Waste Management Industry," which aids in identifying and referencing the specific market segment covered.
12. How do I determine which pricing option suits my needs best?
The pricing options vary based on user requirements and access needs. Individual users may opt for single-user licenses, while businesses requiring broader access may choose multi-user or enterprise licenses for cost-effective access to the report.
13. Are there any additional resources or data provided in the Spent Fuel And Nuclear Waste Management Industry report?
While the report offers comprehensive insights, it's advisable to review the specific contents or supplementary materials provided to ascertain if additional resources or data are available.
14. How can I stay updated on further developments or reports in the Spent Fuel And Nuclear Waste Management Industry?
To stay informed about further developments, trends, and reports in the Spent Fuel And Nuclear Waste Management Industry, consider subscribing to industry newsletters, following relevant companies and organizations, or regularly checking reputable industry news sources and publications.
Methodology
Step 1 - Identification of Relevant Samples Size from Population Database


Step 2 - Approaches for Defining Global Market Size (Value, Volume* & Price*)

Note*: In applicable scenarios
Step 3 - Data Sources
Primary Research
- Web Analytics
- Survey Reports
- Research Institute
- Latest Research Reports
- Opinion Leaders
Secondary Research
- Annual Reports
- White Paper
- Latest Press Release
- Industry Association
- Paid Database
- Investor Presentations

Step 4 - Data Triangulation
Involves using different sources of information in order to increase the validity of a study
These sources are likely to be stakeholders in a program - participants, other researchers, program staff, other community members, and so on.
Then we put all data in single framework & apply various statistical tools to find out the dynamic on the market.
During the analysis stage, feedback from the stakeholder groups would be compared to determine areas of agreement as well as areas of divergence