
Key Insights
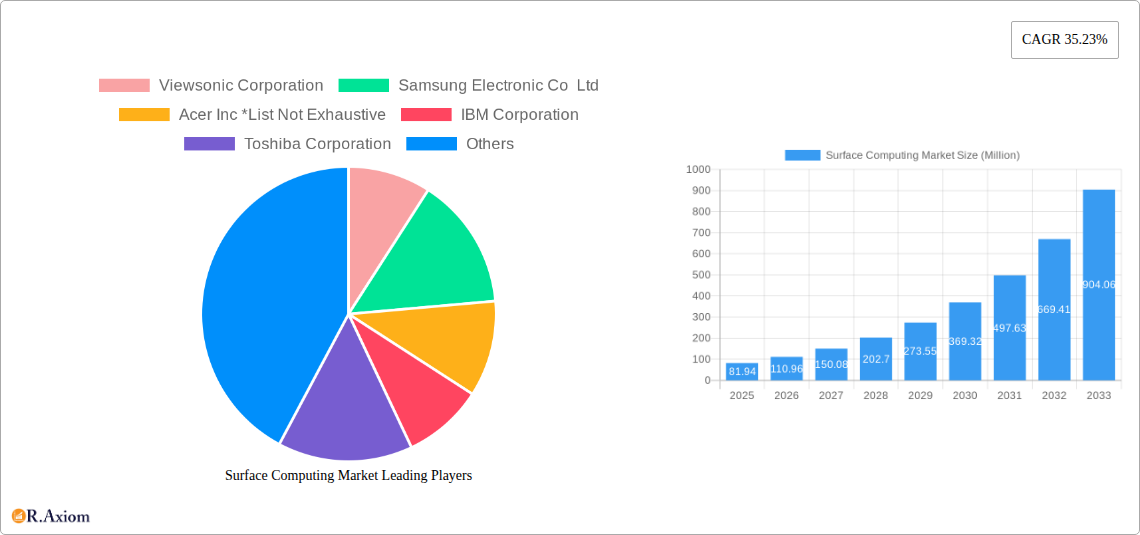
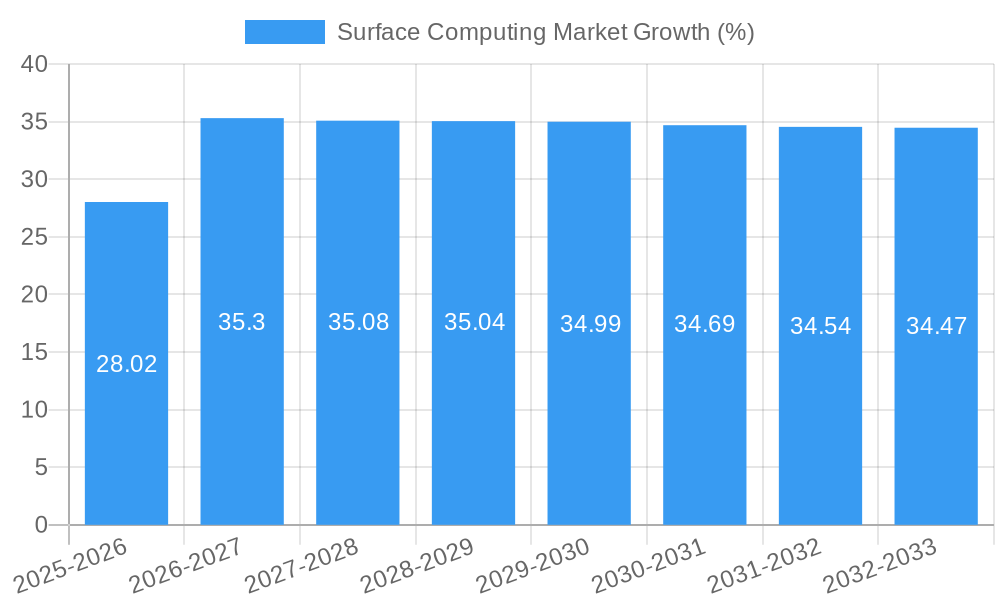
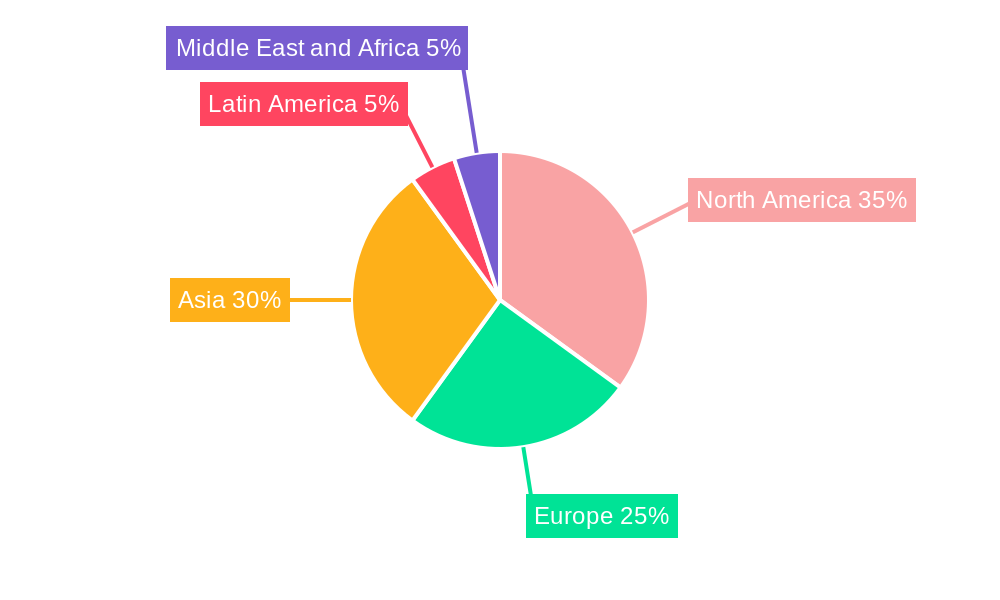
The surface computing market, valued at $81.94 million in 2025, is experiencing robust growth, projected to expand at a compound annual growth rate (CAGR) of 35.23% from 2025 to 2033. This surge is driven by several key factors. The increasing adoption of interactive displays in diverse sectors like retail (digital signage, interactive kiosks), healthcare (patient information systems, telehealth), and education (interactive whiteboards) fuels market expansion. Technological advancements, particularly in multi-touch capabilities, 3D visualization, and improved user interfaces, are enhancing user experience and driving wider adoption. Furthermore, the rise of sophisticated applications, including virtual and augmented reality experiences integrated into surface computing systems, is opening up new avenues for growth. The market segmentation reveals a strong preference for flat displays over curved ones, although the latter segment is expected to witness significant growth due to its immersive capabilities. Multi-touch technology dominates the touch segment, reflecting the increasing demand for intuitive and collaborative interfaces. North America and Asia, particularly China, currently hold significant market share, but emerging markets in Latin America and the Middle East and Africa are anticipated to show promising growth potential over the forecast period. Competitive landscape analysis indicates that established players like Samsung, LG, and Microsoft are actively engaged in product innovation and market expansion, contributing to market dynamism.
The restraining factors for growth primarily involve the relatively high initial investment costs associated with implementing surface computing solutions. However, this barrier is expected to gradually diminish as prices decrease with increased manufacturing and competition. Another challenge lies in ensuring consistent software and hardware compatibility across various platforms. Continuous developments in technological integration and standardization should mitigate this restraint over time. The market's future trajectory will likely be influenced by factors like the ongoing evolution of display technologies, the development of new applications catering to specific industry needs, and the increasing affordability and accessibility of surface computing solutions. The consistent high CAGR suggests the market is poised for substantial expansion in the coming years, making it an attractive investment opportunity for businesses across numerous sectors.
Surface Computing Market: A Comprehensive Report (2019-2033)
This in-depth report provides a comprehensive analysis of the Surface Computing Market, encompassing historical data (2019-2024), current estimates (2025), and future forecasts (2025-2033). The study delves into market size, segmentation, growth drivers, challenges, and emerging opportunities, offering valuable insights for industry stakeholders, investors, and strategic decision-makers. The report covers key players including Viewsonic Corporation, Samsung Electronic Co Ltd, Acer Inc, IBM Corporation, Toshiba Corporation, LG Electronics Inc, Fujitsu Ltd, Planar Systems Inc, Microsoft Corporation, Dell Inc, 3M Co, Qualcomm Technologies Inc, Hewlett-Packard Ltd, Lenovo Group Ltd, Apple Inc, Panasonic Corporation, Intel Corporation, and Sony Corporation, and provides a detailed analysis of various market segments. The total market value is projected to reach xx Million by 2033.
Surface Computing Market Concentration & Innovation
The Surface Computing Market exhibits a moderately concentrated landscape, with several key players holding significant market share. Microsoft, Apple, and Samsung collectively account for approximately xx% of the market, while other players compete fiercely for remaining market share. Innovation is a key driver, with companies investing heavily in R&D to develop advanced display technologies, touch interfaces, and AI-powered features. Regulatory frameworks concerning data privacy and security are impacting market dynamics, necessitating compliance and influencing product design. The emergence of alternative interaction methods (e.g., gesture control, voice recognition) presents a competitive threat, though the current market remains largely driven by touch-based interfaces. M&A activities have been relatively low in the recent past; however, strategic partnerships and collaborations are increasingly common. Recent deal values for M&A transactions within the market have averaged around xx Million, driven by the need to acquire technologies or intellectual property.
- Market Share: Microsoft: xx%; Apple: xx%; Samsung: xx%; Others: xx% (2025 Estimate).
- M&A Activity: Average deal value: xx Million (2019-2024).
- Innovation Drivers: AI integration, advanced display technologies, improved touch sensitivity.
- Regulatory Frameworks: Data privacy regulations (GDPR, CCPA), security standards.
Surface Computing Market Industry Trends & Insights
The Surface Computing Market is experiencing robust growth, driven by increasing demand for interactive displays across various sectors. The market's Compound Annual Growth Rate (CAGR) during the forecast period (2025-2033) is projected to be xx%. Key growth drivers include the increasing adoption of touch-based interfaces in retail, healthcare, education, and commercial settings. Technological advancements, such as the integration of Artificial Intelligence (AI) and the development of more advanced display technologies (e.g., flexible and foldable displays), are further fueling market expansion. Consumer preference for larger, higher-resolution screens, coupled with the rising demand for portability and enhanced user experiences, is also significantly contributing to market growth. The competitive landscape is characterized by both intense rivalry among established players and the entry of new companies, leading to continuous innovation and product diversification. Market penetration is expected to reach xx% by 2033.
Dominant Markets & Segments in Surface Computing Market
The North American region currently holds the dominant position in the Surface Computing Market, fueled by strong demand from the commercial, healthcare, and education sectors. However, the Asia-Pacific region is projected to exhibit the highest growth rate during the forecast period due to rapid economic growth and increasing adoption of technology in emerging economies.
Leading Segments (by 2025 Estimates):
- Type: Flat Displays hold the largest market share, followed by Curved Displays which are experiencing faster growth. Components represent a substantial segment driven by increasing demand for upgrades and replacements.
- Touch: Multi-touch displays dominate, reflecting the increasing preference for sophisticated interaction capabilities. Multi-user touch is a rapidly expanding segment.
- Vision: Two-dimensional displays remain the largest segment; however, three-dimensional displays are gaining traction in niche applications (e.g., gaming, design).
- Application: The Commercial segment leads due to the widespread adoption of surface computing solutions in workplaces. The Healthcare, Retail, and Education segments are also experiencing robust growth.
Key Drivers for Dominant Regions/Segments:
- North America: High disposable income, advanced technological infrastructure, and a strong focus on digital transformation in various sectors.
- Asia-Pacific: Rapid economic growth, expanding middle class, and increasing government initiatives promoting technological adoption.
Surface Computing Market Product Developments
Recent product innovations focus heavily on integrating AI capabilities to enhance user experience and productivity. New computers and tablets are being released with AI-powered features and optimized hardware for faster AI processing. The competitive advantage lies in offering superior user interfaces, integrated AI capabilities, and enhanced security features. This aligns with the ongoing technological trend of integrating AI into everyday devices and optimizing for speed and efficiency.
Report Scope & Segmentation Analysis
This report segments the Surface Computing Market based on Type (Flat Display, Curved Display, Components), Touch (Single Touch, Multi-touch, Multi-user, Other Touches), Vision (Two Dimensional, Three Dimensional), and Application (Entertainment, Retail, Hospitality, Healthcare, Commercial, Advertisement, Automotive, Education, Other Applications). Each segment's growth projection, market size, and competitive dynamics are analyzed in detail. The market is projected to witness significant growth in all segments, with multi-touch and AI-integrated displays driving demand. The commercial application segment is expected to maintain its leading position due to its increasing deployment in various industry sectors.
Key Drivers of Surface Computing Market Growth
The Surface Computing Market is driven by technological advancements (AI integration, improved touch sensitivity, advanced display technologies), economic growth (increasing disposable income, rising investment in technology), and favorable regulatory policies (government initiatives supporting technological adoption). The increasing demand for interactive displays across diverse sectors, such as healthcare, education, and retail, further fuels market expansion.
Challenges in the Surface Computing Market Sector
Challenges include the high initial cost of implementation, the need for specialized software and training, potential supply chain disruptions due to geopolitical factors and material shortages, and intense competition among numerous established and emerging players. The impact of these challenges is quantified in the full report.
Emerging Opportunities in Surface Computing Market
Emerging opportunities include expanding into new applications (e.g., smart homes, automotive), leveraging AI and machine learning to personalize user experiences, developing more sustainable and eco-friendly products, and focusing on niche markets with specific requirements (e.g., healthcare, specialized education).
Leading Players in the Surface Computing Market Market
- Viewsonic Corporation
- Samsung Electronic Co Ltd
- Acer Inc
- IBM Corporation
- Toshiba Corporation
- LG Electronics Inc
- Fujitsu Ltd
- Planar Systems Inc
- Microsoft Corporation
- Dell Inc
- 3M Co
- Qualcomm Technologies Inc
- Hewlett-Packard Ltd
- Lenovo Group Ltd
- Apple Inc
- Panasonic Corporation
- Intel Corporation
- Sony Corporation
Key Developments in Surface Computing Market Industry
- May 2024: Microsoft announced new computers with integrated AI technology, accelerating the adoption of AI-powered PCs and tablets.
- March 2024: Microsoft released two new AI-powered PCs, advanced its management portal, and commercially launched Microsoft Adaptive Accessories. The Surface Laptop 6 launch showcased enhanced AI capabilities and performance.
Strategic Outlook for Surface Computing Market Market
The Surface Computing Market is poised for continued growth, driven by technological innovation, increasing demand across various sectors, and the growing adoption of AI-powered features. Companies that can effectively integrate AI, offer superior user experiences, and cater to niche market needs will be well-positioned to capture significant market share. Focus on sustainability and eco-friendly products will further differentiate successful players.
Surface Computing Market Segmentation
-
1. Type
- 1.1. Flat Display
- 1.2. Curved Display
-
1.3. Components
- 1.3.1. Screen
- 1.3.2. Camera
- 1.3.3. Sensor
- 1.3.4. Processor
- 1.3.5. Software
- 1.3.6. Projector
- 1.3.7. Other Components
-
2. Touch
- 2.1. Single Touch
- 2.2. Multi-touch
- 2.3. Multi-user
- 2.4. Other Touches
-
3. Vision
- 3.1. Two Dimensional
- 3.2. Three Dimensional
-
4. Application
- 4.1. Entertainment
- 4.2. Retail
- 4.3. Hospitality
- 4.4. Healthcare
- 4.5. Commercial
- 4.6. Advertisement
- 4.7. Automotive
- 4.8. Education
- 4.9. Other Applications
Surface Computing Market Segmentation By Geography
-
1. North America
- 1.1. United States
- 1.2. Canada
-
2. Europe
- 2.1. United Kingdom
- 2.2. Germany
- 2.3. France
-
3. Asia
- 3.1. China
- 3.2. Japan
- 3.3. India
- 3.4. Australia and New Zealand
-
4. Latin America
- 4.1. Mexico
- 4.2. Brazil
- 4.3. Argentina
-
5. Middle East and Africa
- 5.1. Saudi Arabia
- 5.2. United Arab Emirates
- 5.3. South Africa
Surface Computing Market REPORT HIGHLIGHTS
| Aspects | Details |
|---|---|
| Study Period | 2019-2033 |
| Base Year | 2024 |
| Estimated Year | 2025 |
| Forecast Period | 2025-2033 |
| Historical Period | 2019-2024 |
| Growth Rate | CAGR of 35.23% from 2019-2033 |
| Segmentation |
|
Table of Contents
- 1. Introduction
- 1.1. Research Scope
- 1.2. Market Segmentation
- 1.3. Research Methodology
- 1.4. Definitions and Assumptions
- 2. Executive Summary
- 2.1. Introduction
- 3. Market Dynamics
- 3.1. Introduction
- 3.2. Market Drivers
- 3.2.1. More Advanced and User-friendly Interface - Natural User Interface (NUI); Increasing Business Revenue Due to Adoption of Multi-user Tabletops
- 3.3. Market Restrains
- 3.3.1. Limited Availability of Features; High Cost of Surface Computers
- 3.4. Market Trends
- 3.4.1. The Retail Sector is Expected to Hold a Significant Market Share
- 4. Market Factor Analysis
- 4.1. Porters Five Forces
- 4.2. Supply/Value Chain
- 4.3. PESTEL analysis
- 4.4. Market Entropy
- 4.5. Patent/Trademark Analysis
- 5. Global Surface Computing Market Analysis, Insights and Forecast, 2019-2031
- 5.1. Market Analysis, Insights and Forecast - by Type
- 5.1.1. Flat Display
- 5.1.2. Curved Display
- 5.1.3. Components
- 5.1.3.1. Screen
- 5.1.3.2. Camera
- 5.1.3.3. Sensor
- 5.1.3.4. Processor
- 5.1.3.5. Software
- 5.1.3.6. Projector
- 5.1.3.7. Other Components
- 5.2. Market Analysis, Insights and Forecast - by Touch
- 5.2.1. Single Touch
- 5.2.2. Multi-touch
- 5.2.3. Multi-user
- 5.2.4. Other Touches
- 5.3. Market Analysis, Insights and Forecast - by Vision
- 5.3.1. Two Dimensional
- 5.3.2. Three Dimensional
- 5.4. Market Analysis, Insights and Forecast - by Application
- 5.4.1. Entertainment
- 5.4.2. Retail
- 5.4.3. Hospitality
- 5.4.4. Healthcare
- 5.4.5. Commercial
- 5.4.6. Advertisement
- 5.4.7. Automotive
- 5.4.8. Education
- 5.4.9. Other Applications
- 5.5. Market Analysis, Insights and Forecast - by Region
- 5.5.1. North America
- 5.5.2. Europe
- 5.5.3. Asia
- 5.5.4. Latin America
- 5.5.5. Middle East and Africa
- 5.1. Market Analysis, Insights and Forecast - by Type
- 6. North America Surface Computing Market Analysis, Insights and Forecast, 2019-2031
- 6.1. Market Analysis, Insights and Forecast - by Type
- 6.1.1. Flat Display
- 6.1.2. Curved Display
- 6.1.3. Components
- 6.1.3.1. Screen
- 6.1.3.2. Camera
- 6.1.3.3. Sensor
- 6.1.3.4. Processor
- 6.1.3.5. Software
- 6.1.3.6. Projector
- 6.1.3.7. Other Components
- 6.2. Market Analysis, Insights and Forecast - by Touch
- 6.2.1. Single Touch
- 6.2.2. Multi-touch
- 6.2.3. Multi-user
- 6.2.4. Other Touches
- 6.3. Market Analysis, Insights and Forecast - by Vision
- 6.3.1. Two Dimensional
- 6.3.2. Three Dimensional
- 6.4. Market Analysis, Insights and Forecast - by Application
- 6.4.1. Entertainment
- 6.4.2. Retail
- 6.4.3. Hospitality
- 6.4.4. Healthcare
- 6.4.5. Commercial
- 6.4.6. Advertisement
- 6.4.7. Automotive
- 6.4.8. Education
- 6.4.9. Other Applications
- 6.1. Market Analysis, Insights and Forecast - by Type
- 7. Europe Surface Computing Market Analysis, Insights and Forecast, 2019-2031
- 7.1. Market Analysis, Insights and Forecast - by Type
- 7.1.1. Flat Display
- 7.1.2. Curved Display
- 7.1.3. Components
- 7.1.3.1. Screen
- 7.1.3.2. Camera
- 7.1.3.3. Sensor
- 7.1.3.4. Processor
- 7.1.3.5. Software
- 7.1.3.6. Projector
- 7.1.3.7. Other Components
- 7.2. Market Analysis, Insights and Forecast - by Touch
- 7.2.1. Single Touch
- 7.2.2. Multi-touch
- 7.2.3. Multi-user
- 7.2.4. Other Touches
- 7.3. Market Analysis, Insights and Forecast - by Vision
- 7.3.1. Two Dimensional
- 7.3.2. Three Dimensional
- 7.4. Market Analysis, Insights and Forecast - by Application
- 7.4.1. Entertainment
- 7.4.2. Retail
- 7.4.3. Hospitality
- 7.4.4. Healthcare
- 7.4.5. Commercial
- 7.4.6. Advertisement
- 7.4.7. Automotive
- 7.4.8. Education
- 7.4.9. Other Applications
- 7.1. Market Analysis, Insights and Forecast - by Type
- 8. Asia Surface Computing Market Analysis, Insights and Forecast, 2019-2031
- 8.1. Market Analysis, Insights and Forecast - by Type
- 8.1.1. Flat Display
- 8.1.2. Curved Display
- 8.1.3. Components
- 8.1.3.1. Screen
- 8.1.3.2. Camera
- 8.1.3.3. Sensor
- 8.1.3.4. Processor
- 8.1.3.5. Software
- 8.1.3.6. Projector
- 8.1.3.7. Other Components
- 8.2. Market Analysis, Insights and Forecast - by Touch
- 8.2.1. Single Touch
- 8.2.2. Multi-touch
- 8.2.3. Multi-user
- 8.2.4. Other Touches
- 8.3. Market Analysis, Insights and Forecast - by Vision
- 8.3.1. Two Dimensional
- 8.3.2. Three Dimensional
- 8.4. Market Analysis, Insights and Forecast - by Application
- 8.4.1. Entertainment
- 8.4.2. Retail
- 8.4.3. Hospitality
- 8.4.4. Healthcare
- 8.4.5. Commercial
- 8.4.6. Advertisement
- 8.4.7. Automotive
- 8.4.8. Education
- 8.4.9. Other Applications
- 8.1. Market Analysis, Insights and Forecast - by Type
- 9. Latin America Surface Computing Market Analysis, Insights and Forecast, 2019-2031
- 9.1. Market Analysis, Insights and Forecast - by Type
- 9.1.1. Flat Display
- 9.1.2. Curved Display
- 9.1.3. Components
- 9.1.3.1. Screen
- 9.1.3.2. Camera
- 9.1.3.3. Sensor
- 9.1.3.4. Processor
- 9.1.3.5. Software
- 9.1.3.6. Projector
- 9.1.3.7. Other Components
- 9.2. Market Analysis, Insights and Forecast - by Touch
- 9.2.1. Single Touch
- 9.2.2. Multi-touch
- 9.2.3. Multi-user
- 9.2.4. Other Touches
- 9.3. Market Analysis, Insights and Forecast - by Vision
- 9.3.1. Two Dimensional
- 9.3.2. Three Dimensional
- 9.4. Market Analysis, Insights and Forecast - by Application
- 9.4.1. Entertainment
- 9.4.2. Retail
- 9.4.3. Hospitality
- 9.4.4. Healthcare
- 9.4.5. Commercial
- 9.4.6. Advertisement
- 9.4.7. Automotive
- 9.4.8. Education
- 9.4.9. Other Applications
- 9.1. Market Analysis, Insights and Forecast - by Type
- 10. Middle East and Africa Surface Computing Market Analysis, Insights and Forecast, 2019-2031
- 10.1. Market Analysis, Insights and Forecast - by Type
- 10.1.1. Flat Display
- 10.1.2. Curved Display
- 10.1.3. Components
- 10.1.3.1. Screen
- 10.1.3.2. Camera
- 10.1.3.3. Sensor
- 10.1.3.4. Processor
- 10.1.3.5. Software
- 10.1.3.6. Projector
- 10.1.3.7. Other Components
- 10.2. Market Analysis, Insights and Forecast - by Touch
- 10.2.1. Single Touch
- 10.2.2. Multi-touch
- 10.2.3. Multi-user
- 10.2.4. Other Touches
- 10.3. Market Analysis, Insights and Forecast - by Vision
- 10.3.1. Two Dimensional
- 10.3.2. Three Dimensional
- 10.4. Market Analysis, Insights and Forecast - by Application
- 10.4.1. Entertainment
- 10.4.2. Retail
- 10.4.3. Hospitality
- 10.4.4. Healthcare
- 10.4.5. Commercial
- 10.4.6. Advertisement
- 10.4.7. Automotive
- 10.4.8. Education
- 10.4.9. Other Applications
- 10.1. Market Analysis, Insights and Forecast - by Type
- 11. North America Surface Computing Market Analysis, Insights and Forecast, 2019-2031
- 11.1. Market Analysis, Insights and Forecast - By Country/Sub-region
- 11.1.1 United States
- 11.1.2 Canada
- 12. Europe Surface Computing Market Analysis, Insights and Forecast, 2019-2031
- 12.1. Market Analysis, Insights and Forecast - By Country/Sub-region
- 12.1.1 United Kingdom
- 12.1.2 Germany
- 12.1.3 France
- 13. Asia Surface Computing Market Analysis, Insights and Forecast, 2019-2031
- 13.1. Market Analysis, Insights and Forecast - By Country/Sub-region
- 13.1.1 China
- 13.1.2 Japan
- 13.1.3 India
- 13.1.4 Australia and New Zealand
- 14. Latin America Surface Computing Market Analysis, Insights and Forecast, 2019-2031
- 14.1. Market Analysis, Insights and Forecast - By Country/Sub-region
- 14.1.1 Mexico
- 14.1.2 Brazil
- 14.1.3 Argentina
- 15. Middle East and Africa Surface Computing Market Analysis, Insights and Forecast, 2019-2031
- 15.1. Market Analysis, Insights and Forecast - By Country/Sub-region
- 15.1.1 Saudi Arabia
- 15.1.2 United Arab Emirates
- 15.1.3 South Africa
- 16. Competitive Analysis
- 16.1. Global Market Share Analysis 2024
- 16.2. Company Profiles
- 16.2.1 Viewsonic Corporation
- 16.2.1.1. Overview
- 16.2.1.2. Products
- 16.2.1.3. SWOT Analysis
- 16.2.1.4. Recent Developments
- 16.2.1.5. Financials (Based on Availability)
- 16.2.2 Samsung Electronic Co Ltd
- 16.2.2.1. Overview
- 16.2.2.2. Products
- 16.2.2.3. SWOT Analysis
- 16.2.2.4. Recent Developments
- 16.2.2.5. Financials (Based on Availability)
- 16.2.3 Acer Inc *List Not Exhaustive
- 16.2.3.1. Overview
- 16.2.3.2. Products
- 16.2.3.3. SWOT Analysis
- 16.2.3.4. Recent Developments
- 16.2.3.5. Financials (Based on Availability)
- 16.2.4 IBM Corporation
- 16.2.4.1. Overview
- 16.2.4.2. Products
- 16.2.4.3. SWOT Analysis
- 16.2.4.4. Recent Developments
- 16.2.4.5. Financials (Based on Availability)
- 16.2.5 Toshiba Corporation
- 16.2.5.1. Overview
- 16.2.5.2. Products
- 16.2.5.3. SWOT Analysis
- 16.2.5.4. Recent Developments
- 16.2.5.5. Financials (Based on Availability)
- 16.2.6 LG Electronics Inc
- 16.2.6.1. Overview
- 16.2.6.2. Products
- 16.2.6.3. SWOT Analysis
- 16.2.6.4. Recent Developments
- 16.2.6.5. Financials (Based on Availability)
- 16.2.7 Fujitsu Ltd
- 16.2.7.1. Overview
- 16.2.7.2. Products
- 16.2.7.3. SWOT Analysis
- 16.2.7.4. Recent Developments
- 16.2.7.5. Financials (Based on Availability)
- 16.2.8 Planar Systems Inc
- 16.2.8.1. Overview
- 16.2.8.2. Products
- 16.2.8.3. SWOT Analysis
- 16.2.8.4. Recent Developments
- 16.2.8.5. Financials (Based on Availability)
- 16.2.9 Microsoft Corporation
- 16.2.9.1. Overview
- 16.2.9.2. Products
- 16.2.9.3. SWOT Analysis
- 16.2.9.4. Recent Developments
- 16.2.9.5. Financials (Based on Availability)
- 16.2.10 Dell Inc
- 16.2.10.1. Overview
- 16.2.10.2. Products
- 16.2.10.3. SWOT Analysis
- 16.2.10.4. Recent Developments
- 16.2.10.5. Financials (Based on Availability)
- 16.2.11 3M Co
- 16.2.11.1. Overview
- 16.2.11.2. Products
- 16.2.11.3. SWOT Analysis
- 16.2.11.4. Recent Developments
- 16.2.11.5. Financials (Based on Availability)
- 16.2.12 Qualcomm Technologies Inc
- 16.2.12.1. Overview
- 16.2.12.2. Products
- 16.2.12.3. SWOT Analysis
- 16.2.12.4. Recent Developments
- 16.2.12.5. Financials (Based on Availability)
- 16.2.13 Hewlett-Packard Ltd
- 16.2.13.1. Overview
- 16.2.13.2. Products
- 16.2.13.3. SWOT Analysis
- 16.2.13.4. Recent Developments
- 16.2.13.5. Financials (Based on Availability)
- 16.2.14 Lenovo Group Ltd
- 16.2.14.1. Overview
- 16.2.14.2. Products
- 16.2.14.3. SWOT Analysis
- 16.2.14.4. Recent Developments
- 16.2.14.5. Financials (Based on Availability)
- 16.2.15 Apple Inc
- 16.2.15.1. Overview
- 16.2.15.2. Products
- 16.2.15.3. SWOT Analysis
- 16.2.15.4. Recent Developments
- 16.2.15.5. Financials (Based on Availability)
- 16.2.16 Panasonic Corporation
- 16.2.16.1. Overview
- 16.2.16.2. Products
- 16.2.16.3. SWOT Analysis
- 16.2.16.4. Recent Developments
- 16.2.16.5. Financials (Based on Availability)
- 16.2.17 Intel Corporation
- 16.2.17.1. Overview
- 16.2.17.2. Products
- 16.2.17.3. SWOT Analysis
- 16.2.17.4. Recent Developments
- 16.2.17.5. Financials (Based on Availability)
- 16.2.18 Sony Corporation
- 16.2.18.1. Overview
- 16.2.18.2. Products
- 16.2.18.3. SWOT Analysis
- 16.2.18.4. Recent Developments
- 16.2.18.5. Financials (Based on Availability)
- 16.2.1 Viewsonic Corporation
List of Figures
- Figure 1: Global Surface Computing Market Revenue Breakdown (Million, %) by Region 2024 & 2032
- Figure 2: North America Surface Computing Market Revenue (Million), by Country 2024 & 2032
- Figure 3: North America Surface Computing Market Revenue Share (%), by Country 2024 & 2032
- Figure 4: Europe Surface Computing Market Revenue (Million), by Country 2024 & 2032
- Figure 5: Europe Surface Computing Market Revenue Share (%), by Country 2024 & 2032
- Figure 6: Asia Surface Computing Market Revenue (Million), by Country 2024 & 2032
- Figure 7: Asia Surface Computing Market Revenue Share (%), by Country 2024 & 2032
- Figure 8: Latin America Surface Computing Market Revenue (Million), by Country 2024 & 2032
- Figure 9: Latin America Surface Computing Market Revenue Share (%), by Country 2024 & 2032
- Figure 10: Middle East and Africa Surface Computing Market Revenue (Million), by Country 2024 & 2032
- Figure 11: Middle East and Africa Surface Computing Market Revenue Share (%), by Country 2024 & 2032
- Figure 12: North America Surface Computing Market Revenue (Million), by Type 2024 & 2032
- Figure 13: North America Surface Computing Market Revenue Share (%), by Type 2024 & 2032
- Figure 14: North America Surface Computing Market Revenue (Million), by Touch 2024 & 2032
- Figure 15: North America Surface Computing Market Revenue Share (%), by Touch 2024 & 2032
- Figure 16: North America Surface Computing Market Revenue (Million), by Vision 2024 & 2032
- Figure 17: North America Surface Computing Market Revenue Share (%), by Vision 2024 & 2032
- Figure 18: North America Surface Computing Market Revenue (Million), by Application 2024 & 2032
- Figure 19: North America Surface Computing Market Revenue Share (%), by Application 2024 & 2032
- Figure 20: North America Surface Computing Market Revenue (Million), by Country 2024 & 2032
- Figure 21: North America Surface Computing Market Revenue Share (%), by Country 2024 & 2032
- Figure 22: Europe Surface Computing Market Revenue (Million), by Type 2024 & 2032
- Figure 23: Europe Surface Computing Market Revenue Share (%), by Type 2024 & 2032
- Figure 24: Europe Surface Computing Market Revenue (Million), by Touch 2024 & 2032
- Figure 25: Europe Surface Computing Market Revenue Share (%), by Touch 2024 & 2032
- Figure 26: Europe Surface Computing Market Revenue (Million), by Vision 2024 & 2032
- Figure 27: Europe Surface Computing Market Revenue Share (%), by Vision 2024 & 2032
- Figure 28: Europe Surface Computing Market Revenue (Million), by Application 2024 & 2032
- Figure 29: Europe Surface Computing Market Revenue Share (%), by Application 2024 & 2032
- Figure 30: Europe Surface Computing Market Revenue (Million), by Country 2024 & 2032
- Figure 31: Europe Surface Computing Market Revenue Share (%), by Country 2024 & 2032
- Figure 32: Asia Surface Computing Market Revenue (Million), by Type 2024 & 2032
- Figure 33: Asia Surface Computing Market Revenue Share (%), by Type 2024 & 2032
- Figure 34: Asia Surface Computing Market Revenue (Million), by Touch 2024 & 2032
- Figure 35: Asia Surface Computing Market Revenue Share (%), by Touch 2024 & 2032
- Figure 36: Asia Surface Computing Market Revenue (Million), by Vision 2024 & 2032
- Figure 37: Asia Surface Computing Market Revenue Share (%), by Vision 2024 & 2032
- Figure 38: Asia Surface Computing Market Revenue (Million), by Application 2024 & 2032
- Figure 39: Asia Surface Computing Market Revenue Share (%), by Application 2024 & 2032
- Figure 40: Asia Surface Computing Market Revenue (Million), by Country 2024 & 2032
- Figure 41: Asia Surface Computing Market Revenue Share (%), by Country 2024 & 2032
- Figure 42: Latin America Surface Computing Market Revenue (Million), by Type 2024 & 2032
- Figure 43: Latin America Surface Computing Market Revenue Share (%), by Type 2024 & 2032
- Figure 44: Latin America Surface Computing Market Revenue (Million), by Touch 2024 & 2032
- Figure 45: Latin America Surface Computing Market Revenue Share (%), by Touch 2024 & 2032
- Figure 46: Latin America Surface Computing Market Revenue (Million), by Vision 2024 & 2032
- Figure 47: Latin America Surface Computing Market Revenue Share (%), by Vision 2024 & 2032
- Figure 48: Latin America Surface Computing Market Revenue (Million), by Application 2024 & 2032
- Figure 49: Latin America Surface Computing Market Revenue Share (%), by Application 2024 & 2032
- Figure 50: Latin America Surface Computing Market Revenue (Million), by Country 2024 & 2032
- Figure 51: Latin America Surface Computing Market Revenue Share (%), by Country 2024 & 2032
- Figure 52: Middle East and Africa Surface Computing Market Revenue (Million), by Type 2024 & 2032
- Figure 53: Middle East and Africa Surface Computing Market Revenue Share (%), by Type 2024 & 2032
- Figure 54: Middle East and Africa Surface Computing Market Revenue (Million), by Touch 2024 & 2032
- Figure 55: Middle East and Africa Surface Computing Market Revenue Share (%), by Touch 2024 & 2032
- Figure 56: Middle East and Africa Surface Computing Market Revenue (Million), by Vision 2024 & 2032
- Figure 57: Middle East and Africa Surface Computing Market Revenue Share (%), by Vision 2024 & 2032
- Figure 58: Middle East and Africa Surface Computing Market Revenue (Million), by Application 2024 & 2032
- Figure 59: Middle East and Africa Surface Computing Market Revenue Share (%), by Application 2024 & 2032
- Figure 60: Middle East and Africa Surface Computing Market Revenue (Million), by Country 2024 & 2032
- Figure 61: Middle East and Africa Surface Computing Market Revenue Share (%), by Country 2024 & 2032
List of Tables
- Table 1: Global Surface Computing Market Revenue Million Forecast, by Region 2019 & 2032
- Table 2: Global Surface Computing Market Revenue Million Forecast, by Type 2019 & 2032
- Table 3: Global Surface Computing Market Revenue Million Forecast, by Touch 2019 & 2032
- Table 4: Global Surface Computing Market Revenue Million Forecast, by Vision 2019 & 2032
- Table 5: Global Surface Computing Market Revenue Million Forecast, by Application 2019 & 2032
- Table 6: Global Surface Computing Market Revenue Million Forecast, by Region 2019 & 2032
- Table 7: Global Surface Computing Market Revenue Million Forecast, by Country 2019 & 2032
- Table 8: United States Surface Computing Market Revenue (Million) Forecast, by Application 2019 & 2032
- Table 9: Canada Surface Computing Market Revenue (Million) Forecast, by Application 2019 & 2032
- Table 10: Global Surface Computing Market Revenue Million Forecast, by Country 2019 & 2032
- Table 11: United Kingdom Surface Computing Market Revenue (Million) Forecast, by Application 2019 & 2032
- Table 12: Germany Surface Computing Market Revenue (Million) Forecast, by Application 2019 & 2032
- Table 13: France Surface Computing Market Revenue (Million) Forecast, by Application 2019 & 2032
- Table 14: Global Surface Computing Market Revenue Million Forecast, by Country 2019 & 2032
- Table 15: China Surface Computing Market Revenue (Million) Forecast, by Application 2019 & 2032
- Table 16: Japan Surface Computing Market Revenue (Million) Forecast, by Application 2019 & 2032
- Table 17: India Surface Computing Market Revenue (Million) Forecast, by Application 2019 & 2032
- Table 18: Australia and New Zealand Surface Computing Market Revenue (Million) Forecast, by Application 2019 & 2032
- Table 19: Global Surface Computing Market Revenue Million Forecast, by Country 2019 & 2032
- Table 20: Mexico Surface Computing Market Revenue (Million) Forecast, by Application 2019 & 2032
- Table 21: Brazil Surface Computing Market Revenue (Million) Forecast, by Application 2019 & 2032
- Table 22: Argentina Surface Computing Market Revenue (Million) Forecast, by Application 2019 & 2032
- Table 23: Global Surface Computing Market Revenue Million Forecast, by Country 2019 & 2032
- Table 24: Saudi Arabia Surface Computing Market Revenue (Million) Forecast, by Application 2019 & 2032
- Table 25: United Arab Emirates Surface Computing Market Revenue (Million) Forecast, by Application 2019 & 2032
- Table 26: South Africa Surface Computing Market Revenue (Million) Forecast, by Application 2019 & 2032
- Table 27: Global Surface Computing Market Revenue Million Forecast, by Type 2019 & 2032
- Table 28: Global Surface Computing Market Revenue Million Forecast, by Touch 2019 & 2032
- Table 29: Global Surface Computing Market Revenue Million Forecast, by Vision 2019 & 2032
- Table 30: Global Surface Computing Market Revenue Million Forecast, by Application 2019 & 2032
- Table 31: Global Surface Computing Market Revenue Million Forecast, by Country 2019 & 2032
- Table 32: United States Surface Computing Market Revenue (Million) Forecast, by Application 2019 & 2032
- Table 33: Canada Surface Computing Market Revenue (Million) Forecast, by Application 2019 & 2032
- Table 34: Global Surface Computing Market Revenue Million Forecast, by Type 2019 & 2032
- Table 35: Global Surface Computing Market Revenue Million Forecast, by Touch 2019 & 2032
- Table 36: Global Surface Computing Market Revenue Million Forecast, by Vision 2019 & 2032
- Table 37: Global Surface Computing Market Revenue Million Forecast, by Application 2019 & 2032
- Table 38: Global Surface Computing Market Revenue Million Forecast, by Country 2019 & 2032
- Table 39: United Kingdom Surface Computing Market Revenue (Million) Forecast, by Application 2019 & 2032
- Table 40: Germany Surface Computing Market Revenue (Million) Forecast, by Application 2019 & 2032
- Table 41: France Surface Computing Market Revenue (Million) Forecast, by Application 2019 & 2032
- Table 42: Global Surface Computing Market Revenue Million Forecast, by Type 2019 & 2032
- Table 43: Global Surface Computing Market Revenue Million Forecast, by Touch 2019 & 2032
- Table 44: Global Surface Computing Market Revenue Million Forecast, by Vision 2019 & 2032
- Table 45: Global Surface Computing Market Revenue Million Forecast, by Application 2019 & 2032
- Table 46: Global Surface Computing Market Revenue Million Forecast, by Country 2019 & 2032
- Table 47: China Surface Computing Market Revenue (Million) Forecast, by Application 2019 & 2032
- Table 48: Japan Surface Computing Market Revenue (Million) Forecast, by Application 2019 & 2032
- Table 49: India Surface Computing Market Revenue (Million) Forecast, by Application 2019 & 2032
- Table 50: Australia and New Zealand Surface Computing Market Revenue (Million) Forecast, by Application 2019 & 2032
- Table 51: Global Surface Computing Market Revenue Million Forecast, by Type 2019 & 2032
- Table 52: Global Surface Computing Market Revenue Million Forecast, by Touch 2019 & 2032
- Table 53: Global Surface Computing Market Revenue Million Forecast, by Vision 2019 & 2032
- Table 54: Global Surface Computing Market Revenue Million Forecast, by Application 2019 & 2032
- Table 55: Global Surface Computing Market Revenue Million Forecast, by Country 2019 & 2032
- Table 56: Mexico Surface Computing Market Revenue (Million) Forecast, by Application 2019 & 2032
- Table 57: Brazil Surface Computing Market Revenue (Million) Forecast, by Application 2019 & 2032
- Table 58: Argentina Surface Computing Market Revenue (Million) Forecast, by Application 2019 & 2032
- Table 59: Global Surface Computing Market Revenue Million Forecast, by Type 2019 & 2032
- Table 60: Global Surface Computing Market Revenue Million Forecast, by Touch 2019 & 2032
- Table 61: Global Surface Computing Market Revenue Million Forecast, by Vision 2019 & 2032
- Table 62: Global Surface Computing Market Revenue Million Forecast, by Application 2019 & 2032
- Table 63: Global Surface Computing Market Revenue Million Forecast, by Country 2019 & 2032
- Table 64: Saudi Arabia Surface Computing Market Revenue (Million) Forecast, by Application 2019 & 2032
- Table 65: United Arab Emirates Surface Computing Market Revenue (Million) Forecast, by Application 2019 & 2032
- Table 66: South Africa Surface Computing Market Revenue (Million) Forecast, by Application 2019 & 2032
Frequently Asked Questions
1. What is the projected Compound Annual Growth Rate (CAGR) of the Surface Computing Market?
The projected CAGR is approximately 35.23%.
2. Which companies are prominent players in the Surface Computing Market?
Key companies in the market include Viewsonic Corporation, Samsung Electronic Co Ltd, Acer Inc *List Not Exhaustive, IBM Corporation, Toshiba Corporation, LG Electronics Inc, Fujitsu Ltd, Planar Systems Inc, Microsoft Corporation, Dell Inc, 3M Co, Qualcomm Technologies Inc, Hewlett-Packard Ltd, Lenovo Group Ltd, Apple Inc, Panasonic Corporation, Intel Corporation, Sony Corporation.
3. What are the main segments of the Surface Computing Market?
The market segments include Type, Touch, Vision, Application.
4. Can you provide details about the market size?
The market size is estimated to be USD 81.94 Million as of 2022.
5. What are some drivers contributing to market growth?
More Advanced and User-friendly Interface - Natural User Interface (NUI); Increasing Business Revenue Due to Adoption of Multi-user Tabletops.
6. What are the notable trends driving market growth?
The Retail Sector is Expected to Hold a Significant Market Share.
7. Are there any restraints impacting market growth?
Limited Availability of Features; High Cost of Surface Computers.
8. Can you provide examples of recent developments in the market?
May 2024 - Microsoft announced new computers with the company’s artificial intelligence tech built directly into them, boosting the race among tech giants to push out AI tools to the public and adding computer chips that are tailored to run AI technology to the company’s PCs and tablets will make AI tools and features run faster than if the technology runs through an internet connection, as most chatbots.
9. What pricing options are available for accessing the report?
Pricing options include single-user, multi-user, and enterprise licenses priced at USD 4750, USD 5250, and USD 8750 respectively.
10. Is the market size provided in terms of value or volume?
The market size is provided in terms of value, measured in Million.
11. Are there any specific market keywords associated with the report?
Yes, the market keyword associated with the report is "Surface Computing Market," which aids in identifying and referencing the specific market segment covered.
12. How do I determine which pricing option suits my needs best?
The pricing options vary based on user requirements and access needs. Individual users may opt for single-user licenses, while businesses requiring broader access may choose multi-user or enterprise licenses for cost-effective access to the report.
13. Are there any additional resources or data provided in the Surface Computing Market report?
While the report offers comprehensive insights, it's advisable to review the specific contents or supplementary materials provided to ascertain if additional resources or data are available.
14. How can I stay updated on further developments or reports in the Surface Computing Market?
To stay informed about further developments, trends, and reports in the Surface Computing Market, consider subscribing to industry newsletters, following relevant companies and organizations, or regularly checking reputable industry news sources and publications.
Methodology
Step 1 - Identification of Relevant Samples Size from Population Database


Step 2 - Approaches for Defining Global Market Size (Value, Volume* & Price*)

Note*: In applicable scenarios
Step 3 - Data Sources
Primary Research
- Web Analytics
- Survey Reports
- Research Institute
- Latest Research Reports
- Opinion Leaders
Secondary Research
- Annual Reports
- White Paper
- Latest Press Release
- Industry Association
- Paid Database
- Investor Presentations

Step 4 - Data Triangulation
Involves using different sources of information in order to increase the validity of a study
These sources are likely to be stakeholders in a program - participants, other researchers, program staff, other community members, and so on.
Then we put all data in single framework & apply various statistical tools to find out the dynamic on the market.
During the analysis stage, feedback from the stakeholder groups would be compared to determine areas of agreement as well as areas of divergence


