
Key Insights
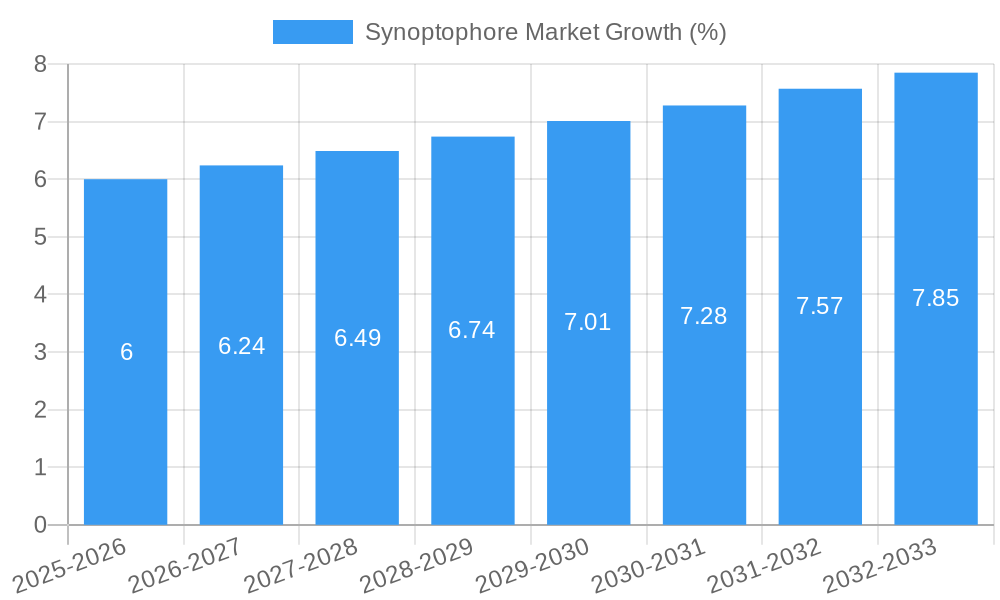
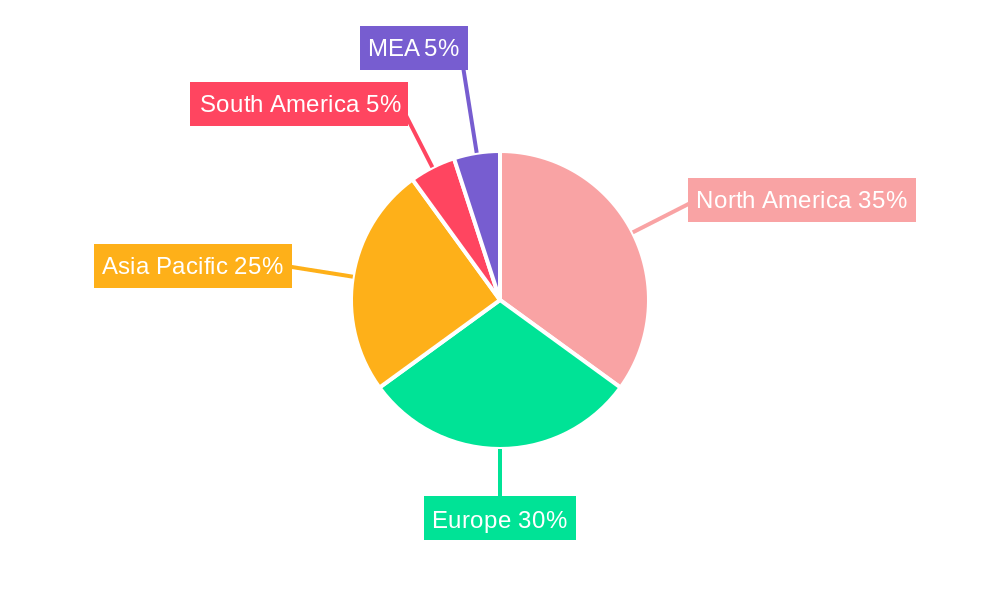
The global synoptophore market is experiencing steady growth, projected to maintain a Compound Annual Growth Rate (CAGR) of 4.00% from 2025 to 2033. This growth is fueled by several key factors. The increasing prevalence of strabismus and other binocular vision disorders, particularly in children, is driving demand for accurate diagnostic and therapeutic tools like synoptophores. Advancements in technology, leading to more sophisticated and user-friendly automatic synoptophores, are also contributing to market expansion. Furthermore, rising healthcare expenditure globally, coupled with an increasing awareness of early intervention for vision problems, is bolstering market growth. The market is segmented by application (diagnostic and therapeutic), instrument type (manual and automatic), and end-user (hospitals, clinics, and other end-users). The automatic segment is anticipated to witness faster growth due to its enhanced precision and efficiency compared to manual devices. Hospitals and clinics constitute the largest end-user segment, owing to their extensive diagnostic and treatment capabilities. Geographic regions like North America and Europe are currently leading the market due to well-established healthcare infrastructure and high adoption rates of advanced ophthalmic technologies. However, Asia Pacific is expected to showcase significant growth potential in the coming years, driven by rising disposable incomes and increasing healthcare awareness in developing economies. Competition within the market is relatively moderate, with both established international players and regional manufacturers catering to the diverse needs of various regions and customer segments.
The restraints on market growth primarily involve the high cost of advanced synoptophores, which can limit accessibility in certain regions and healthcare settings. Additionally, the availability of alternative treatment methods and a lack of awareness about the benefits of synoptophore-based diagnostics and therapy in some regions pose challenges. Nevertheless, ongoing technological advancements, coupled with rising investments in ophthalmic healthcare, are likely to mitigate these restraints over the forecast period. The market is expected to witness increased consolidation through mergers and acquisitions as companies strive to expand their product portfolios and geographical reach. The focus on developing portable and cost-effective synoptophores is likely to further enhance the market's accessibility and drive growth in underserved regions.
Synoptophore Market: A Comprehensive Report (2019-2033)
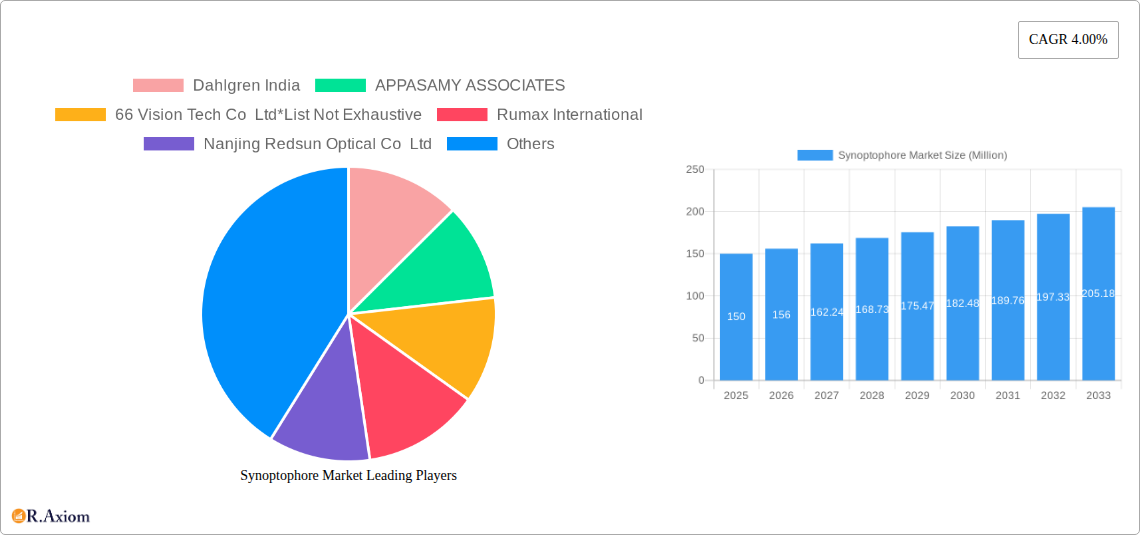
This comprehensive report provides a detailed analysis of the global Synoptophore market, offering invaluable insights for industry stakeholders, investors, and market entrants. Spanning the period from 2019 to 2033, with a base year of 2025 and a forecast period of 2025-2033, this report meticulously examines market size, growth drivers, challenges, and emerging opportunities. The study period covers 2019-2024 (historical period) and 2025-2033 (forecast period). The estimated market size for 2025 is xx Million.
Synoptophore Market Market Concentration & Innovation
The Synoptophore market exhibits a moderately concentrated landscape, with key players such as Haag-Streit Group, Nanjing Redsun Optical Co Ltd, and Dahlgren India holding significant market share. Precise market share figures for each company are unavailable at this time, but estimates suggest a combined share of approximately xx%. Innovation within the sector is driven by advancements in optical technologies, the integration of digital imaging and analysis capabilities, and the development of more user-friendly and efficient instruments. The regulatory landscape varies across regions, influencing market access and product approvals. Substitutes for synoptophores are limited, primarily other methods of strabismus assessment and management, but none offer the same level of precision and functionality. End-user trends indicate a growing preference for automatic synoptophores due to improved accuracy and reduced examination time. Mergers and acquisitions (M&A) activity has been relatively low in recent years, with no major deals exceeding xx Million reported during the historical period.
- Market Concentration: Moderately Concentrated, Top 3 players hold approx. xx% market share.
- Innovation Drivers: Advancements in optical technology, digital integration, improved user-friendliness.
- Regulatory Frameworks: Vary across regions, impacting market access.
- Product Substitutes: Limited, with alternative methods offering less precision.
- End-User Trends: Shifting towards automatic instruments for increased efficiency.
- M&A Activity: Relatively low, with no significant deals exceeding xx Million in recent years.
Synoptophore Market Industry Trends & Insights
The global Synoptophore market is projected to experience robust growth, with a Compound Annual Growth Rate (CAGR) of xx% during the forecast period (2025-2033). This growth is primarily fueled by the rising prevalence of strabismus, increased awareness of early diagnosis and treatment, technological advancements leading to improved accuracy and efficiency, and expanding healthcare infrastructure in developing economies. The market penetration of automatic synoptophores is steadily increasing, driven by their superior capabilities. However, the high cost of advanced instruments and the limited availability of trained professionals in some regions pose challenges. Competitive dynamics are shaped by technological innovation, product differentiation, and pricing strategies. The market is witnessing a gradual shift towards sophisticated instruments incorporating digital imaging and advanced analysis tools.
Dominant Markets & Segments in Synoptophore Market
The North American region currently dominates the Synoptophore market, driven by factors such as high healthcare expenditure, advanced healthcare infrastructure, and a higher prevalence of strabismus. Within the segments:
By Application: The diagnostic segment holds the largest market share, reflecting the crucial role of synoptophores in the initial assessment of strabismus. The therapeutic segment is also growing due to the increased adoption of synoptophores in treatment monitoring.
By Instrument Type: The automatic synoptophore segment is witnessing faster growth, outpacing the manual segment due to its enhanced accuracy, efficiency, and ease of use.
By End User: Hospitals and specialized eye clinics remain the largest end-users, followed by other end-users such as optometry practices.
Key Drivers for North American Dominance:
- High healthcare expenditure
- Advanced healthcare infrastructure
- Higher prevalence of strabismus
- Strong regulatory support for advanced medical technologies
Synoptophore Market Product Developments
Recent product innovations focus on enhancing image quality, integrating advanced analysis algorithms, and incorporating user-friendly interfaces. Automatic synoptophores with features such as automated measurements, digital image storage, and remote diagnostic capabilities are gaining popularity. These advancements improve diagnostic accuracy, streamline workflows, and enhance the overall patient experience. The competitive advantage lies in offering superior image quality, intuitive software, and comprehensive diagnostic features.
Report Scope & Segmentation Analysis
This report provides a detailed segmentation analysis of the Synoptophore market across several key parameters:
By Application: Diagnostic and Therapeutic. The diagnostic application currently holds a larger market share, with projected growth for the therapeutic application driven by increasing utilization in treatment monitoring.
By Instrument Type: Manual and Automatic. The automatic segment exhibits faster growth due to its improved accuracy and efficiency.
By End User: Hospitals, Clinics, and Other End Users. Hospitals and specialized clinics constitute the largest end-user segment.
Each segment's growth projections and competitive dynamics are analyzed in depth within the full report.
Key Drivers of Synoptophore Market Growth
The Synoptophore market is propelled by several key factors: the rising prevalence of strabismus globally; increasing awareness of early diagnosis and treatment among healthcare professionals and the public; technological advancements leading to more accurate and efficient devices; and the expansion of healthcare infrastructure, particularly in emerging markets. Government initiatives promoting eye health and increased investment in ophthalmological research further contribute to market growth.
Challenges in the Synoptophore Market Sector
Key challenges include the high cost of advanced synoptophores, which limits accessibility in resource-constrained settings; the need for skilled professionals to operate and interpret the results; and the presence of alternative, albeit less precise, methods for assessing strabismus. Furthermore, stringent regulatory requirements in certain regions can create barriers to market entry for new players. The overall impact of these challenges on market growth is estimated at xx% during the forecast period.
Emerging Opportunities in Synoptophore Market
Emerging opportunities include the development of portable and cost-effective synoptophores for use in remote areas; integration of artificial intelligence (AI) and machine learning (ML) for automated diagnosis and analysis; and the expansion into untapped markets in developing countries. The growing adoption of telehealth platforms also presents potential opportunities for remote diagnosis and monitoring using synoptophores.
Leading Players in the Synoptophore Market Market
- Dahlgren India
- APPASAMY ASSOCIATES
- 66 Vision Tech Co Ltd
- Rumax International
- Nanjing Redsun Optical Co Ltd
- Prkamya Visions
- Gem Optical Instruments Industries
- HAAG-STREIT GROUP
Key Developments in Synoptophore Market Industry
- May 2021: Haag-Streit UK launched the Eyestar 900, a swept-source OCT-based eye analyzer offering precise measurements of the entire eye. This launch significantly enhanced the capabilities available in the market.
Strategic Outlook for Synoptophore Market Market
The Synoptophore market presents significant growth potential driven by technological advancements, expanding healthcare infrastructure, and increasing awareness of strabismus. Companies focusing on innovation, strategic partnerships, and expansion into emerging markets are well-positioned to capitalize on these opportunities. The market is expected to see continued growth, with a particular focus on the adoption of advanced automatic systems and integration with other ophthalmic technologies.
Synoptophore Market Segmentation
-
1. Application
- 1.1. Diagnostic
- 1.2. Therapeutic
-
2. Instrument Type
- 2.1. Manual
- 2.2. Automatic
-
3. End User
- 3.1. Hospitals
- 3.2. Clinics
- 3.3. Other End Users
Synoptophore Market Segmentation By Geography
-
1. North America
- 1.1. United States
- 1.2. Canada
- 1.3. Mexico
-
2. Europe
- 2.1. Germany
- 2.2. United Kingdom
- 2.3. France
- 2.4. Italy
- 2.5. Spain
- 2.6. Rest of Europe
-
3. Asia Pacific
- 3.1. China
- 3.2. Japan
- 3.3. India
- 3.4. Australia
- 3.5. South Korea
- 3.6. Rest of Asia Pacific
- 4. Rest of the World
Synoptophore Market REPORT HIGHLIGHTS
| Aspects | Details |
|---|---|
| Study Period | 2019-2033 |
| Base Year | 2024 |
| Estimated Year | 2025 |
| Forecast Period | 2025-2033 |
| Historical Period | 2019-2024 |
| Growth Rate | CAGR of 4.00% from 2019-2033 |
| Segmentation |
|
Table of Contents
- 1. Introduction
- 1.1. Research Scope
- 1.2. Market Segmentation
- 1.3. Research Methodology
- 1.4. Definitions and Assumptions
- 2. Executive Summary
- 2.1. Introduction
- 3. Market Dynamics
- 3.1. Introduction
- 3.2. Market Drivers
- 3.2.1. Increasing Incidences of Visual Acuity Disorders; Growing Awareness on the Early Diagnosis of Visual Acuity Disorder; Rising Demand for Non-invasive Procedures
- 3.3. Market Restrains
- 3.3.1. High Cost of Synoptophore Device; Access to Alternative Treatments
- 3.4. Market Trends
- 3.4.1. Therapeutic Application is Expected to Witness a Significant Growth Over the Forecast Period
- 4. Market Factor Analysis
- 4.1. Porters Five Forces
- 4.2. Supply/Value Chain
- 4.3. PESTEL analysis
- 4.4. Market Entropy
- 4.5. Patent/Trademark Analysis
- 5. Global Synoptophore Market Analysis, Insights and Forecast, 2019-2031
- 5.1. Market Analysis, Insights and Forecast - by Application
- 5.1.1. Diagnostic
- 5.1.2. Therapeutic
- 5.2. Market Analysis, Insights and Forecast - by Instrument Type
- 5.2.1. Manual
- 5.2.2. Automatic
- 5.3. Market Analysis, Insights and Forecast - by End User
- 5.3.1. Hospitals
- 5.3.2. Clinics
- 5.3.3. Other End Users
- 5.4. Market Analysis, Insights and Forecast - by Region
- 5.4.1. North America
- 5.4.2. Europe
- 5.4.3. Asia Pacific
- 5.4.4. Rest of the World
- 5.1. Market Analysis, Insights and Forecast - by Application
- 6. North America Synoptophore Market Analysis, Insights and Forecast, 2019-2031
- 6.1. Market Analysis, Insights and Forecast - by Application
- 6.1.1. Diagnostic
- 6.1.2. Therapeutic
- 6.2. Market Analysis, Insights and Forecast - by Instrument Type
- 6.2.1. Manual
- 6.2.2. Automatic
- 6.3. Market Analysis, Insights and Forecast - by End User
- 6.3.1. Hospitals
- 6.3.2. Clinics
- 6.3.3. Other End Users
- 6.1. Market Analysis, Insights and Forecast - by Application
- 7. Europe Synoptophore Market Analysis, Insights and Forecast, 2019-2031
- 7.1. Market Analysis, Insights and Forecast - by Application
- 7.1.1. Diagnostic
- 7.1.2. Therapeutic
- 7.2. Market Analysis, Insights and Forecast - by Instrument Type
- 7.2.1. Manual
- 7.2.2. Automatic
- 7.3. Market Analysis, Insights and Forecast - by End User
- 7.3.1. Hospitals
- 7.3.2. Clinics
- 7.3.3. Other End Users
- 7.1. Market Analysis, Insights and Forecast - by Application
- 8. Asia Pacific Synoptophore Market Analysis, Insights and Forecast, 2019-2031
- 8.1. Market Analysis, Insights and Forecast - by Application
- 8.1.1. Diagnostic
- 8.1.2. Therapeutic
- 8.2. Market Analysis, Insights and Forecast - by Instrument Type
- 8.2.1. Manual
- 8.2.2. Automatic
- 8.3. Market Analysis, Insights and Forecast - by End User
- 8.3.1. Hospitals
- 8.3.2. Clinics
- 8.3.3. Other End Users
- 8.1. Market Analysis, Insights and Forecast - by Application
- 9. Rest of the World Synoptophore Market Analysis, Insights and Forecast, 2019-2031
- 9.1. Market Analysis, Insights and Forecast - by Application
- 9.1.1. Diagnostic
- 9.1.2. Therapeutic
- 9.2. Market Analysis, Insights and Forecast - by Instrument Type
- 9.2.1. Manual
- 9.2.2. Automatic
- 9.3. Market Analysis, Insights and Forecast - by End User
- 9.3.1. Hospitals
- 9.3.2. Clinics
- 9.3.3. Other End Users
- 9.1. Market Analysis, Insights and Forecast - by Application
- 10. North America Synoptophore Market Analysis, Insights and Forecast, 2019-2031
- 10.1. Market Analysis, Insights and Forecast - By Country/Sub-region
- 10.1.1 United States
- 10.1.2 Canada
- 10.1.3 Mexico
- 11. Europe Synoptophore Market Analysis, Insights and Forecast, 2019-2031
- 11.1. Market Analysis, Insights and Forecast - By Country/Sub-region
- 11.1.1 Germany
- 11.1.2 United Kingdom
- 11.1.3 France
- 11.1.4 Spain
- 11.1.5 Italy
- 11.1.6 Spain
- 11.1.7 Belgium
- 11.1.8 Netherland
- 11.1.9 Nordics
- 11.1.10 Rest of Europe
- 12. Asia Pacific Synoptophore Market Analysis, Insights and Forecast, 2019-2031
- 12.1. Market Analysis, Insights and Forecast - By Country/Sub-region
- 12.1.1 China
- 12.1.2 Japan
- 12.1.3 India
- 12.1.4 South Korea
- 12.1.5 Southeast Asia
- 12.1.6 Australia
- 12.1.7 Indonesia
- 12.1.8 Phillipes
- 12.1.9 Singapore
- 12.1.10 Thailandc
- 12.1.11 Rest of Asia Pacific
- 13. South America Synoptophore Market Analysis, Insights and Forecast, 2019-2031
- 13.1. Market Analysis, Insights and Forecast - By Country/Sub-region
- 13.1.1 Brazil
- 13.1.2 Argentina
- 13.1.3 Peru
- 13.1.4 Chile
- 13.1.5 Colombia
- 13.1.6 Ecuador
- 13.1.7 Venezuela
- 13.1.8 Rest of South America
- 14. North America Synoptophore Market Analysis, Insights and Forecast, 2019-2031
- 14.1. Market Analysis, Insights and Forecast - By Country/Sub-region
- 14.1.1 United States
- 14.1.2 Canada
- 14.1.3 Mexico
- 15. MEA Synoptophore Market Analysis, Insights and Forecast, 2019-2031
- 15.1. Market Analysis, Insights and Forecast - By Country/Sub-region
- 15.1.1 United Arab Emirates
- 15.1.2 Saudi Arabia
- 15.1.3 South Africa
- 15.1.4 Rest of Middle East and Africa
- 16. Competitive Analysis
- 16.1. Global Market Share Analysis 2024
- 16.2. Company Profiles
- 16.2.1 Dahlgren India
- 16.2.1.1. Overview
- 16.2.1.2. Products
- 16.2.1.3. SWOT Analysis
- 16.2.1.4. Recent Developments
- 16.2.1.5. Financials (Based on Availability)
- 16.2.2 APPASAMY ASSOCIATES
- 16.2.2.1. Overview
- 16.2.2.2. Products
- 16.2.2.3. SWOT Analysis
- 16.2.2.4. Recent Developments
- 16.2.2.5. Financials (Based on Availability)
- 16.2.3 66 Vision Tech Co Ltd*List Not Exhaustive
- 16.2.3.1. Overview
- 16.2.3.2. Products
- 16.2.3.3. SWOT Analysis
- 16.2.3.4. Recent Developments
- 16.2.3.5. Financials (Based on Availability)
- 16.2.4 Rumax International
- 16.2.4.1. Overview
- 16.2.4.2. Products
- 16.2.4.3. SWOT Analysis
- 16.2.4.4. Recent Developments
- 16.2.4.5. Financials (Based on Availability)
- 16.2.5 Nanjing Redsun Optical Co Ltd
- 16.2.5.1. Overview
- 16.2.5.2. Products
- 16.2.5.3. SWOT Analysis
- 16.2.5.4. Recent Developments
- 16.2.5.5. Financials (Based on Availability)
- 16.2.6 Prkamya Visions
- 16.2.6.1. Overview
- 16.2.6.2. Products
- 16.2.6.3. SWOT Analysis
- 16.2.6.4. Recent Developments
- 16.2.6.5. Financials (Based on Availability)
- 16.2.7 Gem Optical Instruments Industries
- 16.2.7.1. Overview
- 16.2.7.2. Products
- 16.2.7.3. SWOT Analysis
- 16.2.7.4. Recent Developments
- 16.2.7.5. Financials (Based on Availability)
- 16.2.8 HAAG-STREIT GROUP
- 16.2.8.1. Overview
- 16.2.8.2. Products
- 16.2.8.3. SWOT Analysis
- 16.2.8.4. Recent Developments
- 16.2.8.5. Financials (Based on Availability)
- 16.2.1 Dahlgren India
List of Figures
- Figure 1: Global Synoptophore Market Revenue Breakdown (Million, %) by Region 2024 & 2032
- Figure 2: North America Synoptophore Market Revenue (Million), by Country 2024 & 2032
- Figure 3: North America Synoptophore Market Revenue Share (%), by Country 2024 & 2032
- Figure 4: Europe Synoptophore Market Revenue (Million), by Country 2024 & 2032
- Figure 5: Europe Synoptophore Market Revenue Share (%), by Country 2024 & 2032
- Figure 6: Asia Pacific Synoptophore Market Revenue (Million), by Country 2024 & 2032
- Figure 7: Asia Pacific Synoptophore Market Revenue Share (%), by Country 2024 & 2032
- Figure 8: South America Synoptophore Market Revenue (Million), by Country 2024 & 2032
- Figure 9: South America Synoptophore Market Revenue Share (%), by Country 2024 & 2032
- Figure 10: North America Synoptophore Market Revenue (Million), by Country 2024 & 2032
- Figure 11: North America Synoptophore Market Revenue Share (%), by Country 2024 & 2032
- Figure 12: MEA Synoptophore Market Revenue (Million), by Country 2024 & 2032
- Figure 13: MEA Synoptophore Market Revenue Share (%), by Country 2024 & 2032
- Figure 14: North America Synoptophore Market Revenue (Million), by Application 2024 & 2032
- Figure 15: North America Synoptophore Market Revenue Share (%), by Application 2024 & 2032
- Figure 16: North America Synoptophore Market Revenue (Million), by Instrument Type 2024 & 2032
- Figure 17: North America Synoptophore Market Revenue Share (%), by Instrument Type 2024 & 2032
- Figure 18: North America Synoptophore Market Revenue (Million), by End User 2024 & 2032
- Figure 19: North America Synoptophore Market Revenue Share (%), by End User 2024 & 2032
- Figure 20: North America Synoptophore Market Revenue (Million), by Country 2024 & 2032
- Figure 21: North America Synoptophore Market Revenue Share (%), by Country 2024 & 2032
- Figure 22: Europe Synoptophore Market Revenue (Million), by Application 2024 & 2032
- Figure 23: Europe Synoptophore Market Revenue Share (%), by Application 2024 & 2032
- Figure 24: Europe Synoptophore Market Revenue (Million), by Instrument Type 2024 & 2032
- Figure 25: Europe Synoptophore Market Revenue Share (%), by Instrument Type 2024 & 2032
- Figure 26: Europe Synoptophore Market Revenue (Million), by End User 2024 & 2032
- Figure 27: Europe Synoptophore Market Revenue Share (%), by End User 2024 & 2032
- Figure 28: Europe Synoptophore Market Revenue (Million), by Country 2024 & 2032
- Figure 29: Europe Synoptophore Market Revenue Share (%), by Country 2024 & 2032
- Figure 30: Asia Pacific Synoptophore Market Revenue (Million), by Application 2024 & 2032
- Figure 31: Asia Pacific Synoptophore Market Revenue Share (%), by Application 2024 & 2032
- Figure 32: Asia Pacific Synoptophore Market Revenue (Million), by Instrument Type 2024 & 2032
- Figure 33: Asia Pacific Synoptophore Market Revenue Share (%), by Instrument Type 2024 & 2032
- Figure 34: Asia Pacific Synoptophore Market Revenue (Million), by End User 2024 & 2032
- Figure 35: Asia Pacific Synoptophore Market Revenue Share (%), by End User 2024 & 2032
- Figure 36: Asia Pacific Synoptophore Market Revenue (Million), by Country 2024 & 2032
- Figure 37: Asia Pacific Synoptophore Market Revenue Share (%), by Country 2024 & 2032
- Figure 38: Rest of the World Synoptophore Market Revenue (Million), by Application 2024 & 2032
- Figure 39: Rest of the World Synoptophore Market Revenue Share (%), by Application 2024 & 2032
- Figure 40: Rest of the World Synoptophore Market Revenue (Million), by Instrument Type 2024 & 2032
- Figure 41: Rest of the World Synoptophore Market Revenue Share (%), by Instrument Type 2024 & 2032
- Figure 42: Rest of the World Synoptophore Market Revenue (Million), by End User 2024 & 2032
- Figure 43: Rest of the World Synoptophore Market Revenue Share (%), by End User 2024 & 2032
- Figure 44: Rest of the World Synoptophore Market Revenue (Million), by Country 2024 & 2032
- Figure 45: Rest of the World Synoptophore Market Revenue Share (%), by Country 2024 & 2032
List of Tables
- Table 1: Global Synoptophore Market Revenue Million Forecast, by Region 2019 & 2032
- Table 2: Global Synoptophore Market Revenue Million Forecast, by Application 2019 & 2032
- Table 3: Global Synoptophore Market Revenue Million Forecast, by Instrument Type 2019 & 2032
- Table 4: Global Synoptophore Market Revenue Million Forecast, by End User 2019 & 2032
- Table 5: Global Synoptophore Market Revenue Million Forecast, by Region 2019 & 2032
- Table 6: Global Synoptophore Market Revenue Million Forecast, by Country 2019 & 2032
- Table 7: United States Synoptophore Market Revenue (Million) Forecast, by Application 2019 & 2032
- Table 8: Canada Synoptophore Market Revenue (Million) Forecast, by Application 2019 & 2032
- Table 9: Mexico Synoptophore Market Revenue (Million) Forecast, by Application 2019 & 2032
- Table 10: Global Synoptophore Market Revenue Million Forecast, by Country 2019 & 2032
- Table 11: Germany Synoptophore Market Revenue (Million) Forecast, by Application 2019 & 2032
- Table 12: United Kingdom Synoptophore Market Revenue (Million) Forecast, by Application 2019 & 2032
- Table 13: France Synoptophore Market Revenue (Million) Forecast, by Application 2019 & 2032
- Table 14: Spain Synoptophore Market Revenue (Million) Forecast, by Application 2019 & 2032
- Table 15: Italy Synoptophore Market Revenue (Million) Forecast, by Application 2019 & 2032
- Table 16: Spain Synoptophore Market Revenue (Million) Forecast, by Application 2019 & 2032
- Table 17: Belgium Synoptophore Market Revenue (Million) Forecast, by Application 2019 & 2032
- Table 18: Netherland Synoptophore Market Revenue (Million) Forecast, by Application 2019 & 2032
- Table 19: Nordics Synoptophore Market Revenue (Million) Forecast, by Application 2019 & 2032
- Table 20: Rest of Europe Synoptophore Market Revenue (Million) Forecast, by Application 2019 & 2032
- Table 21: Global Synoptophore Market Revenue Million Forecast, by Country 2019 & 2032
- Table 22: China Synoptophore Market Revenue (Million) Forecast, by Application 2019 & 2032
- Table 23: Japan Synoptophore Market Revenue (Million) Forecast, by Application 2019 & 2032
- Table 24: India Synoptophore Market Revenue (Million) Forecast, by Application 2019 & 2032
- Table 25: South Korea Synoptophore Market Revenue (Million) Forecast, by Application 2019 & 2032
- Table 26: Southeast Asia Synoptophore Market Revenue (Million) Forecast, by Application 2019 & 2032
- Table 27: Australia Synoptophore Market Revenue (Million) Forecast, by Application 2019 & 2032
- Table 28: Indonesia Synoptophore Market Revenue (Million) Forecast, by Application 2019 & 2032
- Table 29: Phillipes Synoptophore Market Revenue (Million) Forecast, by Application 2019 & 2032
- Table 30: Singapore Synoptophore Market Revenue (Million) Forecast, by Application 2019 & 2032
- Table 31: Thailandc Synoptophore Market Revenue (Million) Forecast, by Application 2019 & 2032
- Table 32: Rest of Asia Pacific Synoptophore Market Revenue (Million) Forecast, by Application 2019 & 2032
- Table 33: Global Synoptophore Market Revenue Million Forecast, by Country 2019 & 2032
- Table 34: Brazil Synoptophore Market Revenue (Million) Forecast, by Application 2019 & 2032
- Table 35: Argentina Synoptophore Market Revenue (Million) Forecast, by Application 2019 & 2032
- Table 36: Peru Synoptophore Market Revenue (Million) Forecast, by Application 2019 & 2032
- Table 37: Chile Synoptophore Market Revenue (Million) Forecast, by Application 2019 & 2032
- Table 38: Colombia Synoptophore Market Revenue (Million) Forecast, by Application 2019 & 2032
- Table 39: Ecuador Synoptophore Market Revenue (Million) Forecast, by Application 2019 & 2032
- Table 40: Venezuela Synoptophore Market Revenue (Million) Forecast, by Application 2019 & 2032
- Table 41: Rest of South America Synoptophore Market Revenue (Million) Forecast, by Application 2019 & 2032
- Table 42: Global Synoptophore Market Revenue Million Forecast, by Country 2019 & 2032
- Table 43: United States Synoptophore Market Revenue (Million) Forecast, by Application 2019 & 2032
- Table 44: Canada Synoptophore Market Revenue (Million) Forecast, by Application 2019 & 2032
- Table 45: Mexico Synoptophore Market Revenue (Million) Forecast, by Application 2019 & 2032
- Table 46: Global Synoptophore Market Revenue Million Forecast, by Country 2019 & 2032
- Table 47: United Arab Emirates Synoptophore Market Revenue (Million) Forecast, by Application 2019 & 2032
- Table 48: Saudi Arabia Synoptophore Market Revenue (Million) Forecast, by Application 2019 & 2032
- Table 49: South Africa Synoptophore Market Revenue (Million) Forecast, by Application 2019 & 2032
- Table 50: Rest of Middle East and Africa Synoptophore Market Revenue (Million) Forecast, by Application 2019 & 2032
- Table 51: Global Synoptophore Market Revenue Million Forecast, by Application 2019 & 2032
- Table 52: Global Synoptophore Market Revenue Million Forecast, by Instrument Type 2019 & 2032
- Table 53: Global Synoptophore Market Revenue Million Forecast, by End User 2019 & 2032
- Table 54: Global Synoptophore Market Revenue Million Forecast, by Country 2019 & 2032
- Table 55: United States Synoptophore Market Revenue (Million) Forecast, by Application 2019 & 2032
- Table 56: Canada Synoptophore Market Revenue (Million) Forecast, by Application 2019 & 2032
- Table 57: Mexico Synoptophore Market Revenue (Million) Forecast, by Application 2019 & 2032
- Table 58: Global Synoptophore Market Revenue Million Forecast, by Application 2019 & 2032
- Table 59: Global Synoptophore Market Revenue Million Forecast, by Instrument Type 2019 & 2032
- Table 60: Global Synoptophore Market Revenue Million Forecast, by End User 2019 & 2032
- Table 61: Global Synoptophore Market Revenue Million Forecast, by Country 2019 & 2032
- Table 62: Germany Synoptophore Market Revenue (Million) Forecast, by Application 2019 & 2032
- Table 63: United Kingdom Synoptophore Market Revenue (Million) Forecast, by Application 2019 & 2032
- Table 64: France Synoptophore Market Revenue (Million) Forecast, by Application 2019 & 2032
- Table 65: Italy Synoptophore Market Revenue (Million) Forecast, by Application 2019 & 2032
- Table 66: Spain Synoptophore Market Revenue (Million) Forecast, by Application 2019 & 2032
- Table 67: Rest of Europe Synoptophore Market Revenue (Million) Forecast, by Application 2019 & 2032
- Table 68: Global Synoptophore Market Revenue Million Forecast, by Application 2019 & 2032
- Table 69: Global Synoptophore Market Revenue Million Forecast, by Instrument Type 2019 & 2032
- Table 70: Global Synoptophore Market Revenue Million Forecast, by End User 2019 & 2032
- Table 71: Global Synoptophore Market Revenue Million Forecast, by Country 2019 & 2032
- Table 72: China Synoptophore Market Revenue (Million) Forecast, by Application 2019 & 2032
- Table 73: Japan Synoptophore Market Revenue (Million) Forecast, by Application 2019 & 2032
- Table 74: India Synoptophore Market Revenue (Million) Forecast, by Application 2019 & 2032
- Table 75: Australia Synoptophore Market Revenue (Million) Forecast, by Application 2019 & 2032
- Table 76: South Korea Synoptophore Market Revenue (Million) Forecast, by Application 2019 & 2032
- Table 77: Rest of Asia Pacific Synoptophore Market Revenue (Million) Forecast, by Application 2019 & 2032
- Table 78: Global Synoptophore Market Revenue Million Forecast, by Application 2019 & 2032
- Table 79: Global Synoptophore Market Revenue Million Forecast, by Instrument Type 2019 & 2032
- Table 80: Global Synoptophore Market Revenue Million Forecast, by End User 2019 & 2032
- Table 81: Global Synoptophore Market Revenue Million Forecast, by Country 2019 & 2032
Frequently Asked Questions
1. What is the projected Compound Annual Growth Rate (CAGR) of the Synoptophore Market?
The projected CAGR is approximately 4.00%.
2. Which companies are prominent players in the Synoptophore Market?
Key companies in the market include Dahlgren India, APPASAMY ASSOCIATES, 66 Vision Tech Co Ltd*List Not Exhaustive, Rumax International, Nanjing Redsun Optical Co Ltd, Prkamya Visions, Gem Optical Instruments Industries, HAAG-STREIT GROUP.
3. What are the main segments of the Synoptophore Market?
The market segments include Application, Instrument Type, End User.
4. Can you provide details about the market size?
The market size is estimated to be USD XX Million as of 2022.
5. What are some drivers contributing to market growth?
Increasing Incidences of Visual Acuity Disorders; Growing Awareness on the Early Diagnosis of Visual Acuity Disorder; Rising Demand for Non-invasive Procedures.
6. What are the notable trends driving market growth?
Therapeutic Application is Expected to Witness a Significant Growth Over the Forecast Period.
7. Are there any restraints impacting market growth?
High Cost of Synoptophore Device; Access to Alternative Treatments.
8. Can you provide examples of recent developments in the market?
In May 2021, Haag-Streit UK announced the launch of the Eyestar 900 in the United Kingdom. The Eyestar 900 is a swept-source OCT-based eye analyzer. The swept-source technology enables precise measurement of the entire eye and the topographic assessment of the front and back corneal surface and the anterior chamber, including the lens.
9. What pricing options are available for accessing the report?
Pricing options include single-user, multi-user, and enterprise licenses priced at USD 4750, USD 5250, and USD 8750 respectively.
10. Is the market size provided in terms of value or volume?
The market size is provided in terms of value, measured in Million.
11. Are there any specific market keywords associated with the report?
Yes, the market keyword associated with the report is "Synoptophore Market," which aids in identifying and referencing the specific market segment covered.
12. How do I determine which pricing option suits my needs best?
The pricing options vary based on user requirements and access needs. Individual users may opt for single-user licenses, while businesses requiring broader access may choose multi-user or enterprise licenses for cost-effective access to the report.
13. Are there any additional resources or data provided in the Synoptophore Market report?
While the report offers comprehensive insights, it's advisable to review the specific contents or supplementary materials provided to ascertain if additional resources or data are available.
14. How can I stay updated on further developments or reports in the Synoptophore Market?
To stay informed about further developments, trends, and reports in the Synoptophore Market, consider subscribing to industry newsletters, following relevant companies and organizations, or regularly checking reputable industry news sources and publications.
Methodology
Step 1 - Identification of Relevant Samples Size from Population Database


Step 2 - Approaches for Defining Global Market Size (Value, Volume* & Price*)

Note*: In applicable scenarios
Step 3 - Data Sources
Primary Research
- Web Analytics
- Survey Reports
- Research Institute
- Latest Research Reports
- Opinion Leaders
Secondary Research
- Annual Reports
- White Paper
- Latest Press Release
- Industry Association
- Paid Database
- Investor Presentations

Step 4 - Data Triangulation
Involves using different sources of information in order to increase the validity of a study
These sources are likely to be stakeholders in a program - participants, other researchers, program staff, other community members, and so on.
Then we put all data in single framework & apply various statistical tools to find out the dynamic on the market.
During the analysis stage, feedback from the stakeholder groups would be compared to determine areas of agreement as well as areas of divergence


