Key Insights
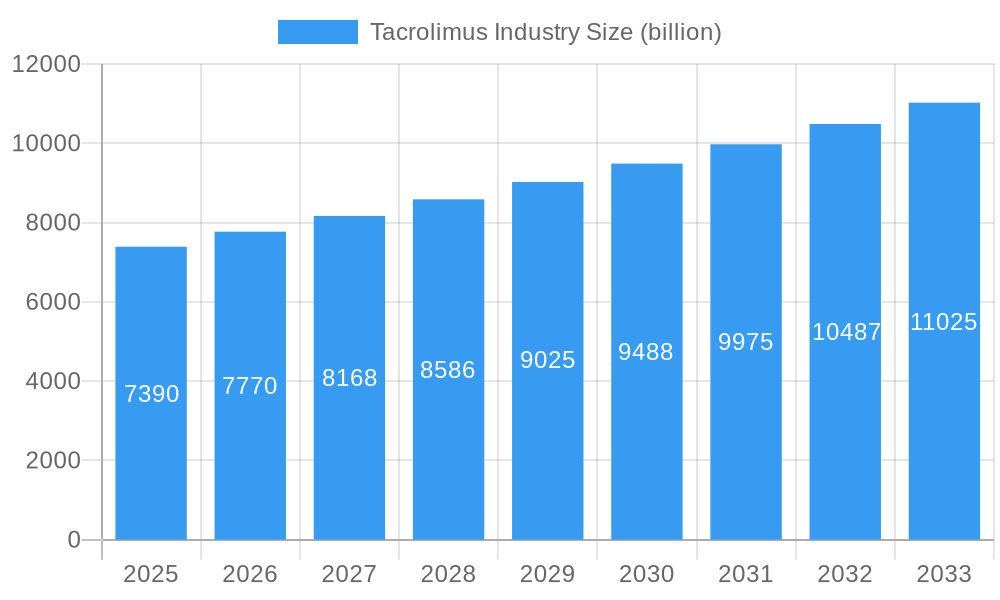
The global Tacrolimus market is poised for significant expansion, projected to reach $7.39 billion by 2025, exhibiting a robust Compound Annual Growth Rate (CAGR) of 5.15% over the forecast period. This growth is propelled by a confluence of factors, primarily the increasing prevalence of autoimmune diseases and organ transplantations, both of which necessitate the use of immunosuppressants like Tacrolimus. The rising incidence of inflammatory skin conditions such as dermatitis and eczema further fuels demand, as Tacrolimus formulations offer effective treatment options. Moreover, advancements in drug delivery systems, including the development of more bioavailable and patient-friendly formulations, are contributing to market penetration. The expanding healthcare infrastructure in emerging economies and increased patient awareness regarding treatment options are also key drivers.
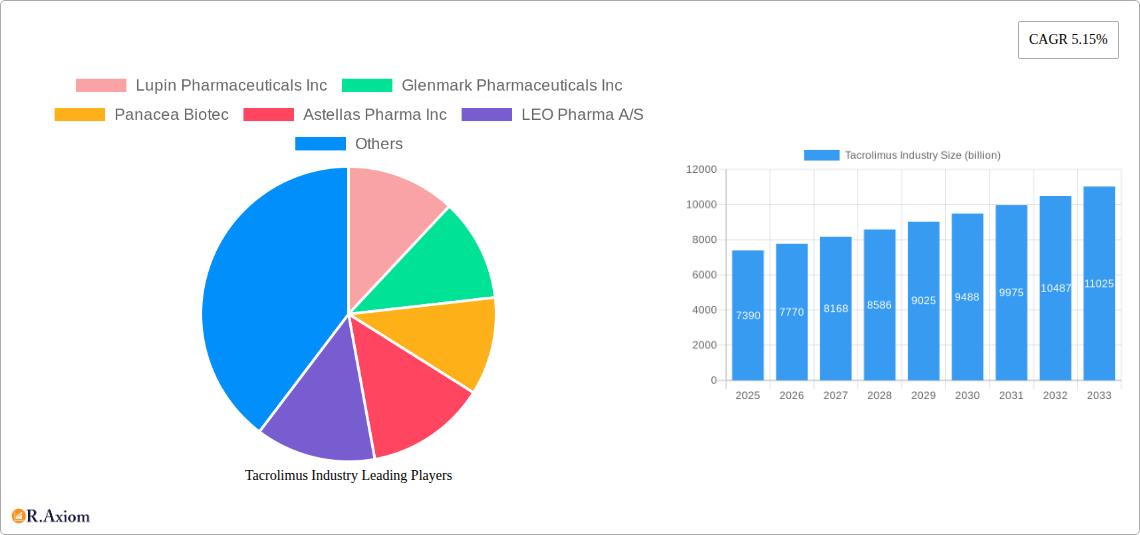
Tacrolimus Industry Market Size (In Billion)
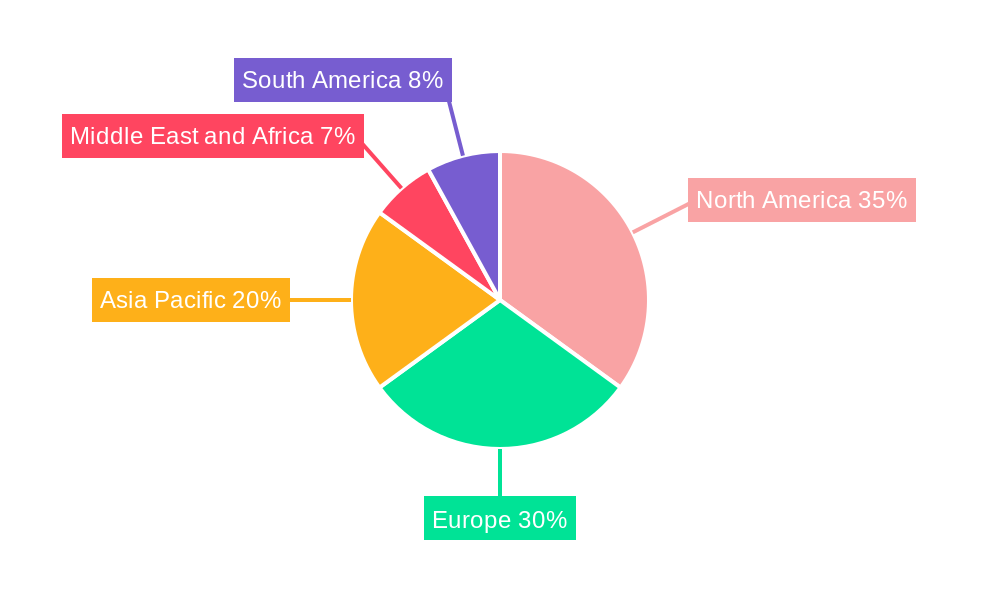
The market's trajectory is characterized by dynamic trends, with a growing emphasis on novel drug delivery methods and combination therapies to enhance efficacy and minimize side effects. The "Others" segment within product types, encompassing ointments and granules, is expected to witness substantial growth due to their convenience and targeted delivery. Geographically, North America and Europe currently dominate the market, owing to well-established healthcare systems and high adoption rates of advanced therapies. However, the Asia Pacific region presents a significant growth opportunity, driven by a large patient pool, increasing healthcare expenditure, and the presence of key pharmaceutical manufacturers. Restraints to market growth include the high cost of Tacrolimus-based treatments and the potential for adverse side effects, which can limit patient access and treatment adherence in certain demographics.
Tacrolimus Industry Company Market Share
This detailed report provides an in-depth analysis of the global Tacrolimus market, offering strategic insights and actionable intelligence for industry stakeholders. The study encompasses a comprehensive historical review (2019–2024), a detailed base year analysis (2025), and robust forecasts (2025–2033). The market is segmented by product type, application, and end-user, with key companies such as Lupin Pharmaceuticals Inc., Glenmark Pharmaceuticals Inc., Panacea Biotec, Astellas Pharma Inc., LEO Pharma A/S, GlaxoSmithKline plc, Novartis AG, Biocon Ltd, Dr Reddy's Laboratories Ltd, and Pfizer Inc. being thoroughly examined. The report leverages high-traffic keywords to maximize search visibility and engagement within the pharmaceutical and biotechnology sectors.
Tacrolimus Industry Market Concentration & Innovation
The Tacrolimus market exhibits a moderate to high level of concentration, with key players like Astellas Pharma Inc. and Pfizer Inc. holding significant market share due to their established presence and robust product portfolios. Innovation is a critical driver, with ongoing research and development focused on novel drug delivery systems, improved formulations for enhanced patient compliance, and exploring new therapeutic applications beyond immunosuppression. Regulatory frameworks, particularly stringent approvals from bodies like the FDA and EMA, play a pivotal role in market entry and product lifecycle management. The threat of product substitutes, while present in the broader immunosuppressant landscape, is relatively low for Tacrolimus in its core applications, especially post-transplant care and severe dermatitis, given its established efficacy. End-user trends are leaning towards more convenient and patient-friendly formulations, driving innovation in oral and topical preparations. Mergers and acquisitions (M&A) activities, valued in the billions, are sporadic but significant, aimed at consolidating market position, expanding geographical reach, and acquiring innovative technologies. For instance, past M&A deals in the broader immunosuppressant space have often exceeded $1 billion, signaling strategic consolidation.
- Market Share: Leading companies command a substantial portion of the global Tacrolimus market share.
- Innovation Drivers: Focus on novel formulations, enhanced bioavailability, and reduced side effects.
- Regulatory Impact: FDA and EMA approvals are critical for market access and growth.
- Product Substitutes: Limited for core immunosuppression and severe dermatological conditions.
- End-User Trends: Demand for convenient and patient-centric drug delivery methods.
- M&A Activities: Strategic acquisitions and partnerships, with deal values reaching billions, are observed for market expansion and technology acquisition.
Tacrolimus Industry Industry Trends & Insights
The Tacrolimus industry is poised for significant growth, projected to experience a Compound Annual Growth Rate (CAGR) of approximately 5% to 7% over the forecast period (2025–2033). This expansion is propelled by a confluence of factors including the rising incidence of organ transplantation globally, an increasing prevalence of autoimmune diseases, and a growing demand for effective treatments for chronic skin conditions like atopic dermatitis and eczema. Technological advancements in drug formulation and delivery systems are also contributing to market penetration, offering patients more efficacious and tolerable treatment options. The competitive landscape is characterized by both established pharmaceutical giants and emerging biopharmaceutical companies, each vying for market share through product differentiation, strategic partnerships, and robust marketing efforts. The global immunosuppression market, of which Tacrolimus is a significant component, is projected to reach well over $20 billion by 2025. Consumer preferences are increasingly shifting towards treatments that offer improved quality of life and reduced adverse effects, thereby encouraging manufacturers to invest in research for next-generation Tacrolimus formulations. The increasing awareness about the benefits of Tacrolimus in managing organ rejection and autoimmune disorders is also a key growth driver. Furthermore, the expanding healthcare infrastructure in emerging economies is opening up new avenues for market penetration, as more patients gain access to advanced medical treatments. The market penetration of generic Tacrolimus is also increasing, leading to greater affordability and wider accessibility, which in turn fuels market volume. The ongoing advancements in personalized medicine and pharmacogenomics are expected to further refine the application of Tacrolimus, optimizing treatment outcomes for individual patients. The market is also witnessing a trend towards combination therapies to enhance efficacy and manage complex conditions, creating further growth opportunities.
Dominant Markets & Segments in Tacrolimus Industry
The Immunosuppression application segment is the dominant force in the global Tacrolimus market, driven by its critical role in preventing organ rejection in transplant recipients. The Hospital end-user segment also holds a commanding position, owing to the specialized nature of transplant procedures and intensive post-operative care requiring controlled environments and professional administration of immunosuppressants. Geographically, North America consistently leads the Tacrolimus market, with the United States at the forefront, due to its advanced healthcare infrastructure, high organ transplant rates, and significant investment in pharmaceutical research and development, contributing an estimated $5 billion to the global market.
- Dominant Application: Immunosuppression, a segment valued at over $10 billion, is driven by the global increase in organ transplantation procedures and the rising prevalence of autoimmune diseases.
- Key Drivers:
- Rising organ transplant volumes globally.
- Increasing incidence of autoimmune disorders requiring immunosuppressive therapy.
- Advancements in post-transplant care protocols.
- Key Drivers:
- Dominant End User: Hospitals, contributing approximately 70% of the market revenue due to their central role in transplant surgery and critical care.
- Key Drivers:
- High concentration of transplant centers and specialized medical facilities.
- Requirement for controlled administration and monitoring of immunosuppressants.
- Significant R&D investments by hospital networks in patient outcomes.
- Key Drivers:
- Dominant Product Type: Tablets and Capsules, representing over 60% of the market share, offering convenience and ease of administration for long-term immunosuppressive therapy.
- Key Drivers:
- Patient convenience and adherence to oral medication regimens.
- Well-established efficacy and safety profiles of oral formulations.
- Availability of diverse dosages and strengths.
- Key Drivers:
- Dominant Region: North America, spearheaded by the United States, accounts for a substantial portion of the global Tacrolimus market, estimated at over 40% of the total market value.
- Key Drivers:
- High organ transplant rates per capita.
- Advanced healthcare systems and access to innovative treatments.
- Strong presence of leading pharmaceutical manufacturers and research institutions.
- Favorable reimbursement policies for organ transplantation and immunosuppressive drugs.
- Key Drivers:
Tacrolimus Industry Product Developments
Product innovation in the Tacrolimus industry focuses on enhancing patient compliance and therapeutic outcomes. Key developments include extended-release formulations for simplified dosing regimens, reducing the frequency of administration and improving adherence. Research into topical Tacrolimus for dermatological applications continues to expand, offering targeted treatment with potentially fewer systemic side effects, particularly for conditions like atopic dermatitis and eczema. Companies are also exploring novel delivery systems to improve bioavailability and efficacy, aiming to achieve better patient response rates and reduce the overall treatment burden. These advancements are crucial for maintaining competitive advantage and addressing unmet patient needs in a dynamic market.
Report Scope & Segmentation Analysis
This report segments the Tacrolimus market comprehensively across several key areas to provide granular insights. The Product Type segmentation includes Tablets and Capsules, Injections, and Others (Ointments, Granules). The Application segmentation covers Immunosuppression, Dermatitis, and Others (Vitiligo, Eczema). Finally, the End Users are categorized into Hospitals, Clinics, and Other End Users. Each segment is analyzed for its market size, growth projections, and competitive dynamics.
- Product Type:
- Tablets and Capsules: Expected to maintain its leading position due to convenience and established efficacy in long-term immunosuppression.
- Injections: Primarily used in acute post-transplant settings and for specific critical care scenarios.
- Others (Ointments, Granules): Growing segment, driven by the demand for topical treatments for dermatological conditions and specialized formulations.
- Application:
- Immunosuppression: The largest segment, driven by organ transplantation and autoimmune disease management.
- Dermatitis: A significant and growing segment, with increasing use of topical Tacrolimus for conditions like atopic dermatitis.
- Others (Vitiligo, Eczema): Emerging applications with potential for significant growth as research expands.
- End Users:
- Hospitals: Dominant end-user segment due to the prevalence of transplant procedures and critical care.
- Clinics: Growing importance, especially for the management of chronic dermatological conditions.
- Other End Users: Includes long-term care facilities and specialized treatment centers.
Key Drivers of Tacrolimus Industry Growth
Several factors are instrumental in driving the growth of the Tacrolimus industry. The increasing global incidence of organ transplantation, coupled with advancements in surgical techniques and post-transplant care, directly fuels the demand for immunosuppressants like Tacrolimus. Furthermore, the rising prevalence of autoimmune diseases and inflammatory skin conditions such as atopic dermatitis and eczema is expanding the therapeutic applications for Tacrolimus, particularly its topical formulations. Technological innovations in drug delivery systems, leading to improved patient adherence and efficacy, are also significant growth catalysts. The expansion of healthcare infrastructure and increased healthcare spending in emerging economies are broadening patient access to these critical medications. Regulatory approvals for new indications and formulations further contribute to market expansion.
Challenges in the Tacrolimus Industry Sector
Despite its growth trajectory, the Tacrolimus industry faces several challenges. The high cost of immunosuppressive therapy can be a barrier to access for a significant portion of the global population, particularly in low-income countries. Stringent regulatory hurdles and lengthy approval processes for new drug applications and formulations can impede market entry and product innovation. Intense competition from generic manufacturers, while beneficial for affordability, can put pressure on profit margins for branded products. Supply chain complexities, including the sourcing of raw materials and ensuring product integrity during distribution, also present operational challenges. Additionally, potential adverse effects associated with Tacrolimus, such as nephrotoxicity and neurotoxicity, necessitate careful patient monitoring and can influence prescribing patterns.
Emerging Opportunities in Tacrolimus Industry
The Tacrolimus industry is ripe with emerging opportunities. The development of novel drug delivery systems, such as targeted drug release and nano-formulations, promises to enhance efficacy and reduce side effects, creating a significant market advantage. The growing understanding of Tacrolimus's role in managing a wider range of autoimmune disorders and inflammatory conditions opens up new therapeutic avenues and market segments. Expansion into emerging markets with growing healthcare expenditure and increasing organ transplant rates presents a substantial growth opportunity. Furthermore, advancements in pharmacogenomics could lead to personalized Tacrolimus dosing, optimizing treatment outcomes and patient safety. The increasing focus on non-immunosuppressive applications, such as in dermatology, also presents a promising area for future growth.
Leading Players in the Tacrolimus Industry Market
- Lupin Pharmaceuticals Inc.
- Glenmark Pharmaceuticals Inc.
- Panacea Biotec
- Astellas Pharma Inc.
- LEO Pharma A/S
- GlaxoSmithKline plc
- Novartis AG
- Biocon Ltd
- Dr Reddy's Laboratories Ltd
- Pfizer Inc.
Key Developments in Tacrolimus Industry Industry
- 2023: Launch of new extended-release formulations aimed at improving patient adherence.
- 2022: Increased focus on R&D for novel topical Tacrolimus applications in dermatology.
- 2021: Several key market players reported strong sales growth driven by increased transplant procedures.
- 2020: Expansion of manufacturing capabilities to meet rising global demand.
- 2019: Strategic partnerships formed to explore combination therapies involving Tacrolimus.
Strategic Outlook for Tacrolimus Industry Market
The strategic outlook for the Tacrolimus industry remains highly positive, underpinned by robust market growth drivers and continuous innovation. The increasing demand for immunosuppressants in organ transplantation and the expanding therapeutic applications in autoimmune and dermatological conditions will continue to fuel market expansion. Strategic investments in research and development for advanced drug delivery systems and novel formulations are expected to create significant competitive advantages. Furthermore, the growing healthcare infrastructure in emerging economies and a greater emphasis on patient-centric treatments will unlock new market opportunities. Companies that can effectively navigate regulatory landscapes, address cost-related challenges, and leverage technological advancements will be well-positioned for sustained success in this vital pharmaceutical sector.
Tacrolimus Industry Segmentation
-
1. Product Type
- 1.1. Tablets and Capsules
- 1.2. Injections
- 1.3. Others (Ointments, Granules)
-
2. Application
- 2.1. Immunosuppression
- 2.2. Dermatitis
- 2.3. Others (Vitiligo, Eczema)
-
3. End Users
- 3.1. Hospitals
- 3.2. Clinics
- 3.3. Other End Users
Tacrolimus Industry Segmentation By Geography
-
1. North America
- 1.1. United States
- 1.2. Canada
- 1.3. Mexico
-
2. Europe
- 2.1. Germany
- 2.2. United Kingdom
- 2.3. France
- 2.4. Italy
- 2.5. Spain
- 2.6. Rest of Europe
-
3. Asia Pacific
- 3.1. China
- 3.2. Japan
- 3.3. India
- 3.4. Australia
- 3.5. South Korea
- 3.6. Rest of Asia Pacific
-
4. Middle East and Africa
- 4.1. GCC
- 4.2. South Africa
- 4.3. Rest of Middle East and Africa
-
5. South America
- 5.1. Brazil
- 5.2. Argentina
- 5.3. Rest of South America
Tacrolimus Industry Regional Market Share
Geographic Coverage of Tacrolimus Industry
Tacrolimus Industry REPORT HIGHLIGHTS
| Aspects | Details |
|---|---|
| Study Period | 2020-2034 |
| Base Year | 2025 |
| Estimated Year | 2026 |
| Forecast Period | 2026-2034 |
| Historical Period | 2020-2025 |
| Growth Rate | CAGR of 5.15% from 2020-2034 |
| Segmentation |
|
Table of Contents
- 1. Introduction
- 1.1. Research Scope
- 1.2. Market Segmentation
- 1.3. Research Objective
- 1.4. Definitions and Assumptions
- 2. Executive Summary
- 2.1. Market Snapshot
- 3. Market Dynamics
- 3.1. Market Drivers
- 3.2. Market Restrains
- 3.3. Market Trends
- 3.4. Market Opportunities
- 4. Market Factor Analysis
- 4.1. Porters Five Forces
- 4.1.1. Bargaining Power of Suppliers
- 4.1.2. Bargaining Power of Buyers
- 4.1.3. Threat of New Entrants
- 4.1.4. Threat of Substitutes
- 4.1.5. Competitive Rivalry
- 4.2. PESTEL analysis
- 4.3. BCG Analysis
- 4.3.1. Stars (High Growth, High Market Share)
- 4.3.2. Cash Cows (Low Growth, High Market Share)
- 4.3.3. Question Mark (High Growth, Low Market Share)
- 4.3.4. Dogs (Low Growth, Low Market Share)
- 4.4. Ansoff Matrix Analysis
- 4.5. Supply Chain Analysis
- 4.6. Regulatory Landscape
- 4.7. Current Market Potential and Opportunity Assessment (TAM–SAM–SOM Framework)
- 4.8. RAX Analyst Note
- 4.1. Porters Five Forces
- 5. Market Analysis, Insights and Forecast 2021-2033
- 5.1. Market Analysis, Insights and Forecast - by Product Type
- 5.1.1. Tablets and Capsules
- 5.1.2. Injections
- 5.1.3. Others (Ointments, Granules)
- 5.2. Market Analysis, Insights and Forecast - by Application
- 5.2.1. Immunosuppression
- 5.2.2. Dermatitis
- 5.2.3. Others (Vitiligo, Eczema)
- 5.3. Market Analysis, Insights and Forecast - by End Users
- 5.3.1. Hospitals
- 5.3.2. Clinics
- 5.3.3. Other End Users
- 5.4. Market Analysis, Insights and Forecast - by Region
- 5.4.1. North America
- 5.4.2. Europe
- 5.4.3. Asia Pacific
- 5.4.4. Middle East and Africa
- 5.4.5. South America
- 5.1. Market Analysis, Insights and Forecast - by Product Type
- 6. Global Tacrolimus Industry Analysis, Insights and Forecast, 2021-2033
- 6.1. Market Analysis, Insights and Forecast - by Product Type
- 6.1.1. Tablets and Capsules
- 6.1.2. Injections
- 6.1.3. Others (Ointments, Granules)
- 6.2. Market Analysis, Insights and Forecast - by Application
- 6.2.1. Immunosuppression
- 6.2.2. Dermatitis
- 6.2.3. Others (Vitiligo, Eczema)
- 6.3. Market Analysis, Insights and Forecast - by End Users
- 6.3.1. Hospitals
- 6.3.2. Clinics
- 6.3.3. Other End Users
- 6.1. Market Analysis, Insights and Forecast - by Product Type
- 7. North America Tacrolimus Industry Analysis, Insights and Forecast, 2020-2032
- 7.1. Market Analysis, Insights and Forecast - by Product Type
- 7.1.1. Tablets and Capsules
- 7.1.2. Injections
- 7.1.3. Others (Ointments, Granules)
- 7.2. Market Analysis, Insights and Forecast - by Application
- 7.2.1. Immunosuppression
- 7.2.2. Dermatitis
- 7.2.3. Others (Vitiligo, Eczema)
- 7.3. Market Analysis, Insights and Forecast - by End Users
- 7.3.1. Hospitals
- 7.3.2. Clinics
- 7.3.3. Other End Users
- 7.1. Market Analysis, Insights and Forecast - by Product Type
- 8. Europe Tacrolimus Industry Analysis, Insights and Forecast, 2020-2032
- 8.1. Market Analysis, Insights and Forecast - by Product Type
- 8.1.1. Tablets and Capsules
- 8.1.2. Injections
- 8.1.3. Others (Ointments, Granules)
- 8.2. Market Analysis, Insights and Forecast - by Application
- 8.2.1. Immunosuppression
- 8.2.2. Dermatitis
- 8.2.3. Others (Vitiligo, Eczema)
- 8.3. Market Analysis, Insights and Forecast - by End Users
- 8.3.1. Hospitals
- 8.3.2. Clinics
- 8.3.3. Other End Users
- 8.1. Market Analysis, Insights and Forecast - by Product Type
- 9. Asia Pacific Tacrolimus Industry Analysis, Insights and Forecast, 2020-2032
- 9.1. Market Analysis, Insights and Forecast - by Product Type
- 9.1.1. Tablets and Capsules
- 9.1.2. Injections
- 9.1.3. Others (Ointments, Granules)
- 9.2. Market Analysis, Insights and Forecast - by Application
- 9.2.1. Immunosuppression
- 9.2.2. Dermatitis
- 9.2.3. Others (Vitiligo, Eczema)
- 9.3. Market Analysis, Insights and Forecast - by End Users
- 9.3.1. Hospitals
- 9.3.2. Clinics
- 9.3.3. Other End Users
- 9.1. Market Analysis, Insights and Forecast - by Product Type
- 10. Middle East and Africa Tacrolimus Industry Analysis, Insights and Forecast, 2020-2032
- 10.1. Market Analysis, Insights and Forecast - by Product Type
- 10.1.1. Tablets and Capsules
- 10.1.2. Injections
- 10.1.3. Others (Ointments, Granules)
- 10.2. Market Analysis, Insights and Forecast - by Application
- 10.2.1. Immunosuppression
- 10.2.2. Dermatitis
- 10.2.3. Others (Vitiligo, Eczema)
- 10.3. Market Analysis, Insights and Forecast - by End Users
- 10.3.1. Hospitals
- 10.3.2. Clinics
- 10.3.3. Other End Users
- 10.1. Market Analysis, Insights and Forecast - by Product Type
- 11. South America Tacrolimus Industry Analysis, Insights and Forecast, 2020-2032
- 11.1. Market Analysis, Insights and Forecast - by Product Type
- 11.1.1. Tablets and Capsules
- 11.1.2. Injections
- 11.1.3. Others (Ointments, Granules)
- 11.2. Market Analysis, Insights and Forecast - by Application
- 11.2.1. Immunosuppression
- 11.2.2. Dermatitis
- 11.2.3. Others (Vitiligo, Eczema)
- 11.3. Market Analysis, Insights and Forecast - by End Users
- 11.3.1. Hospitals
- 11.3.2. Clinics
- 11.3.3. Other End Users
- 11.1. Market Analysis, Insights and Forecast - by Product Type
- 12. Competitive Analysis
- 12.1. Company Profiles
- 12.1.1 Lupin Pharmaceuticals Inc
- 12.1.1.1. Company Overview
- 12.1.1.2. Products
- 12.1.1.3. Company Financials
- 12.1.1.4. SWOT Analysis
- 12.1.2 Glenmark Pharmaceuticals Inc
- 12.1.2.1. Company Overview
- 12.1.2.2. Products
- 12.1.2.3. Company Financials
- 12.1.2.4. SWOT Analysis
- 12.1.3 Panacea Biotec
- 12.1.3.1. Company Overview
- 12.1.3.2. Products
- 12.1.3.3. Company Financials
- 12.1.3.4. SWOT Analysis
- 12.1.4 Astellas Pharma Inc
- 12.1.4.1. Company Overview
- 12.1.4.2. Products
- 12.1.4.3. Company Financials
- 12.1.4.4. SWOT Analysis
- 12.1.5 LEO Pharma A/S
- 12.1.5.1. Company Overview
- 12.1.5.2. Products
- 12.1.5.3. Company Financials
- 12.1.5.4. SWOT Analysis
- 12.1.6 GlaxoSmithKline plc
- 12.1.6.1. Company Overview
- 12.1.6.2. Products
- 12.1.6.3. Company Financials
- 12.1.6.4. SWOT Analysis
- 12.1.7 Novartis AG
- 12.1.7.1. Company Overview
- 12.1.7.2. Products
- 12.1.7.3. Company Financials
- 12.1.7.4. SWOT Analysis
- 12.1.8 Biocon Ltd
- 12.1.8.1. Company Overview
- 12.1.8.2. Products
- 12.1.8.3. Company Financials
- 12.1.8.4. SWOT Analysis
- 12.1.9 Dr Reddy's Laboratories Ltd
- 12.1.9.1. Company Overview
- 12.1.9.2. Products
- 12.1.9.3. Company Financials
- 12.1.9.4. SWOT Analysis
- 12.1.10 Pfizer Inc
- 12.1.10.1. Company Overview
- 12.1.10.2. Products
- 12.1.10.3. Company Financials
- 12.1.10.4. SWOT Analysis
- 12.1.1 Lupin Pharmaceuticals Inc
- 12.2. Market Entropy
- 12.2.1 Company's Key Areas Served
- 12.2.2 Recent Developments
- 12.3. Company Market Share Analysis 2025
- 12.3.1 Top 5 Companies Market Share Analysis
- 12.3.2 Top 3 Companies Market Share Analysis
- 12.4. List of Potential Customers
- 13. Research Methodology
List of Figures
- Figure 1: Global Tacrolimus Industry Revenue Breakdown (billion, %) by Region 2025 & 2033
- Figure 2: Global Tacrolimus Industry Volume Breakdown (K Unit, %) by Region 2025 & 2033
- Figure 3: North America Tacrolimus Industry Revenue (billion), by Product Type 2025 & 2033
- Figure 4: North America Tacrolimus Industry Volume (K Unit), by Product Type 2025 & 2033
- Figure 5: North America Tacrolimus Industry Revenue Share (%), by Product Type 2025 & 2033
- Figure 6: North America Tacrolimus Industry Volume Share (%), by Product Type 2025 & 2033
- Figure 7: North America Tacrolimus Industry Revenue (billion), by Application 2025 & 2033
- Figure 8: North America Tacrolimus Industry Volume (K Unit), by Application 2025 & 2033
- Figure 9: North America Tacrolimus Industry Revenue Share (%), by Application 2025 & 2033
- Figure 10: North America Tacrolimus Industry Volume Share (%), by Application 2025 & 2033
- Figure 11: North America Tacrolimus Industry Revenue (billion), by End Users 2025 & 2033
- Figure 12: North America Tacrolimus Industry Volume (K Unit), by End Users 2025 & 2033
- Figure 13: North America Tacrolimus Industry Revenue Share (%), by End Users 2025 & 2033
- Figure 14: North America Tacrolimus Industry Volume Share (%), by End Users 2025 & 2033
- Figure 15: North America Tacrolimus Industry Revenue (billion), by Country 2025 & 2033
- Figure 16: North America Tacrolimus Industry Volume (K Unit), by Country 2025 & 2033
- Figure 17: North America Tacrolimus Industry Revenue Share (%), by Country 2025 & 2033
- Figure 18: North America Tacrolimus Industry Volume Share (%), by Country 2025 & 2033
- Figure 19: Europe Tacrolimus Industry Revenue (billion), by Product Type 2025 & 2033
- Figure 20: Europe Tacrolimus Industry Volume (K Unit), by Product Type 2025 & 2033
- Figure 21: Europe Tacrolimus Industry Revenue Share (%), by Product Type 2025 & 2033
- Figure 22: Europe Tacrolimus Industry Volume Share (%), by Product Type 2025 & 2033
- Figure 23: Europe Tacrolimus Industry Revenue (billion), by Application 2025 & 2033
- Figure 24: Europe Tacrolimus Industry Volume (K Unit), by Application 2025 & 2033
- Figure 25: Europe Tacrolimus Industry Revenue Share (%), by Application 2025 & 2033
- Figure 26: Europe Tacrolimus Industry Volume Share (%), by Application 2025 & 2033
- Figure 27: Europe Tacrolimus Industry Revenue (billion), by End Users 2025 & 2033
- Figure 28: Europe Tacrolimus Industry Volume (K Unit), by End Users 2025 & 2033
- Figure 29: Europe Tacrolimus Industry Revenue Share (%), by End Users 2025 & 2033
- Figure 30: Europe Tacrolimus Industry Volume Share (%), by End Users 2025 & 2033
- Figure 31: Europe Tacrolimus Industry Revenue (billion), by Country 2025 & 2033
- Figure 32: Europe Tacrolimus Industry Volume (K Unit), by Country 2025 & 2033
- Figure 33: Europe Tacrolimus Industry Revenue Share (%), by Country 2025 & 2033
- Figure 34: Europe Tacrolimus Industry Volume Share (%), by Country 2025 & 2033
- Figure 35: Asia Pacific Tacrolimus Industry Revenue (billion), by Product Type 2025 & 2033
- Figure 36: Asia Pacific Tacrolimus Industry Volume (K Unit), by Product Type 2025 & 2033
- Figure 37: Asia Pacific Tacrolimus Industry Revenue Share (%), by Product Type 2025 & 2033
- Figure 38: Asia Pacific Tacrolimus Industry Volume Share (%), by Product Type 2025 & 2033
- Figure 39: Asia Pacific Tacrolimus Industry Revenue (billion), by Application 2025 & 2033
- Figure 40: Asia Pacific Tacrolimus Industry Volume (K Unit), by Application 2025 & 2033
- Figure 41: Asia Pacific Tacrolimus Industry Revenue Share (%), by Application 2025 & 2033
- Figure 42: Asia Pacific Tacrolimus Industry Volume Share (%), by Application 2025 & 2033
- Figure 43: Asia Pacific Tacrolimus Industry Revenue (billion), by End Users 2025 & 2033
- Figure 44: Asia Pacific Tacrolimus Industry Volume (K Unit), by End Users 2025 & 2033
- Figure 45: Asia Pacific Tacrolimus Industry Revenue Share (%), by End Users 2025 & 2033
- Figure 46: Asia Pacific Tacrolimus Industry Volume Share (%), by End Users 2025 & 2033
- Figure 47: Asia Pacific Tacrolimus Industry Revenue (billion), by Country 2025 & 2033
- Figure 48: Asia Pacific Tacrolimus Industry Volume (K Unit), by Country 2025 & 2033
- Figure 49: Asia Pacific Tacrolimus Industry Revenue Share (%), by Country 2025 & 2033
- Figure 50: Asia Pacific Tacrolimus Industry Volume Share (%), by Country 2025 & 2033
- Figure 51: Middle East and Africa Tacrolimus Industry Revenue (billion), by Product Type 2025 & 2033
- Figure 52: Middle East and Africa Tacrolimus Industry Volume (K Unit), by Product Type 2025 & 2033
- Figure 53: Middle East and Africa Tacrolimus Industry Revenue Share (%), by Product Type 2025 & 2033
- Figure 54: Middle East and Africa Tacrolimus Industry Volume Share (%), by Product Type 2025 & 2033
- Figure 55: Middle East and Africa Tacrolimus Industry Revenue (billion), by Application 2025 & 2033
- Figure 56: Middle East and Africa Tacrolimus Industry Volume (K Unit), by Application 2025 & 2033
- Figure 57: Middle East and Africa Tacrolimus Industry Revenue Share (%), by Application 2025 & 2033
- Figure 58: Middle East and Africa Tacrolimus Industry Volume Share (%), by Application 2025 & 2033
- Figure 59: Middle East and Africa Tacrolimus Industry Revenue (billion), by End Users 2025 & 2033
- Figure 60: Middle East and Africa Tacrolimus Industry Volume (K Unit), by End Users 2025 & 2033
- Figure 61: Middle East and Africa Tacrolimus Industry Revenue Share (%), by End Users 2025 & 2033
- Figure 62: Middle East and Africa Tacrolimus Industry Volume Share (%), by End Users 2025 & 2033
- Figure 63: Middle East and Africa Tacrolimus Industry Revenue (billion), by Country 2025 & 2033
- Figure 64: Middle East and Africa Tacrolimus Industry Volume (K Unit), by Country 2025 & 2033
- Figure 65: Middle East and Africa Tacrolimus Industry Revenue Share (%), by Country 2025 & 2033
- Figure 66: Middle East and Africa Tacrolimus Industry Volume Share (%), by Country 2025 & 2033
- Figure 67: South America Tacrolimus Industry Revenue (billion), by Product Type 2025 & 2033
- Figure 68: South America Tacrolimus Industry Volume (K Unit), by Product Type 2025 & 2033
- Figure 69: South America Tacrolimus Industry Revenue Share (%), by Product Type 2025 & 2033
- Figure 70: South America Tacrolimus Industry Volume Share (%), by Product Type 2025 & 2033
- Figure 71: South America Tacrolimus Industry Revenue (billion), by Application 2025 & 2033
- Figure 72: South America Tacrolimus Industry Volume (K Unit), by Application 2025 & 2033
- Figure 73: South America Tacrolimus Industry Revenue Share (%), by Application 2025 & 2033
- Figure 74: South America Tacrolimus Industry Volume Share (%), by Application 2025 & 2033
- Figure 75: South America Tacrolimus Industry Revenue (billion), by End Users 2025 & 2033
- Figure 76: South America Tacrolimus Industry Volume (K Unit), by End Users 2025 & 2033
- Figure 77: South America Tacrolimus Industry Revenue Share (%), by End Users 2025 & 2033
- Figure 78: South America Tacrolimus Industry Volume Share (%), by End Users 2025 & 2033
- Figure 79: South America Tacrolimus Industry Revenue (billion), by Country 2025 & 2033
- Figure 80: South America Tacrolimus Industry Volume (K Unit), by Country 2025 & 2033
- Figure 81: South America Tacrolimus Industry Revenue Share (%), by Country 2025 & 2033
- Figure 82: South America Tacrolimus Industry Volume Share (%), by Country 2025 & 2033
List of Tables
- Table 1: Global Tacrolimus Industry Revenue billion Forecast, by Product Type 2020 & 2033
- Table 2: Global Tacrolimus Industry Volume K Unit Forecast, by Product Type 2020 & 2033
- Table 3: Global Tacrolimus Industry Revenue billion Forecast, by Application 2020 & 2033
- Table 4: Global Tacrolimus Industry Volume K Unit Forecast, by Application 2020 & 2033
- Table 5: Global Tacrolimus Industry Revenue billion Forecast, by End Users 2020 & 2033
- Table 6: Global Tacrolimus Industry Volume K Unit Forecast, by End Users 2020 & 2033
- Table 7: Global Tacrolimus Industry Revenue billion Forecast, by Region 2020 & 2033
- Table 8: Global Tacrolimus Industry Volume K Unit Forecast, by Region 2020 & 2033
- Table 9: Global Tacrolimus Industry Revenue billion Forecast, by Product Type 2020 & 2033
- Table 10: Global Tacrolimus Industry Volume K Unit Forecast, by Product Type 2020 & 2033
- Table 11: Global Tacrolimus Industry Revenue billion Forecast, by Application 2020 & 2033
- Table 12: Global Tacrolimus Industry Volume K Unit Forecast, by Application 2020 & 2033
- Table 13: Global Tacrolimus Industry Revenue billion Forecast, by End Users 2020 & 2033
- Table 14: Global Tacrolimus Industry Volume K Unit Forecast, by End Users 2020 & 2033
- Table 15: Global Tacrolimus Industry Revenue billion Forecast, by Country 2020 & 2033
- Table 16: Global Tacrolimus Industry Volume K Unit Forecast, by Country 2020 & 2033
- Table 17: United States Tacrolimus Industry Revenue (billion) Forecast, by Application 2020 & 2033
- Table 18: United States Tacrolimus Industry Volume (K Unit) Forecast, by Application 2020 & 2033
- Table 19: Canada Tacrolimus Industry Revenue (billion) Forecast, by Application 2020 & 2033
- Table 20: Canada Tacrolimus Industry Volume (K Unit) Forecast, by Application 2020 & 2033
- Table 21: Mexico Tacrolimus Industry Revenue (billion) Forecast, by Application 2020 & 2033
- Table 22: Mexico Tacrolimus Industry Volume (K Unit) Forecast, by Application 2020 & 2033
- Table 23: Global Tacrolimus Industry Revenue billion Forecast, by Product Type 2020 & 2033
- Table 24: Global Tacrolimus Industry Volume K Unit Forecast, by Product Type 2020 & 2033
- Table 25: Global Tacrolimus Industry Revenue billion Forecast, by Application 2020 & 2033
- Table 26: Global Tacrolimus Industry Volume K Unit Forecast, by Application 2020 & 2033
- Table 27: Global Tacrolimus Industry Revenue billion Forecast, by End Users 2020 & 2033
- Table 28: Global Tacrolimus Industry Volume K Unit Forecast, by End Users 2020 & 2033
- Table 29: Global Tacrolimus Industry Revenue billion Forecast, by Country 2020 & 2033
- Table 30: Global Tacrolimus Industry Volume K Unit Forecast, by Country 2020 & 2033
- Table 31: Germany Tacrolimus Industry Revenue (billion) Forecast, by Application 2020 & 2033
- Table 32: Germany Tacrolimus Industry Volume (K Unit) Forecast, by Application 2020 & 2033
- Table 33: United Kingdom Tacrolimus Industry Revenue (billion) Forecast, by Application 2020 & 2033
- Table 34: United Kingdom Tacrolimus Industry Volume (K Unit) Forecast, by Application 2020 & 2033
- Table 35: France Tacrolimus Industry Revenue (billion) Forecast, by Application 2020 & 2033
- Table 36: France Tacrolimus Industry Volume (K Unit) Forecast, by Application 2020 & 2033
- Table 37: Italy Tacrolimus Industry Revenue (billion) Forecast, by Application 2020 & 2033
- Table 38: Italy Tacrolimus Industry Volume (K Unit) Forecast, by Application 2020 & 2033
- Table 39: Spain Tacrolimus Industry Revenue (billion) Forecast, by Application 2020 & 2033
- Table 40: Spain Tacrolimus Industry Volume (K Unit) Forecast, by Application 2020 & 2033
- Table 41: Rest of Europe Tacrolimus Industry Revenue (billion) Forecast, by Application 2020 & 2033
- Table 42: Rest of Europe Tacrolimus Industry Volume (K Unit) Forecast, by Application 2020 & 2033
- Table 43: Global Tacrolimus Industry Revenue billion Forecast, by Product Type 2020 & 2033
- Table 44: Global Tacrolimus Industry Volume K Unit Forecast, by Product Type 2020 & 2033
- Table 45: Global Tacrolimus Industry Revenue billion Forecast, by Application 2020 & 2033
- Table 46: Global Tacrolimus Industry Volume K Unit Forecast, by Application 2020 & 2033
- Table 47: Global Tacrolimus Industry Revenue billion Forecast, by End Users 2020 & 2033
- Table 48: Global Tacrolimus Industry Volume K Unit Forecast, by End Users 2020 & 2033
- Table 49: Global Tacrolimus Industry Revenue billion Forecast, by Country 2020 & 2033
- Table 50: Global Tacrolimus Industry Volume K Unit Forecast, by Country 2020 & 2033
- Table 51: China Tacrolimus Industry Revenue (billion) Forecast, by Application 2020 & 2033
- Table 52: China Tacrolimus Industry Volume (K Unit) Forecast, by Application 2020 & 2033
- Table 53: Japan Tacrolimus Industry Revenue (billion) Forecast, by Application 2020 & 2033
- Table 54: Japan Tacrolimus Industry Volume (K Unit) Forecast, by Application 2020 & 2033
- Table 55: India Tacrolimus Industry Revenue (billion) Forecast, by Application 2020 & 2033
- Table 56: India Tacrolimus Industry Volume (K Unit) Forecast, by Application 2020 & 2033
- Table 57: Australia Tacrolimus Industry Revenue (billion) Forecast, by Application 2020 & 2033
- Table 58: Australia Tacrolimus Industry Volume (K Unit) Forecast, by Application 2020 & 2033
- Table 59: South Korea Tacrolimus Industry Revenue (billion) Forecast, by Application 2020 & 2033
- Table 60: South Korea Tacrolimus Industry Volume (K Unit) Forecast, by Application 2020 & 2033
- Table 61: Rest of Asia Pacific Tacrolimus Industry Revenue (billion) Forecast, by Application 2020 & 2033
- Table 62: Rest of Asia Pacific Tacrolimus Industry Volume (K Unit) Forecast, by Application 2020 & 2033
- Table 63: Global Tacrolimus Industry Revenue billion Forecast, by Product Type 2020 & 2033
- Table 64: Global Tacrolimus Industry Volume K Unit Forecast, by Product Type 2020 & 2033
- Table 65: Global Tacrolimus Industry Revenue billion Forecast, by Application 2020 & 2033
- Table 66: Global Tacrolimus Industry Volume K Unit Forecast, by Application 2020 & 2033
- Table 67: Global Tacrolimus Industry Revenue billion Forecast, by End Users 2020 & 2033
- Table 68: Global Tacrolimus Industry Volume K Unit Forecast, by End Users 2020 & 2033
- Table 69: Global Tacrolimus Industry Revenue billion Forecast, by Country 2020 & 2033
- Table 70: Global Tacrolimus Industry Volume K Unit Forecast, by Country 2020 & 2033
- Table 71: GCC Tacrolimus Industry Revenue (billion) Forecast, by Application 2020 & 2033
- Table 72: GCC Tacrolimus Industry Volume (K Unit) Forecast, by Application 2020 & 2033
- Table 73: South Africa Tacrolimus Industry Revenue (billion) Forecast, by Application 2020 & 2033
- Table 74: South Africa Tacrolimus Industry Volume (K Unit) Forecast, by Application 2020 & 2033
- Table 75: Rest of Middle East and Africa Tacrolimus Industry Revenue (billion) Forecast, by Application 2020 & 2033
- Table 76: Rest of Middle East and Africa Tacrolimus Industry Volume (K Unit) Forecast, by Application 2020 & 2033
- Table 77: Global Tacrolimus Industry Revenue billion Forecast, by Product Type 2020 & 2033
- Table 78: Global Tacrolimus Industry Volume K Unit Forecast, by Product Type 2020 & 2033
- Table 79: Global Tacrolimus Industry Revenue billion Forecast, by Application 2020 & 2033
- Table 80: Global Tacrolimus Industry Volume K Unit Forecast, by Application 2020 & 2033
- Table 81: Global Tacrolimus Industry Revenue billion Forecast, by End Users 2020 & 2033
- Table 82: Global Tacrolimus Industry Volume K Unit Forecast, by End Users 2020 & 2033
- Table 83: Global Tacrolimus Industry Revenue billion Forecast, by Country 2020 & 2033
- Table 84: Global Tacrolimus Industry Volume K Unit Forecast, by Country 2020 & 2033
- Table 85: Brazil Tacrolimus Industry Revenue (billion) Forecast, by Application 2020 & 2033
- Table 86: Brazil Tacrolimus Industry Volume (K Unit) Forecast, by Application 2020 & 2033
- Table 87: Argentina Tacrolimus Industry Revenue (billion) Forecast, by Application 2020 & 2033
- Table 88: Argentina Tacrolimus Industry Volume (K Unit) Forecast, by Application 2020 & 2033
- Table 89: Rest of South America Tacrolimus Industry Revenue (billion) Forecast, by Application 2020 & 2033
- Table 90: Rest of South America Tacrolimus Industry Volume (K Unit) Forecast, by Application 2020 & 2033
Frequently Asked Questions
1. What is the projected Compound Annual Growth Rate (CAGR) of the Tacrolimus Industry?
The projected CAGR is approximately 5.15%.
2. Which companies are prominent players in the Tacrolimus Industry?
Key companies in the market include Lupin Pharmaceuticals Inc, Glenmark Pharmaceuticals Inc, Panacea Biotec, Astellas Pharma Inc, LEO Pharma A/S, GlaxoSmithKline plc, Novartis AG, Biocon Ltd, Dr Reddy's Laboratories Ltd, Pfizer Inc.
3. What are the main segments of the Tacrolimus Industry?
The market segments include Product Type, Application, End Users.
4. Can you provide details about the market size?
The market size is estimated to be USD 7.39 billion as of 2022.
5. What are some drivers contributing to market growth?
Increasing Number of Transplants Worldwide; Surge in Research and Development Activities for Immunosuppression.
6. What are the notable trends driving market growth?
Immunosuppression Segment is Expected to Witness Growth over the Forecast Period.
7. Are there any restraints impacting market growth?
Side Effects of the Tacrolimus.
8. Can you provide examples of recent developments in the market?
N/A
9. What pricing options are available for accessing the report?
Pricing options include single-user, multi-user, and enterprise licenses priced at USD 4750, USD 5250, and USD 8750 respectively.
10. Is the market size provided in terms of value or volume?
The market size is provided in terms of value, measured in billion and volume, measured in K Unit.
11. Are there any specific market keywords associated with the report?
Yes, the market keyword associated with the report is "Tacrolimus Industry," which aids in identifying and referencing the specific market segment covered.
12. How do I determine which pricing option suits my needs best?
The pricing options vary based on user requirements and access needs. Individual users may opt for single-user licenses, while businesses requiring broader access may choose multi-user or enterprise licenses for cost-effective access to the report.
13. Are there any additional resources or data provided in the Tacrolimus Industry report?
While the report offers comprehensive insights, it's advisable to review the specific contents or supplementary materials provided to ascertain if additional resources or data are available.
14. How can I stay updated on further developments or reports in the Tacrolimus Industry?
To stay informed about further developments, trends, and reports in the Tacrolimus Industry, consider subscribing to industry newsletters, following relevant companies and organizations, or regularly checking reputable industry news sources and publications.
Methodology
Step 1 - Identification of Relevant Samples Size from Population Database


Step 2 - Approaches for Defining Global Market Size (Value, Volume* & Price*)

Note*: In applicable scenarios
Step 3 - Data Sources
Primary Research
- Web Analytics
- Survey Reports
- Research Institute
- Latest Research Reports
- Opinion Leaders
Secondary Research
- Annual Reports
- White Paper
- Latest Press Release
- Industry Association
- Paid Database
- Investor Presentations

Step 4 - Data Triangulation
Involves using different sources of information in order to increase the validity of a study
These sources are likely to be stakeholders in a program - participants, other researchers, program staff, other community members, and so on.
Then we put all data in single framework & apply various statistical tools to find out the dynamic on the market.
During the analysis stage, feedback from the stakeholder groups would be compared to determine areas of agreement as well as areas of divergence

