
Key Insights
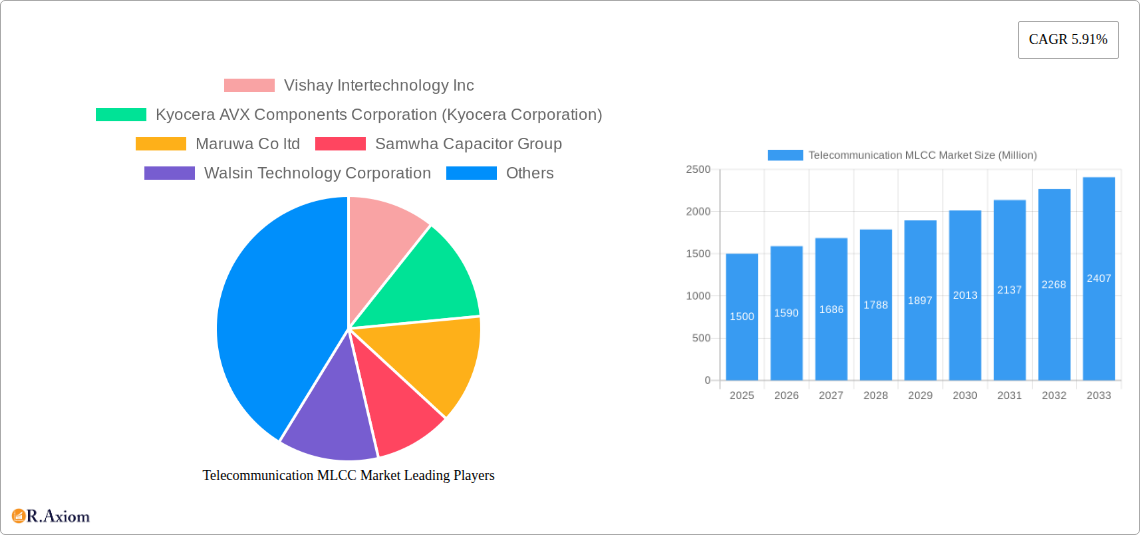
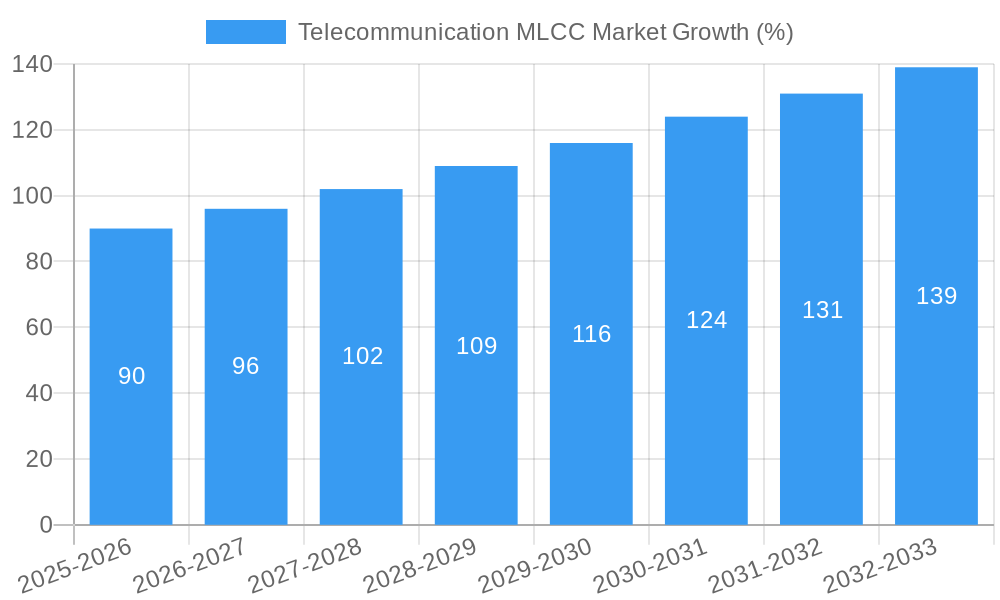
The telecommunication MLCC (Multilayer Ceramic Capacitor) market is experiencing robust growth, driven by the escalating demand for high-speed data transmission and the proliferation of 5G infrastructure. The market's Compound Annual Growth Rate (CAGR) of 5.91% from 2019 to 2024 indicates a significant upward trajectory. This growth is fueled by the increasing integration of advanced telecommunication technologies in various devices, including base stations, set-top boxes, and other communication equipment. Miniaturization trends in electronics and the demand for improved signal quality are key drivers. Segmentation reveals that larger case sizes (1 and above) are likely to hold a larger market share due to their higher capacitance capabilities, essential for managing power surges and filtering noise in high-performance telecommunication applications. The higher voltage segments (50V to 200V and above 200V) are also expected to see significant growth, reflecting the increasing power requirements of modern telecommunication systems. Competition is fierce among major players such as Vishay Intertechnology, Kyocera AVX, Murata Manufacturing, and TDK Corporation, driving innovation and price competitiveness. Challenges include supply chain constraints and potential fluctuations in raw material prices, requiring manufacturers to implement robust supply chain management strategies.
The forecast period (2025-2033) anticipates continued growth, propelled by the ongoing expansion of 5G networks globally and the increasing adoption of Internet of Things (IoT) devices. The market's segmentation by capacitance (10µF to 100µF being a significant segment) and dielectric type reflects the diverse technical requirements across different applications. The prevalence of Class 1 and Class 2 dielectric types suggests a market catering to a wide spectrum of performance needs. Despite potential restraints, the long-term outlook for the telecommunication MLCC market remains positive, with substantial growth expected across different segments and geographical regions. Continued technological advancements in MLCC technology will be crucial in addressing the increasing demand for higher performance and miniaturization in the telecommunications sector.
This in-depth report provides a comprehensive analysis of the Telecommunication MLCC market, offering valuable insights for stakeholders, investors, and industry professionals. The report covers market size, segmentation, growth drivers, challenges, key players, and future trends, utilizing data from the historical period (2019-2024), base year (2025), and forecast period (2025-2033). The study period encompasses 2019-2033.
Telecommunication MLCC Market Concentration & Innovation
The Telecommunication MLCC market exhibits a moderately concentrated landscape, with a few major players holding significant market share. Market concentration is influenced by factors such as technological advancements, economies of scale, and stringent regulatory frameworks. The estimated market share of the top five players in 2025 is xx%, reflecting the dominance of established companies.
- Innovation Drivers: Miniaturization, improved capacitance, and enhanced dielectric properties are key innovation drivers. The increasing demand for higher frequency and power applications fuels continuous advancements in MLCC technology.
- Regulatory Frameworks: Global and regional regulations concerning electronic waste and material sourcing influence the market's sustainability and manufacturing practices. Compliance costs and environmental regulations impact profitability and strategic decision-making.
- Product Substitutes: While MLCCs dominate, alternative technologies like film capacitors exist, although with limitations in certain applications. This competitive pressure necessitates continuous innovation to maintain market share.
- End-User Trends: The proliferation of 5G networks, the rise of IoT devices, and the increasing adoption of high-speed data transmission are significantly boosting the demand for advanced MLCCs. This trend drives innovation in miniaturization and performance.
- M&A Activities: The Telecommunication MLCC market has witnessed several mergers and acquisitions in recent years, with deal values exceeding xx Million in the last five years. These activities aim to consolidate market share, expand product portfolios, and gain access to new technologies and markets. Examples include (but are not limited to) strategic partnerships focusing on material sourcing or technological cross-licensing.
Telecommunication MLCC Market Industry Trends & Insights
The Telecommunication MLCC market is experiencing robust growth, driven by factors such as the escalating demand for high-performance electronic devices and the expansion of 5G infrastructure globally. The market is projected to witness a compound annual growth rate (CAGR) of xx% during the forecast period (2025-2033). Market penetration is steadily increasing across various telecommunication applications.
The increasing adoption of smartphones, wearable devices, and high-speed data networks significantly contributes to market growth. Technological advancements such as miniaturization, increased capacitance density, and improved dielectric materials are driving demand for advanced MLCCs. Furthermore, the rising trend of incorporating MLCCs in electric and autonomous vehicles provides a significant expansion opportunity. Competitive dynamics are characterized by innovation, strategic alliances, and continuous improvements in product specifications. Price competition remains a crucial factor, however, differentiation through superior performance and technological advancements mitigates this.
Dominant Markets & Segments in Telecommunication MLCC Market
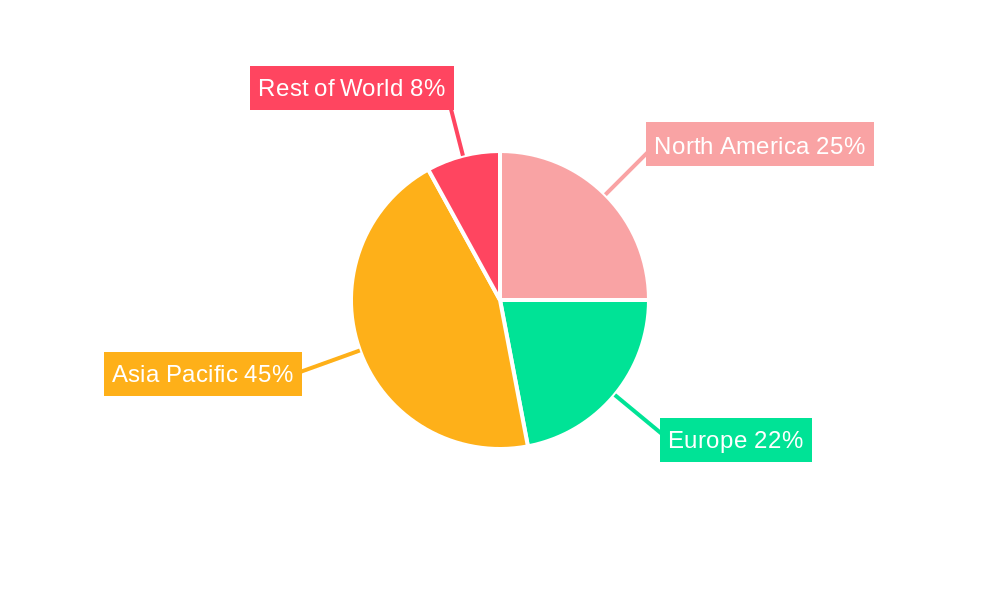
The Asia-Pacific region is the dominant market for Telecommunication MLCCs, driven by strong economic growth, a large consumer base, and a robust electronics manufacturing sector. China, Japan, and South Korea are key countries contributing to this dominance.
Key Drivers of Regional Dominance:
- Rapid growth in the electronics and telecommunication sectors.
- Favorable government policies and investments in infrastructure development.
- Presence of major MLCC manufacturers and established supply chains.
- High adoption rates of smartphones, IoT devices, and 5G networks.
Dominant Segments:
- Case Size: 0603 and 0805 sizes dominate due to their suitability for miniaturized devices. The "Others" segment represents specialized applications with unique size requirements.
- Voltage: The less than 50V segment holds the largest share, catering to the majority of consumer electronics applications. Higher voltage segments are essential for power applications in base stations and industrial settings.
- Capacitance: The Less than 10 μF segment dominates due to its applicability across a broader range of electronic devices. Higher capacitance values are in demand for power supply and energy storage applications.
- Dielectric Type: Specific dielectric types (Class I and Class II) dominate based on application-specific performance requirements. Class I are preferred for high-frequency applications, while Class II are suited for applications demanding high capacitance density.
- Device Type: Base Stations contribute to a significant portion of the market due to their high MLCC density. Set Top Boxes represents a substantial segment that will continue to grow with increasing streaming video consumption.
Telecommunication MLCC Market Product Developments
Recent product developments focus on miniaturization, enhanced performance, and specialized functionalities. Companies are introducing MLCCs with higher capacitance densities, improved temperature stability, and reduced ESR (Equivalent Series Resistance). These advancements cater to the demands of increasingly sophisticated applications in 5G, IoT, and other high-frequency communication technologies. Moreover, specialized MLCCs designed for DC-blocking and high-frequency applications are gaining traction.
Report Scope & Segmentation Analysis
This report segments the Telecommunication MLCC market by case size (01005, 0201, 0402, 0603, 0805, Others), voltage (Less than 50V, 50V to 200V, More than 200V), capacitance (Less than 10 μF, 10 μF to 100 μF, More than 100 μF), dielectric type (Class I, Class II), and device type (Base Stations, Set Top Boxes, Others). Each segment’s growth projection, market size, and competitive landscape are analyzed in detail. The market size for each segment is projected to expand significantly during the forecast period.
Key Drivers of Telecommunication MLCC Market Growth
The Telecommunication MLCC market growth is propelled by the explosive growth of the telecommunications industry, especially 5G deployment, the proliferation of IoT devices, and increasing demand for high-performance electronics with miniaturization requirements. Technological advancements, such as improved dielectric materials and enhanced manufacturing processes, further fuel market expansion. Government incentives and investments in infrastructure projects further stimulate market growth.
Challenges in the Telecommunication MLCC Market Sector
The Telecommunication MLCC market faces challenges such as fluctuating raw material prices, supply chain disruptions, and intense competition. Stringent environmental regulations also pose a challenge, impacting manufacturing processes and costs. The need for continuous innovation to address evolving technical specifications and user demand presents a substantial ongoing challenge. Geopolitical instability can also influence material sourcing and pricing.
Emerging Opportunities in Telecommunication MLCC Market
Emerging opportunities include the expansion of 5G and IoT deployments, the growth of electric vehicles, and the increasing demand for advanced MLCCs in high-frequency applications. Development of energy-efficient MLCCs and environmentally friendly manufacturing techniques represents a key market opportunity. Expansion into new geographical markets with underdeveloped telecommunication infrastructure also offers significant potential.
Leading Players in the Telecommunication MLCC Market Market
- Vishay Intertechnology Inc
- Kyocera AVX Components Corporation (Kyocera Corporation)
- Murata Manufacturing Co Ltd
- TDK Corporation
- Taiyo Yuden Co Ltd
- Yageo Corporation
- Würth Elektronik GmbH & Co KG
- Samsung Electro-Mechanics
- Walsin Technology Corporation
- Samwha Capacitor Group
- Maruwa Co ltd
- Nippon Chemi-Con Corporation
Key Developments in Telecommunication MLCC Market Industry
- June 2023: Introduction of NTS/NTF series SMD type MLCCs by [Company Name - needs to be specified] with 25-500 Vdc voltage rating and 0.010-47µF capacitance, targeting on-board power supplies and voltage regulators.
- March 2023: Murata developed GRM series MLCCs in 0201inch/0603M package with 10µF capacitance, ideal for smartphone handsets, portable equipment, and IoT hardware.
- October 2022: Vishay introduced a new line of surface-mount MLCCs for DC-blocking applications in RF, Bluetooth, 5G, and high-frequency data links, improving AC signal transmission with less than 0.5 dB insertion loss.
Strategic Outlook for Telecommunication MLCC Market Market
The Telecommunication MLCC market is poised for continued growth, driven by technological advancements, expanding applications, and the ongoing digital transformation. Focus on miniaturization, enhanced performance, and specialized functionalities will be critical for success. Companies must adapt to changing market dynamics through strategic partnerships, investment in R&D, and focus on sustainable manufacturing practices to capture market share and unlock long-term growth opportunities. The market is expected to show sustained growth throughout the forecast period.
Telecommunication MLCC Market Segmentation
-
1. Device Type
- 1.1. Base Stations
- 1.2. Set Top Boxes
- 1.3. Others
-
2. Case Size
- 2.1. 0 201
- 2.2. 0 402
- 2.3. 0 603
- 2.4. 1 005
- 2.5. 1 210
- 2.6. Others
-
3. Voltage
- 3.1. 50V to 200V
- 3.2. Less than 50V
- 3.3. More than 200V
-
4. Capacitance
- 4.1. 10 μF to 100 μF
- 4.2. Less than 10 μF
- 4.3. More than 100 μF
-
5. Dielectric Type
- 5.1. Class 1
- 5.2. Class 2
Telecommunication MLCC Market Segmentation By Geography
-
1. North America
- 1.1. United States
- 1.2. Canada
- 1.3. Mexico
-
2. South America
- 2.1. Brazil
- 2.2. Argentina
- 2.3. Rest of South America
-
3. Europe
- 3.1. United Kingdom
- 3.2. Germany
- 3.3. France
- 3.4. Italy
- 3.5. Spain
- 3.6. Russia
- 3.7. Benelux
- 3.8. Nordics
- 3.9. Rest of Europe
-
4. Middle East & Africa
- 4.1. Turkey
- 4.2. Israel
- 4.3. GCC
- 4.4. North Africa
- 4.5. South Africa
- 4.6. Rest of Middle East & Africa
-
5. Asia Pacific
- 5.1. China
- 5.2. India
- 5.3. Japan
- 5.4. South Korea
- 5.5. ASEAN
- 5.6. Oceania
- 5.7. Rest of Asia Pacific
Telecommunication MLCC Market REPORT HIGHLIGHTS
| Aspects | Details |
|---|---|
| Study Period | 2019-2033 |
| Base Year | 2024 |
| Estimated Year | 2025 |
| Forecast Period | 2025-2033 |
| Historical Period | 2019-2024 |
| Growth Rate | CAGR of 5.91% from 2019-2033 |
| Segmentation |
|
Table of Contents
- 1. Introduction
- 1.1. Research Scope
- 1.2. Market Segmentation
- 1.3. Research Methodology
- 1.4. Definitions and Assumptions
- 2. Executive Summary
- 2.1. Introduction
- 3. Market Dynamics
- 3.1. Introduction
- 3.2. Market Drivers
- 3.2.1. Rise in the Applications of Semiconductors; Advancement in Technology Such as Magnetron Sputtering Technology
- 3.3. Market Restrains
- 3.3.1. Rise of Alternative Technologies Such as Thermal Evaporation
- 3.4. Market Trends
- 3.4.1. OTHER KEY INDUSTRY TRENDS COVERED IN THE REPORT
- 4. Market Factor Analysis
- 4.1. Porters Five Forces
- 4.2. Supply/Value Chain
- 4.3. PESTEL analysis
- 4.4. Market Entropy
- 4.5. Patent/Trademark Analysis
- 5. Global Telecommunication MLCC Market Analysis, Insights and Forecast, 2019-2031
- 5.1. Market Analysis, Insights and Forecast - by Device Type
- 5.1.1. Base Stations
- 5.1.2. Set Top Boxes
- 5.1.3. Others
- 5.2. Market Analysis, Insights and Forecast - by Case Size
- 5.2.1. 0 201
- 5.2.2. 0 402
- 5.2.3. 0 603
- 5.2.4. 1 005
- 5.2.5. 1 210
- 5.2.6. Others
- 5.3. Market Analysis, Insights and Forecast - by Voltage
- 5.3.1. 50V to 200V
- 5.3.2. Less than 50V
- 5.3.3. More than 200V
- 5.4. Market Analysis, Insights and Forecast - by Capacitance
- 5.4.1. 10 μF to 100 μF
- 5.4.2. Less than 10 μF
- 5.4.3. More than 100 μF
- 5.5. Market Analysis, Insights and Forecast - by Dielectric Type
- 5.5.1. Class 1
- 5.5.2. Class 2
- 5.6. Market Analysis, Insights and Forecast - by Region
- 5.6.1. North America
- 5.6.2. South America
- 5.6.3. Europe
- 5.6.4. Middle East & Africa
- 5.6.5. Asia Pacific
- 5.1. Market Analysis, Insights and Forecast - by Device Type
- 6. North America Telecommunication MLCC Market Analysis, Insights and Forecast, 2019-2031
- 6.1. Market Analysis, Insights and Forecast - by Device Type
- 6.1.1. Base Stations
- 6.1.2. Set Top Boxes
- 6.1.3. Others
- 6.2. Market Analysis, Insights and Forecast - by Case Size
- 6.2.1. 0 201
- 6.2.2. 0 402
- 6.2.3. 0 603
- 6.2.4. 1 005
- 6.2.5. 1 210
- 6.2.6. Others
- 6.3. Market Analysis, Insights and Forecast - by Voltage
- 6.3.1. 50V to 200V
- 6.3.2. Less than 50V
- 6.3.3. More than 200V
- 6.4. Market Analysis, Insights and Forecast - by Capacitance
- 6.4.1. 10 μF to 100 μF
- 6.4.2. Less than 10 μF
- 6.4.3. More than 100 μF
- 6.5. Market Analysis, Insights and Forecast - by Dielectric Type
- 6.5.1. Class 1
- 6.5.2. Class 2
- 6.1. Market Analysis, Insights and Forecast - by Device Type
- 7. South America Telecommunication MLCC Market Analysis, Insights and Forecast, 2019-2031
- 7.1. Market Analysis, Insights and Forecast - by Device Type
- 7.1.1. Base Stations
- 7.1.2. Set Top Boxes
- 7.1.3. Others
- 7.2. Market Analysis, Insights and Forecast - by Case Size
- 7.2.1. 0 201
- 7.2.2. 0 402
- 7.2.3. 0 603
- 7.2.4. 1 005
- 7.2.5. 1 210
- 7.2.6. Others
- 7.3. Market Analysis, Insights and Forecast - by Voltage
- 7.3.1. 50V to 200V
- 7.3.2. Less than 50V
- 7.3.3. More than 200V
- 7.4. Market Analysis, Insights and Forecast - by Capacitance
- 7.4.1. 10 μF to 100 μF
- 7.4.2. Less than 10 μF
- 7.4.3. More than 100 μF
- 7.5. Market Analysis, Insights and Forecast - by Dielectric Type
- 7.5.1. Class 1
- 7.5.2. Class 2
- 7.1. Market Analysis, Insights and Forecast - by Device Type
- 8. Europe Telecommunication MLCC Market Analysis, Insights and Forecast, 2019-2031
- 8.1. Market Analysis, Insights and Forecast - by Device Type
- 8.1.1. Base Stations
- 8.1.2. Set Top Boxes
- 8.1.3. Others
- 8.2. Market Analysis, Insights and Forecast - by Case Size
- 8.2.1. 0 201
- 8.2.2. 0 402
- 8.2.3. 0 603
- 8.2.4. 1 005
- 8.2.5. 1 210
- 8.2.6. Others
- 8.3. Market Analysis, Insights and Forecast - by Voltage
- 8.3.1. 50V to 200V
- 8.3.2. Less than 50V
- 8.3.3. More than 200V
- 8.4. Market Analysis, Insights and Forecast - by Capacitance
- 8.4.1. 10 μF to 100 μF
- 8.4.2. Less than 10 μF
- 8.4.3. More than 100 μF
- 8.5. Market Analysis, Insights and Forecast - by Dielectric Type
- 8.5.1. Class 1
- 8.5.2. Class 2
- 8.1. Market Analysis, Insights and Forecast - by Device Type
- 9. Middle East & Africa Telecommunication MLCC Market Analysis, Insights and Forecast, 2019-2031
- 9.1. Market Analysis, Insights and Forecast - by Device Type
- 9.1.1. Base Stations
- 9.1.2. Set Top Boxes
- 9.1.3. Others
- 9.2. Market Analysis, Insights and Forecast - by Case Size
- 9.2.1. 0 201
- 9.2.2. 0 402
- 9.2.3. 0 603
- 9.2.4. 1 005
- 9.2.5. 1 210
- 9.2.6. Others
- 9.3. Market Analysis, Insights and Forecast - by Voltage
- 9.3.1. 50V to 200V
- 9.3.2. Less than 50V
- 9.3.3. More than 200V
- 9.4. Market Analysis, Insights and Forecast - by Capacitance
- 9.4.1. 10 μF to 100 μF
- 9.4.2. Less than 10 μF
- 9.4.3. More than 100 μF
- 9.5. Market Analysis, Insights and Forecast - by Dielectric Type
- 9.5.1. Class 1
- 9.5.2. Class 2
- 9.1. Market Analysis, Insights and Forecast - by Device Type
- 10. Asia Pacific Telecommunication MLCC Market Analysis, Insights and Forecast, 2019-2031
- 10.1. Market Analysis, Insights and Forecast - by Device Type
- 10.1.1. Base Stations
- 10.1.2. Set Top Boxes
- 10.1.3. Others
- 10.2. Market Analysis, Insights and Forecast - by Case Size
- 10.2.1. 0 201
- 10.2.2. 0 402
- 10.2.3. 0 603
- 10.2.4. 1 005
- 10.2.5. 1 210
- 10.2.6. Others
- 10.3. Market Analysis, Insights and Forecast - by Voltage
- 10.3.1. 50V to 200V
- 10.3.2. Less than 50V
- 10.3.3. More than 200V
- 10.4. Market Analysis, Insights and Forecast - by Capacitance
- 10.4.1. 10 μF to 100 μF
- 10.4.2. Less than 10 μF
- 10.4.3. More than 100 μF
- 10.5. Market Analysis, Insights and Forecast - by Dielectric Type
- 10.5.1. Class 1
- 10.5.2. Class 2
- 10.1. Market Analysis, Insights and Forecast - by Device Type
- 11. Competitive Analysis
- 11.1. Global Market Share Analysis 2024
- 11.2. Company Profiles
- 11.2.1 Vishay Intertechnology Inc
- 11.2.1.1. Overview
- 11.2.1.2. Products
- 11.2.1.3. SWOT Analysis
- 11.2.1.4. Recent Developments
- 11.2.1.5. Financials (Based on Availability)
- 11.2.2 Kyocera AVX Components Corporation (Kyocera Corporation)
- 11.2.2.1. Overview
- 11.2.2.2. Products
- 11.2.2.3. SWOT Analysis
- 11.2.2.4. Recent Developments
- 11.2.2.5. Financials (Based on Availability)
- 11.2.3 Maruwa Co ltd
- 11.2.3.1. Overview
- 11.2.3.2. Products
- 11.2.3.3. SWOT Analysis
- 11.2.3.4. Recent Developments
- 11.2.3.5. Financials (Based on Availability)
- 11.2.4 Samwha Capacitor Group
- 11.2.4.1. Overview
- 11.2.4.2. Products
- 11.2.4.3. SWOT Analysis
- 11.2.4.4. Recent Developments
- 11.2.4.5. Financials (Based on Availability)
- 11.2.5 Walsin Technology Corporation
- 11.2.5.1. Overview
- 11.2.5.2. Products
- 11.2.5.3. SWOT Analysis
- 11.2.5.4. Recent Developments
- 11.2.5.5. Financials (Based on Availability)
- 11.2.6 Samsung Electro-Mechanics
- 11.2.6.1. Overview
- 11.2.6.2. Products
- 11.2.6.3. SWOT Analysis
- 11.2.6.4. Recent Developments
- 11.2.6.5. Financials (Based on Availability)
- 11.2.7 Würth Elektronik GmbH & Co KG
- 11.2.7.1. Overview
- 11.2.7.2. Products
- 11.2.7.3. SWOT Analysis
- 11.2.7.4. Recent Developments
- 11.2.7.5. Financials (Based on Availability)
- 11.2.8 Yageo Corporatio
- 11.2.8.1. Overview
- 11.2.8.2. Products
- 11.2.8.3. SWOT Analysis
- 11.2.8.4. Recent Developments
- 11.2.8.5. Financials (Based on Availability)
- 11.2.9 Taiyo Yuden Co Ltd
- 11.2.9.1. Overview
- 11.2.9.2. Products
- 11.2.9.3. SWOT Analysis
- 11.2.9.4. Recent Developments
- 11.2.9.5. Financials (Based on Availability)
- 11.2.10 TDK Corporation
- 11.2.10.1. Overview
- 11.2.10.2. Products
- 11.2.10.3. SWOT Analysis
- 11.2.10.4. Recent Developments
- 11.2.10.5. Financials (Based on Availability)
- 11.2.11 Murata Manufacturing Co Ltd
- 11.2.11.1. Overview
- 11.2.11.2. Products
- 11.2.11.3. SWOT Analysis
- 11.2.11.4. Recent Developments
- 11.2.11.5. Financials (Based on Availability)
- 11.2.12 Nippon Chemi-Con Corporation
- 11.2.12.1. Overview
- 11.2.12.2. Products
- 11.2.12.3. SWOT Analysis
- 11.2.12.4. Recent Developments
- 11.2.12.5. Financials (Based on Availability)
- 11.2.1 Vishay Intertechnology Inc
List of Figures
- Figure 1: Global Telecommunication MLCC Market Revenue Breakdown (Million, %) by Region 2024 & 2032
- Figure 2: North America Telecommunication MLCC Market Revenue (Million), by Device Type 2024 & 2032
- Figure 3: North America Telecommunication MLCC Market Revenue Share (%), by Device Type 2024 & 2032
- Figure 4: North America Telecommunication MLCC Market Revenue (Million), by Case Size 2024 & 2032
- Figure 5: North America Telecommunication MLCC Market Revenue Share (%), by Case Size 2024 & 2032
- Figure 6: North America Telecommunication MLCC Market Revenue (Million), by Voltage 2024 & 2032
- Figure 7: North America Telecommunication MLCC Market Revenue Share (%), by Voltage 2024 & 2032
- Figure 8: North America Telecommunication MLCC Market Revenue (Million), by Capacitance 2024 & 2032
- Figure 9: North America Telecommunication MLCC Market Revenue Share (%), by Capacitance 2024 & 2032
- Figure 10: North America Telecommunication MLCC Market Revenue (Million), by Dielectric Type 2024 & 2032
- Figure 11: North America Telecommunication MLCC Market Revenue Share (%), by Dielectric Type 2024 & 2032
- Figure 12: North America Telecommunication MLCC Market Revenue (Million), by Country 2024 & 2032
- Figure 13: North America Telecommunication MLCC Market Revenue Share (%), by Country 2024 & 2032
- Figure 14: South America Telecommunication MLCC Market Revenue (Million), by Device Type 2024 & 2032
- Figure 15: South America Telecommunication MLCC Market Revenue Share (%), by Device Type 2024 & 2032
- Figure 16: South America Telecommunication MLCC Market Revenue (Million), by Case Size 2024 & 2032
- Figure 17: South America Telecommunication MLCC Market Revenue Share (%), by Case Size 2024 & 2032
- Figure 18: South America Telecommunication MLCC Market Revenue (Million), by Voltage 2024 & 2032
- Figure 19: South America Telecommunication MLCC Market Revenue Share (%), by Voltage 2024 & 2032
- Figure 20: South America Telecommunication MLCC Market Revenue (Million), by Capacitance 2024 & 2032
- Figure 21: South America Telecommunication MLCC Market Revenue Share (%), by Capacitance 2024 & 2032
- Figure 22: South America Telecommunication MLCC Market Revenue (Million), by Dielectric Type 2024 & 2032
- Figure 23: South America Telecommunication MLCC Market Revenue Share (%), by Dielectric Type 2024 & 2032
- Figure 24: South America Telecommunication MLCC Market Revenue (Million), by Country 2024 & 2032
- Figure 25: South America Telecommunication MLCC Market Revenue Share (%), by Country 2024 & 2032
- Figure 26: Europe Telecommunication MLCC Market Revenue (Million), by Device Type 2024 & 2032
- Figure 27: Europe Telecommunication MLCC Market Revenue Share (%), by Device Type 2024 & 2032
- Figure 28: Europe Telecommunication MLCC Market Revenue (Million), by Case Size 2024 & 2032
- Figure 29: Europe Telecommunication MLCC Market Revenue Share (%), by Case Size 2024 & 2032
- Figure 30: Europe Telecommunication MLCC Market Revenue (Million), by Voltage 2024 & 2032
- Figure 31: Europe Telecommunication MLCC Market Revenue Share (%), by Voltage 2024 & 2032
- Figure 32: Europe Telecommunication MLCC Market Revenue (Million), by Capacitance 2024 & 2032
- Figure 33: Europe Telecommunication MLCC Market Revenue Share (%), by Capacitance 2024 & 2032
- Figure 34: Europe Telecommunication MLCC Market Revenue (Million), by Dielectric Type 2024 & 2032
- Figure 35: Europe Telecommunication MLCC Market Revenue Share (%), by Dielectric Type 2024 & 2032
- Figure 36: Europe Telecommunication MLCC Market Revenue (Million), by Country 2024 & 2032
- Figure 37: Europe Telecommunication MLCC Market Revenue Share (%), by Country 2024 & 2032
- Figure 38: Middle East & Africa Telecommunication MLCC Market Revenue (Million), by Device Type 2024 & 2032
- Figure 39: Middle East & Africa Telecommunication MLCC Market Revenue Share (%), by Device Type 2024 & 2032
- Figure 40: Middle East & Africa Telecommunication MLCC Market Revenue (Million), by Case Size 2024 & 2032
- Figure 41: Middle East & Africa Telecommunication MLCC Market Revenue Share (%), by Case Size 2024 & 2032
- Figure 42: Middle East & Africa Telecommunication MLCC Market Revenue (Million), by Voltage 2024 & 2032
- Figure 43: Middle East & Africa Telecommunication MLCC Market Revenue Share (%), by Voltage 2024 & 2032
- Figure 44: Middle East & Africa Telecommunication MLCC Market Revenue (Million), by Capacitance 2024 & 2032
- Figure 45: Middle East & Africa Telecommunication MLCC Market Revenue Share (%), by Capacitance 2024 & 2032
- Figure 46: Middle East & Africa Telecommunication MLCC Market Revenue (Million), by Dielectric Type 2024 & 2032
- Figure 47: Middle East & Africa Telecommunication MLCC Market Revenue Share (%), by Dielectric Type 2024 & 2032
- Figure 48: Middle East & Africa Telecommunication MLCC Market Revenue (Million), by Country 2024 & 2032
- Figure 49: Middle East & Africa Telecommunication MLCC Market Revenue Share (%), by Country 2024 & 2032
- Figure 50: Asia Pacific Telecommunication MLCC Market Revenue (Million), by Device Type 2024 & 2032
- Figure 51: Asia Pacific Telecommunication MLCC Market Revenue Share (%), by Device Type 2024 & 2032
- Figure 52: Asia Pacific Telecommunication MLCC Market Revenue (Million), by Case Size 2024 & 2032
- Figure 53: Asia Pacific Telecommunication MLCC Market Revenue Share (%), by Case Size 2024 & 2032
- Figure 54: Asia Pacific Telecommunication MLCC Market Revenue (Million), by Voltage 2024 & 2032
- Figure 55: Asia Pacific Telecommunication MLCC Market Revenue Share (%), by Voltage 2024 & 2032
- Figure 56: Asia Pacific Telecommunication MLCC Market Revenue (Million), by Capacitance 2024 & 2032
- Figure 57: Asia Pacific Telecommunication MLCC Market Revenue Share (%), by Capacitance 2024 & 2032
- Figure 58: Asia Pacific Telecommunication MLCC Market Revenue (Million), by Dielectric Type 2024 & 2032
- Figure 59: Asia Pacific Telecommunication MLCC Market Revenue Share (%), by Dielectric Type 2024 & 2032
- Figure 60: Asia Pacific Telecommunication MLCC Market Revenue (Million), by Country 2024 & 2032
- Figure 61: Asia Pacific Telecommunication MLCC Market Revenue Share (%), by Country 2024 & 2032
List of Tables
- Table 1: Global Telecommunication MLCC Market Revenue Million Forecast, by Region 2019 & 2032
- Table 2: Global Telecommunication MLCC Market Revenue Million Forecast, by Device Type 2019 & 2032
- Table 3: Global Telecommunication MLCC Market Revenue Million Forecast, by Case Size 2019 & 2032
- Table 4: Global Telecommunication MLCC Market Revenue Million Forecast, by Voltage 2019 & 2032
- Table 5: Global Telecommunication MLCC Market Revenue Million Forecast, by Capacitance 2019 & 2032
- Table 6: Global Telecommunication MLCC Market Revenue Million Forecast, by Dielectric Type 2019 & 2032
- Table 7: Global Telecommunication MLCC Market Revenue Million Forecast, by Region 2019 & 2032
- Table 8: Global Telecommunication MLCC Market Revenue Million Forecast, by Device Type 2019 & 2032
- Table 9: Global Telecommunication MLCC Market Revenue Million Forecast, by Case Size 2019 & 2032
- Table 10: Global Telecommunication MLCC Market Revenue Million Forecast, by Voltage 2019 & 2032
- Table 11: Global Telecommunication MLCC Market Revenue Million Forecast, by Capacitance 2019 & 2032
- Table 12: Global Telecommunication MLCC Market Revenue Million Forecast, by Dielectric Type 2019 & 2032
- Table 13: Global Telecommunication MLCC Market Revenue Million Forecast, by Country 2019 & 2032
- Table 14: United States Telecommunication MLCC Market Revenue (Million) Forecast, by Application 2019 & 2032
- Table 15: Canada Telecommunication MLCC Market Revenue (Million) Forecast, by Application 2019 & 2032
- Table 16: Mexico Telecommunication MLCC Market Revenue (Million) Forecast, by Application 2019 & 2032
- Table 17: Global Telecommunication MLCC Market Revenue Million Forecast, by Device Type 2019 & 2032
- Table 18: Global Telecommunication MLCC Market Revenue Million Forecast, by Case Size 2019 & 2032
- Table 19: Global Telecommunication MLCC Market Revenue Million Forecast, by Voltage 2019 & 2032
- Table 20: Global Telecommunication MLCC Market Revenue Million Forecast, by Capacitance 2019 & 2032
- Table 21: Global Telecommunication MLCC Market Revenue Million Forecast, by Dielectric Type 2019 & 2032
- Table 22: Global Telecommunication MLCC Market Revenue Million Forecast, by Country 2019 & 2032
- Table 23: Brazil Telecommunication MLCC Market Revenue (Million) Forecast, by Application 2019 & 2032
- Table 24: Argentina Telecommunication MLCC Market Revenue (Million) Forecast, by Application 2019 & 2032
- Table 25: Rest of South America Telecommunication MLCC Market Revenue (Million) Forecast, by Application 2019 & 2032
- Table 26: Global Telecommunication MLCC Market Revenue Million Forecast, by Device Type 2019 & 2032
- Table 27: Global Telecommunication MLCC Market Revenue Million Forecast, by Case Size 2019 & 2032
- Table 28: Global Telecommunication MLCC Market Revenue Million Forecast, by Voltage 2019 & 2032
- Table 29: Global Telecommunication MLCC Market Revenue Million Forecast, by Capacitance 2019 & 2032
- Table 30: Global Telecommunication MLCC Market Revenue Million Forecast, by Dielectric Type 2019 & 2032
- Table 31: Global Telecommunication MLCC Market Revenue Million Forecast, by Country 2019 & 2032
- Table 32: United Kingdom Telecommunication MLCC Market Revenue (Million) Forecast, by Application 2019 & 2032
- Table 33: Germany Telecommunication MLCC Market Revenue (Million) Forecast, by Application 2019 & 2032
- Table 34: France Telecommunication MLCC Market Revenue (Million) Forecast, by Application 2019 & 2032
- Table 35: Italy Telecommunication MLCC Market Revenue (Million) Forecast, by Application 2019 & 2032
- Table 36: Spain Telecommunication MLCC Market Revenue (Million) Forecast, by Application 2019 & 2032
- Table 37: Russia Telecommunication MLCC Market Revenue (Million) Forecast, by Application 2019 & 2032
- Table 38: Benelux Telecommunication MLCC Market Revenue (Million) Forecast, by Application 2019 & 2032
- Table 39: Nordics Telecommunication MLCC Market Revenue (Million) Forecast, by Application 2019 & 2032
- Table 40: Rest of Europe Telecommunication MLCC Market Revenue (Million) Forecast, by Application 2019 & 2032
- Table 41: Global Telecommunication MLCC Market Revenue Million Forecast, by Device Type 2019 & 2032
- Table 42: Global Telecommunication MLCC Market Revenue Million Forecast, by Case Size 2019 & 2032
- Table 43: Global Telecommunication MLCC Market Revenue Million Forecast, by Voltage 2019 & 2032
- Table 44: Global Telecommunication MLCC Market Revenue Million Forecast, by Capacitance 2019 & 2032
- Table 45: Global Telecommunication MLCC Market Revenue Million Forecast, by Dielectric Type 2019 & 2032
- Table 46: Global Telecommunication MLCC Market Revenue Million Forecast, by Country 2019 & 2032
- Table 47: Turkey Telecommunication MLCC Market Revenue (Million) Forecast, by Application 2019 & 2032
- Table 48: Israel Telecommunication MLCC Market Revenue (Million) Forecast, by Application 2019 & 2032
- Table 49: GCC Telecommunication MLCC Market Revenue (Million) Forecast, by Application 2019 & 2032
- Table 50: North Africa Telecommunication MLCC Market Revenue (Million) Forecast, by Application 2019 & 2032
- Table 51: South Africa Telecommunication MLCC Market Revenue (Million) Forecast, by Application 2019 & 2032
- Table 52: Rest of Middle East & Africa Telecommunication MLCC Market Revenue (Million) Forecast, by Application 2019 & 2032
- Table 53: Global Telecommunication MLCC Market Revenue Million Forecast, by Device Type 2019 & 2032
- Table 54: Global Telecommunication MLCC Market Revenue Million Forecast, by Case Size 2019 & 2032
- Table 55: Global Telecommunication MLCC Market Revenue Million Forecast, by Voltage 2019 & 2032
- Table 56: Global Telecommunication MLCC Market Revenue Million Forecast, by Capacitance 2019 & 2032
- Table 57: Global Telecommunication MLCC Market Revenue Million Forecast, by Dielectric Type 2019 & 2032
- Table 58: Global Telecommunication MLCC Market Revenue Million Forecast, by Country 2019 & 2032
- Table 59: China Telecommunication MLCC Market Revenue (Million) Forecast, by Application 2019 & 2032
- Table 60: India Telecommunication MLCC Market Revenue (Million) Forecast, by Application 2019 & 2032
- Table 61: Japan Telecommunication MLCC Market Revenue (Million) Forecast, by Application 2019 & 2032
- Table 62: South Korea Telecommunication MLCC Market Revenue (Million) Forecast, by Application 2019 & 2032
- Table 63: ASEAN Telecommunication MLCC Market Revenue (Million) Forecast, by Application 2019 & 2032
- Table 64: Oceania Telecommunication MLCC Market Revenue (Million) Forecast, by Application 2019 & 2032
- Table 65: Rest of Asia Pacific Telecommunication MLCC Market Revenue (Million) Forecast, by Application 2019 & 2032
Frequently Asked Questions
1. What is the projected Compound Annual Growth Rate (CAGR) of the Telecommunication MLCC Market?
The projected CAGR is approximately 5.91%.
2. Which companies are prominent players in the Telecommunication MLCC Market?
Key companies in the market include Vishay Intertechnology Inc, Kyocera AVX Components Corporation (Kyocera Corporation), Maruwa Co ltd, Samwha Capacitor Group, Walsin Technology Corporation, Samsung Electro-Mechanics, Würth Elektronik GmbH & Co KG, Yageo Corporatio, Taiyo Yuden Co Ltd, TDK Corporation, Murata Manufacturing Co Ltd, Nippon Chemi-Con Corporation.
3. What are the main segments of the Telecommunication MLCC Market?
The market segments include Device Type, Case Size, Voltage, Capacitance, Dielectric Type.
4. Can you provide details about the market size?
The market size is estimated to be USD XX Million as of 2022.
5. What are some drivers contributing to market growth?
Rise in the Applications of Semiconductors; Advancement in Technology Such as Magnetron Sputtering Technology.
6. What are the notable trends driving market growth?
OTHER KEY INDUSTRY TRENDS COVERED IN THE REPORT.
7. Are there any restraints impacting market growth?
Rise of Alternative Technologies Such as Thermal Evaporation.
8. Can you provide examples of recent developments in the market?
June 2023: The growing demand for industrial equipments has driven the company to introduce NTS/NTF NTS/NTF Series of SMD type MLCC. These capacitors are rated with 25 to 500 Vdc with a capacitance ranging from 0.010 to 47µF. These MLCCs are used in on-board power supplies,voltage regulators for computers,smoothing circuit of DC-DC converters,etc.March 2023: Murata developed the GRM series of MLCCs in 0201inch/0603M package size with capacitance values of 10µF (and a ±20% tolerance).These MLCCs are highly suited for integration into the decoupling and smoothing circuitry of smartphone handsets, portable equipment, wearables, domestic appliances, servers, and IoT hardware.October 2022: Vishay introduced a new line of surface-mount MLCC to serve DC-blocking applications better. In RF, Bluetooth, 5G, military radios, fiber optic lines, and high-frequency data links applications, the MLCCs effectively carry the necessary AC signal over the chosen frequency band with less than 0.5 dB insertion loss, removing the need for more expensive broadband blocks.
9. What pricing options are available for accessing the report?
Pricing options include single-user, multi-user, and enterprise licenses priced at USD 3800, USD 4500, and USD 5800 respectively.
10. Is the market size provided in terms of value or volume?
The market size is provided in terms of value, measured in Million.
11. Are there any specific market keywords associated with the report?
Yes, the market keyword associated with the report is "Telecommunication MLCC Market," which aids in identifying and referencing the specific market segment covered.
12. How do I determine which pricing option suits my needs best?
The pricing options vary based on user requirements and access needs. Individual users may opt for single-user licenses, while businesses requiring broader access may choose multi-user or enterprise licenses for cost-effective access to the report.
13. Are there any additional resources or data provided in the Telecommunication MLCC Market report?
While the report offers comprehensive insights, it's advisable to review the specific contents or supplementary materials provided to ascertain if additional resources or data are available.
14. How can I stay updated on further developments or reports in the Telecommunication MLCC Market?
To stay informed about further developments, trends, and reports in the Telecommunication MLCC Market, consider subscribing to industry newsletters, following relevant companies and organizations, or regularly checking reputable industry news sources and publications.
Methodology
Step 1 - Identification of Relevant Samples Size from Population Database


Step 2 - Approaches for Defining Global Market Size (Value, Volume* & Price*)

Note*: In applicable scenarios
Step 3 - Data Sources
Primary Research
- Web Analytics
- Survey Reports
- Research Institute
- Latest Research Reports
- Opinion Leaders
Secondary Research
- Annual Reports
- White Paper
- Latest Press Release
- Industry Association
- Paid Database
- Investor Presentations

Step 4 - Data Triangulation
Involves using different sources of information in order to increase the validity of a study
These sources are likely to be stakeholders in a program - participants, other researchers, program staff, other community members, and so on.
Then we put all data in single framework & apply various statistical tools to find out the dynamic on the market.
During the analysis stage, feedback from the stakeholder groups would be compared to determine areas of agreement as well as areas of divergence


