Key Insights
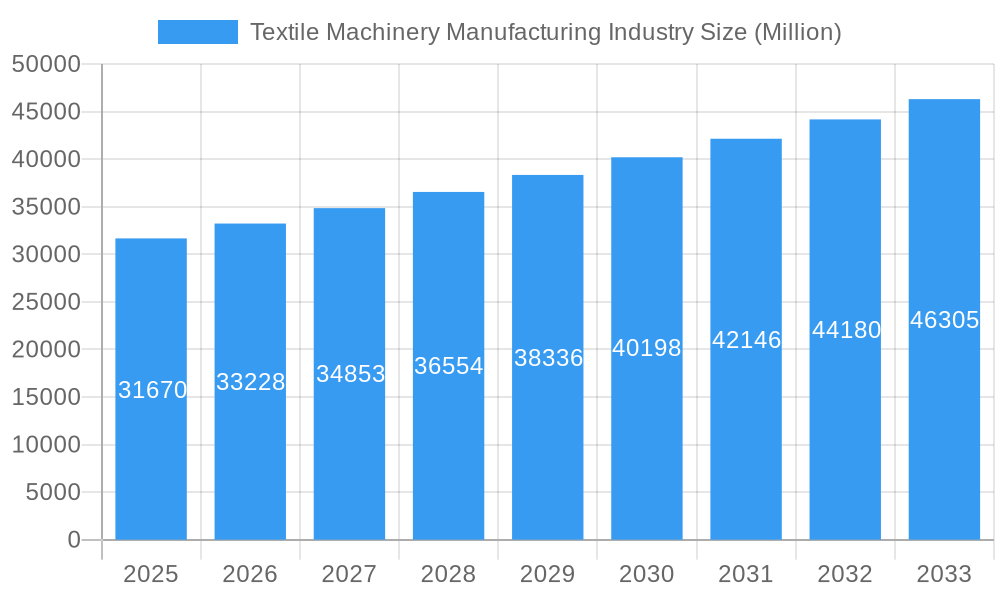
The global textile machinery manufacturing industry, valued at $31.67 billion in 2025, is projected to experience robust growth, driven by several key factors. Increasing automation in textile production, coupled with the rising demand for high-quality, sustainable textiles, is fueling significant investment in advanced machinery. The industry is witnessing a shift towards smart factories and Industry 4.0 technologies, leading to improved efficiency, reduced operational costs, and enhanced product quality. Furthermore, the growth of the apparel and home textile sectors in developing economies, particularly in Asia, is creating a substantial demand for textile machinery. Key players like OC Oerlikon, Trutzschler Group, and Rieter Holding AG are actively investing in R&D to develop innovative technologies, further driving market growth. However, fluctuating raw material prices and global economic uncertainties pose potential challenges to the industry's sustained expansion. The competitive landscape is characterized by both large multinational corporations and specialized smaller manufacturers, leading to a dynamic market with diverse product offerings and pricing strategies. Segmentation within the industry includes spinning, weaving, knitting, and finishing machinery, each exhibiting unique growth trajectories based on technological advancements and evolving consumer preferences.
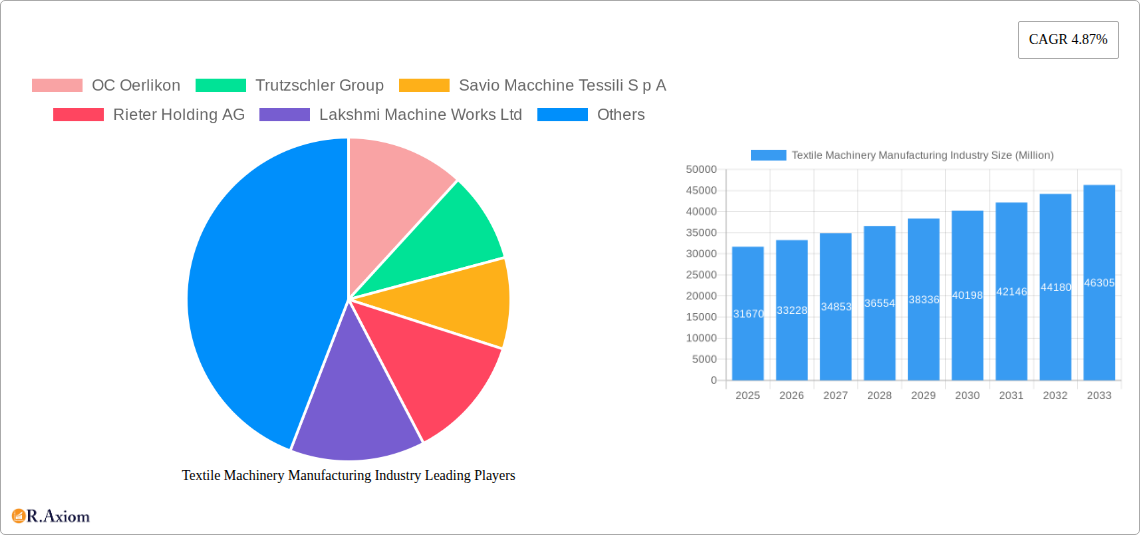
Textile Machinery Manufacturing Industry Market Size (In Billion)
The projected Compound Annual Growth Rate (CAGR) of 4.87% from 2025 to 2033 indicates a steady expansion of the market. This growth is expected to be further influenced by factors such as government initiatives promoting technological advancements in the textile sector and increasing adoption of circular economy principles in textile manufacturing. Regional variations in market growth will be influenced by factors such as economic development, infrastructure, and consumer spending patterns. Regions with strong textile manufacturing industries and robust infrastructure will likely witness faster growth compared to others. Despite potential challenges, the long-term outlook for the textile machinery manufacturing industry remains positive, driven by the continuous demand for advanced, efficient, and sustainable textile production solutions.
Textile Machinery Manufacturing Industry Company Market Share
Textile Machinery Manufacturing Industry: A Comprehensive Market Report (2019-2033)
This detailed report provides a comprehensive analysis of the global Textile Machinery Manufacturing industry, covering market size, growth projections, competitive landscape, and key technological advancements. The study period spans from 2019 to 2033, with 2025 as the base and estimated year. The forecast period is 2025-2033, and the historical period covers 2019-2024. The report offers actionable insights for industry stakeholders, including manufacturers, investors, and researchers. With a focus on high-impact keywords like "Textile Machinery," "Manufacturing Industry," "Market Analysis," and "Industry Trends," this report is designed to maximize search engine visibility and engage key decision-makers. The report values are expressed in Millions.
Textile Machinery Manufacturing Industry Market Concentration & Innovation
The global textile machinery manufacturing industry is moderately concentrated, with several major players holding significant market share. However, the presence of numerous smaller companies and regional players contributes to a dynamic competitive environment. OC Oerlikon, Trutzschler Group, Savio Macchine Tessili S p A, Rieter Holding AG, Lakshmi Machine Works Ltd, Murata Machinery Ltd, Santoni S p A, Saurer Intelligent Technology AG, TMT Machinery Inc, and Mayer & Cie GmbH & Co KG are some of the leading players. An estimated xx Million companies represent the remaining market share. Market concentration is influenced by factors including technological innovation, M&A activity, and regional economic conditions.
Market Share: The top 10 companies hold an estimated xx% of the global market share in 2025, with the remaining xx% distributed among numerous smaller players. Precise market share data requires further in-depth analysis and is available in the full report.
Innovation Drivers: Key innovation drivers include advancements in automation, digitalization (Industry 4.0), sustainable manufacturing practices, and the development of high-performance materials.
Regulatory Frameworks: Government regulations concerning environmental protection, worker safety, and product standards significantly influence the industry.
Product Substitutes: Limited direct substitutes exist, but advancements in alternative manufacturing processes pose a potential long-term threat.
End-User Trends: The growing demand for sustainable and high-quality textiles from the apparel, home furnishings, and technical textiles sectors drives innovation and market growth.
M&A Activities: The textile machinery manufacturing industry has witnessed several mergers and acquisitions in recent years, valued at approximately xx Million. These activities often aim to consolidate market share, expand product portfolios, and gain access to new technologies.
Textile Machinery Manufacturing Industry Industry Trends & Insights
The global textile machinery manufacturing industry is experiencing a period of significant transformation driven by several key trends. The Compound Annual Growth Rate (CAGR) is projected at xx% during the forecast period (2025-2033). Market penetration of advanced technologies, such as automation and digitalization, is steadily increasing, boosting overall productivity and efficiency. Consumer preferences for sustainable and ethically produced textiles are impacting the industry, pushing manufacturers to adopt environmentally friendly practices and supply chain transparency. Competitive dynamics are intensifying, with companies investing heavily in R&D and strategic partnerships to maintain their market position.
Technological disruptions, primarily driven by automation and digitization, are transforming manufacturing processes, creating opportunities for increased efficiency and reduced operational costs. The increasing adoption of smart factories and data analytics is leading to improved decision-making and optimized production workflows. The market is also witnessing a growing demand for customized and specialized machinery to cater to the diverse needs of textile manufacturers. The shift toward sustainable manufacturing practices is gaining momentum, with a focus on reducing environmental impact and optimizing resource utilization.
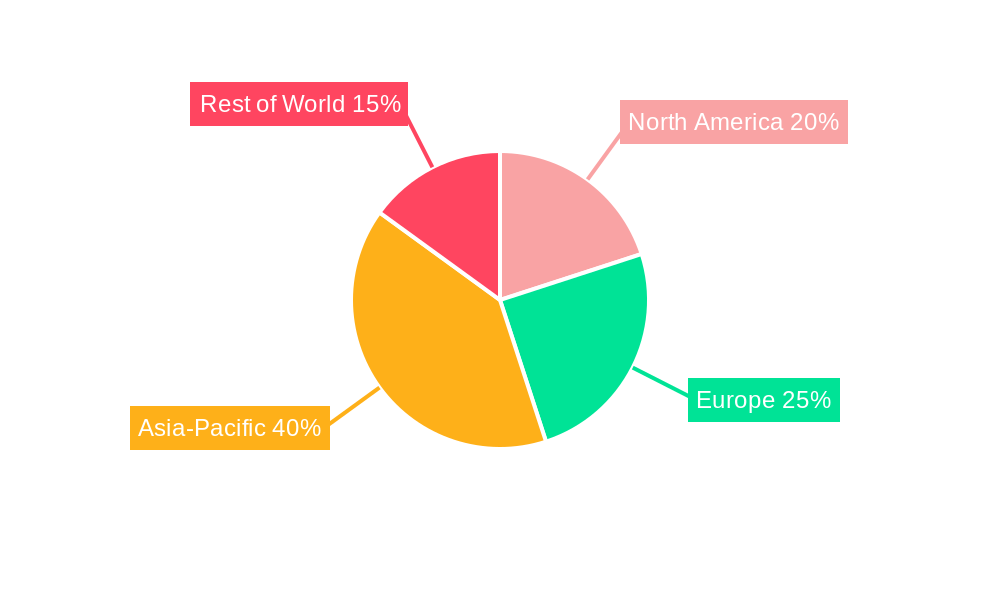
Dominant Markets & Segments in Textile Machinery Manufacturing Industry
The Asia-Pacific region currently holds the largest share of the global textile machinery manufacturing market, driven by factors such as robust economic growth, expanding textile production capacity, and supportive government policies. China, India, and other Southeast Asian countries are significant contributors to this regional dominance.
Key Drivers for Asia-Pacific Dominance:
Rapid Economic Growth: Strong economic growth in many Asia-Pacific countries fuels investment in new textile production facilities and machinery upgrades.
Favorable Government Policies: Government initiatives promoting textile industry development and modernization provide impetus for market expansion.
Extensive Infrastructure: Growing infrastructure facilitates efficient transportation and logistics, supporting the seamless operation of the textile machinery industry.
Cost-Competitive Labor: Relatively lower labor costs in certain regions of Asia-Pacific provide a competitive advantage for textile manufacturing.
The dominance of the Asia-Pacific region is further solidified by the increasing demand for various textile products, both domestically and for export. The region’s large and growing population acts as a significant consumer base, stimulating the growth of the textile and clothing industry, which, in turn, increases the demand for textile machinery. Other significant regions include Europe and North America, characterized by high-value manufacturing and technological advancements.
Textile Machinery Manufacturing Industry Product Developments
Recent product innovations focus on enhancing efficiency, precision, and sustainability. New machines incorporate advanced automation technologies, digital connectivity, and smart features to improve overall production performance. The development of energy-efficient and environmentally friendly machinery is a key area of focus, reflecting the growing emphasis on sustainable manufacturing practices. These innovations contribute to significant competitive advantages by reducing operational costs, improving product quality, and enhancing environmental performance. The market's receptiveness to these innovations is high, with rapid adoption driven by the need for increased productivity and sustainability.
Report Scope & Segmentation Analysis
This report provides a comprehensive segmentation analysis of the textile machinery manufacturing industry based on various factors. The report segments the market by product type (spinning, weaving, knitting, dyeing, finishing), application (apparel, home textiles, technical textiles), and geography (Asia-Pacific, North America, Europe, Rest of the World). Each segment is analyzed individually, offering detailed insights into market size, growth projections, and competitive landscape. This analysis helps stakeholders identify promising segments and tailor their strategies for maximum impact. The growth projections for each segment vary based on regional and technological factors; full details are provided in the complete report.
Key Drivers of Textile Machinery Manufacturing Industry Growth
Several key factors are driving growth in the textile machinery manufacturing industry. Technological advancements, particularly in automation and digitalization, are increasing the efficiency and productivity of textile production. Growing demand for textiles from various end-use sectors, including apparel, home furnishings, and technical textiles, fuels market expansion. Favorable economic conditions and supportive government policies in several regions further enhance market growth. The increasing adoption of sustainable manufacturing practices is shaping the industry's future, with manufacturers investing in environmentally friendly technologies.
Challenges in the Textile Machinery Manufacturing Industry Sector
The textile machinery manufacturing industry faces several challenges. Fluctuations in raw material prices and energy costs impact profitability. Intense competition from both established and new players necessitates continuous innovation and cost optimization. Supply chain disruptions caused by geopolitical events or natural disasters can significantly affect production and delivery schedules. Regulatory hurdles related to environmental protection and labor standards can increase operating costs and complexity. These factors combined can lead to xx Million in annual revenue loss for the industry.
Emerging Opportunities in Textile Machinery Manufacturing Industry
Several emerging opportunities exist for growth in the textile machinery manufacturing industry. The growing adoption of advanced materials, such as high-performance fibers and composites, presents opportunities for specialized machinery development. The rising demand for sustainable and eco-friendly manufacturing practices encourages investments in energy-efficient technologies and waste reduction solutions. Expansion into new markets, particularly in developing economies with growing textile industries, offers significant growth potential. The development of smart factories and digital solutions will increase efficiency and productivity, further driving industry expansion.
Leading Players in the Textile Machinery Manufacturing Industry Market
- OC Oerlikon
- Trutzschler Group
- Savio Macchine Tessili S p A
- Rieter Holding AG
- Lakshmi Machine Works Ltd
- Murata Machinery Ltd
- Santoni S p A
- Saurer Intelligent Technology AG
- TMT Machinery Inc
- Mayer & Cie GmbH & Co KG
- 63 Other Companies (Overview/Key Information available in the full report)
Key Developments in Textile Machinery Manufacturing Industry Industry
June 2022: Trützschler Nonwovens & Man-Made Fibers partnered with Texnology to develop full needle-punching lines (T-SUPREMA brand), enhancing web bonding capabilities in the dry-laid nonwoven sector, primarily impacting geotextiles, automotive textiles, and filter media.
January 2022: Morgan Tecnica launched PLY1, a single-ply cutting system capable of handling various textile materials with high precision and speed, addressing industry demands for versatile cutting solutions.
April 2021: Ingersoll Machine Tools expanded its facility, installing a large milling center, indirectly benefiting the industry by supplying advanced machining capabilities applicable to textile machinery components. This indirectly impacts the sector by enhancing the capabilities of component suppliers.
Strategic Outlook for Textile Machinery Manufacturing Industry Market
The future of the textile machinery manufacturing industry looks promising, driven by technological innovation, increasing demand for textiles, and the adoption of sustainable practices. Continued investment in automation, digitalization, and energy-efficient technologies will significantly enhance industry competitiveness. Expansion into new markets and strategic partnerships will further drive growth. The focus on producing sustainable and high-quality textiles will shape product development and drive demand for advanced machinery solutions. This trend is expected to contribute to substantial market growth over the forecast period.
Textile Machinery Manufacturing Industry Segmentation
-
1. Raw Material
- 1.1. Cotton
- 1.2. Wool
- 1.3. Nylon
- 1.4. Polyester
- 1.5. Acrylic
- 1.6. Silk
- 1.7. Other Raw Materials
-
2. Machine Type
- 2.1. Spinning Machines
- 2.2. Weaving Machines
- 2.3. Knitting Machines
- 2.4. Texturing Machines
- 2.5. Other Machine Types
-
3. Distribution Channel
- 3.1. Direct
- 3.2. Indirect
-
4. Application
- 4.1. Garments & Apparels
- 4.2. Household and Home Textiles
- 4.3. Technica
Textile Machinery Manufacturing Industry Segmentation By Geography
-
1. North America
- 1.1. United States
- 1.2. Canada
- 1.3. Mexico
-
2. Europe
- 2.1. Germany
- 2.2. France
- 2.3. United Kingdom
- 2.4. Italy
- 2.5. Spain
- 2.6. Russia
- 2.7. Rest of Europe
-
3. Asia Pacific
- 3.1. China
- 3.2. Japan
- 3.3. India
- 3.4. Bangladesh
- 3.5. Turkey
- 3.6. South Korea
- 3.7. Australia
- 3.8. Indonesia
- 3.9. Rest of Asia Pacific
- 4. Middle East
-
5. Egypt
- 5.1. South Africa
- 5.2. Saudi Arabia
- 5.3. Rest of Middle East
-
6. South America
- 6.1. Brazil
- 6.2. Argentina
- 6.3. Rest of South America
Textile Machinery Manufacturing Industry Regional Market Share
Geographic Coverage of Textile Machinery Manufacturing Industry
Textile Machinery Manufacturing Industry REPORT HIGHLIGHTS
| Aspects | Details |
|---|---|
| Study Period | 2020-2034 |
| Base Year | 2025 |
| Estimated Year | 2026 |
| Forecast Period | 2026-2034 |
| Historical Period | 2020-2025 |
| Growth Rate | CAGR of 4.87% from 2020-2034 |
| Segmentation |
|
Table of Contents
- 1. Introduction
- 1.1. Research Scope
- 1.2. Market Segmentation
- 1.3. Research Objective
- 1.4. Definitions and Assumptions
- 2. Executive Summary
- 2.1. Market Snapshot
- 3. Market Dynamics
- 3.1. Market Drivers
- 3.2. Market Restrains
- 3.3. Market Trends
- 3.4. Market Opportunities
- 4. Market Factor Analysis
- 4.1. Porters Five Forces
- 4.1.1. Bargaining Power of Suppliers
- 4.1.2. Bargaining Power of Buyers
- 4.1.3. Threat of New Entrants
- 4.1.4. Threat of Substitutes
- 4.1.5. Competitive Rivalry
- 4.2. PESTEL analysis
- 4.3. BCG Analysis
- 4.3.1. Stars (High Growth, High Market Share)
- 4.3.2. Cash Cows (Low Growth, High Market Share)
- 4.3.3. Question Mark (High Growth, Low Market Share)
- 4.3.4. Dogs (Low Growth, Low Market Share)
- 4.4. Ansoff Matrix Analysis
- 4.5. Supply Chain Analysis
- 4.6. Regulatory Landscape
- 4.7. Current Market Potential and Opportunity Assessment (TAM–SAM–SOM Framework)
- 4.8. RAX Analyst Note
- 4.1. Porters Five Forces
- 5. Market Analysis, Insights and Forecast 2021-2033
- 5.1. Market Analysis, Insights and Forecast - by Raw Material
- 5.1.1. Cotton
- 5.1.2. Wool
- 5.1.3. Nylon
- 5.1.4. Polyester
- 5.1.5. Acrylic
- 5.1.6. Silk
- 5.1.7. Other Raw Materials
- 5.2. Market Analysis, Insights and Forecast - by Machine Type
- 5.2.1. Spinning Machines
- 5.2.2. Weaving Machines
- 5.2.3. Knitting Machines
- 5.2.4. Texturing Machines
- 5.2.5. Other Machine Types
- 5.3. Market Analysis, Insights and Forecast - by Distribution Channel
- 5.3.1. Direct
- 5.3.2. Indirect
- 5.4. Market Analysis, Insights and Forecast - by Application
- 5.4.1. Garments & Apparels
- 5.4.2. Household and Home Textiles
- 5.4.3. Technica
- 5.5. Market Analysis, Insights and Forecast - by Region
- 5.5.1. North America
- 5.5.2. Europe
- 5.5.3. Asia Pacific
- 5.5.4. Middle East
- 5.5.5. Egypt
- 5.5.6. South America
- 5.1. Market Analysis, Insights and Forecast - by Raw Material
- 6. Global Textile Machinery Manufacturing Industry Analysis, Insights and Forecast, 2021-2033
- 6.1. Market Analysis, Insights and Forecast - by Raw Material
- 6.1.1. Cotton
- 6.1.2. Wool
- 6.1.3. Nylon
- 6.1.4. Polyester
- 6.1.5. Acrylic
- 6.1.6. Silk
- 6.1.7. Other Raw Materials
- 6.2. Market Analysis, Insights and Forecast - by Machine Type
- 6.2.1. Spinning Machines
- 6.2.2. Weaving Machines
- 6.2.3. Knitting Machines
- 6.2.4. Texturing Machines
- 6.2.5. Other Machine Types
- 6.3. Market Analysis, Insights and Forecast - by Distribution Channel
- 6.3.1. Direct
- 6.3.2. Indirect
- 6.4. Market Analysis, Insights and Forecast - by Application
- 6.4.1. Garments & Apparels
- 6.4.2. Household and Home Textiles
- 6.4.3. Technica
- 6.1. Market Analysis, Insights and Forecast - by Raw Material
- 7. North America Textile Machinery Manufacturing Industry Analysis, Insights and Forecast, 2020-2032
- 7.1. Market Analysis, Insights and Forecast - by Raw Material
- 7.1.1. Cotton
- 7.1.2. Wool
- 7.1.3. Nylon
- 7.1.4. Polyester
- 7.1.5. Acrylic
- 7.1.6. Silk
- 7.1.7. Other Raw Materials
- 7.2. Market Analysis, Insights and Forecast - by Machine Type
- 7.2.1. Spinning Machines
- 7.2.2. Weaving Machines
- 7.2.3. Knitting Machines
- 7.2.4. Texturing Machines
- 7.2.5. Other Machine Types
- 7.3. Market Analysis, Insights and Forecast - by Distribution Channel
- 7.3.1. Direct
- 7.3.2. Indirect
- 7.4. Market Analysis, Insights and Forecast - by Application
- 7.4.1. Garments & Apparels
- 7.4.2. Household and Home Textiles
- 7.4.3. Technica
- 7.1. Market Analysis, Insights and Forecast - by Raw Material
- 8. Europe Textile Machinery Manufacturing Industry Analysis, Insights and Forecast, 2020-2032
- 8.1. Market Analysis, Insights and Forecast - by Raw Material
- 8.1.1. Cotton
- 8.1.2. Wool
- 8.1.3. Nylon
- 8.1.4. Polyester
- 8.1.5. Acrylic
- 8.1.6. Silk
- 8.1.7. Other Raw Materials
- 8.2. Market Analysis, Insights and Forecast - by Machine Type
- 8.2.1. Spinning Machines
- 8.2.2. Weaving Machines
- 8.2.3. Knitting Machines
- 8.2.4. Texturing Machines
- 8.2.5. Other Machine Types
- 8.3. Market Analysis, Insights and Forecast - by Distribution Channel
- 8.3.1. Direct
- 8.3.2. Indirect
- 8.4. Market Analysis, Insights and Forecast - by Application
- 8.4.1. Garments & Apparels
- 8.4.2. Household and Home Textiles
- 8.4.3. Technica
- 8.1. Market Analysis, Insights and Forecast - by Raw Material
- 9. Asia Pacific Textile Machinery Manufacturing Industry Analysis, Insights and Forecast, 2020-2032
- 9.1. Market Analysis, Insights and Forecast - by Raw Material
- 9.1.1. Cotton
- 9.1.2. Wool
- 9.1.3. Nylon
- 9.1.4. Polyester
- 9.1.5. Acrylic
- 9.1.6. Silk
- 9.1.7. Other Raw Materials
- 9.2. Market Analysis, Insights and Forecast - by Machine Type
- 9.2.1. Spinning Machines
- 9.2.2. Weaving Machines
- 9.2.3. Knitting Machines
- 9.2.4. Texturing Machines
- 9.2.5. Other Machine Types
- 9.3. Market Analysis, Insights and Forecast - by Distribution Channel
- 9.3.1. Direct
- 9.3.2. Indirect
- 9.4. Market Analysis, Insights and Forecast - by Application
- 9.4.1. Garments & Apparels
- 9.4.2. Household and Home Textiles
- 9.4.3. Technica
- 9.1. Market Analysis, Insights and Forecast - by Raw Material
- 10. Middle East Textile Machinery Manufacturing Industry Analysis, Insights and Forecast, 2020-2032
- 10.1. Market Analysis, Insights and Forecast - by Raw Material
- 10.1.1. Cotton
- 10.1.2. Wool
- 10.1.3. Nylon
- 10.1.4. Polyester
- 10.1.5. Acrylic
- 10.1.6. Silk
- 10.1.7. Other Raw Materials
- 10.2. Market Analysis, Insights and Forecast - by Machine Type
- 10.2.1. Spinning Machines
- 10.2.2. Weaving Machines
- 10.2.3. Knitting Machines
- 10.2.4. Texturing Machines
- 10.2.5. Other Machine Types
- 10.3. Market Analysis, Insights and Forecast - by Distribution Channel
- 10.3.1. Direct
- 10.3.2. Indirect
- 10.4. Market Analysis, Insights and Forecast - by Application
- 10.4.1. Garments & Apparels
- 10.4.2. Household and Home Textiles
- 10.4.3. Technica
- 10.1. Market Analysis, Insights and Forecast - by Raw Material
- 11. Egypt Textile Machinery Manufacturing Industry Analysis, Insights and Forecast, 2020-2032
- 11.1. Market Analysis, Insights and Forecast - by Raw Material
- 11.1.1. Cotton
- 11.1.2. Wool
- 11.1.3. Nylon
- 11.1.4. Polyester
- 11.1.5. Acrylic
- 11.1.6. Silk
- 11.1.7. Other Raw Materials
- 11.2. Market Analysis, Insights and Forecast - by Machine Type
- 11.2.1. Spinning Machines
- 11.2.2. Weaving Machines
- 11.2.3. Knitting Machines
- 11.2.4. Texturing Machines
- 11.2.5. Other Machine Types
- 11.3. Market Analysis, Insights and Forecast - by Distribution Channel
- 11.3.1. Direct
- 11.3.2. Indirect
- 11.4. Market Analysis, Insights and Forecast - by Application
- 11.4.1. Garments & Apparels
- 11.4.2. Household and Home Textiles
- 11.4.3. Technica
- 11.1. Market Analysis, Insights and Forecast - by Raw Material
- 12. South America Textile Machinery Manufacturing Industry Analysis, Insights and Forecast, 2020-2032
- 12.1. Market Analysis, Insights and Forecast - by Raw Material
- 12.1.1. Cotton
- 12.1.2. Wool
- 12.1.3. Nylon
- 12.1.4. Polyester
- 12.1.5. Acrylic
- 12.1.6. Silk
- 12.1.7. Other Raw Materials
- 12.2. Market Analysis, Insights and Forecast - by Machine Type
- 12.2.1. Spinning Machines
- 12.2.2. Weaving Machines
- 12.2.3. Knitting Machines
- 12.2.4. Texturing Machines
- 12.2.5. Other Machine Types
- 12.3. Market Analysis, Insights and Forecast - by Distribution Channel
- 12.3.1. Direct
- 12.3.2. Indirect
- 12.4. Market Analysis, Insights and Forecast - by Application
- 12.4.1. Garments & Apparels
- 12.4.2. Household and Home Textiles
- 12.4.3. Technica
- 12.1. Market Analysis, Insights and Forecast - by Raw Material
- 13. Competitive Analysis
- 13.1. Company Profiles
- 13.1.1 OC Oerlikon
- 13.1.1.1. Company Overview
- 13.1.1.2. Products
- 13.1.1.3. Company Financials
- 13.1.1.4. SWOT Analysis
- 13.1.2 Trutzschler Group
- 13.1.2.1. Company Overview
- 13.1.2.2. Products
- 13.1.2.3. Company Financials
- 13.1.2.4. SWOT Analysis
- 13.1.3 Savio Macchine Tessili S p A
- 13.1.3.1. Company Overview
- 13.1.3.2. Products
- 13.1.3.3. Company Financials
- 13.1.3.4. SWOT Analysis
- 13.1.4 Rieter Holding AG
- 13.1.4.1. Company Overview
- 13.1.4.2. Products
- 13.1.4.3. Company Financials
- 13.1.4.4. SWOT Analysis
- 13.1.5 Lakshmi Machine Works Ltd
- 13.1.5.1. Company Overview
- 13.1.5.2. Products
- 13.1.5.3. Company Financials
- 13.1.5.4. SWOT Analysis
- 13.1.6 Murata Machinery Ltd
- 13.1.6.1. Company Overview
- 13.1.6.2. Products
- 13.1.6.3. Company Financials
- 13.1.6.4. SWOT Analysis
- 13.1.7 Santoni S p A
- 13.1.7.1. Company Overview
- 13.1.7.2. Products
- 13.1.7.3. Company Financials
- 13.1.7.4. SWOT Analysis
- 13.1.8 Saurer Intelligent Technlogy AG
- 13.1.8.1. Company Overview
- 13.1.8.2. Products
- 13.1.8.3. Company Financials
- 13.1.8.4. SWOT Analysis
- 13.1.9 TMT Machinery Inc
- 13.1.9.1. Company Overview
- 13.1.9.2. Products
- 13.1.9.3. Company Financials
- 13.1.9.4. SWOT Analysis
- 13.1.10 Mayer & Cie GmbH & Co KG**List Not Exhaustive 6 3 Other Companies (Overview/Key Information
- 13.1.10.1. Company Overview
- 13.1.10.2. Products
- 13.1.10.3. Company Financials
- 13.1.10.4. SWOT Analysis
- 13.1.1 OC Oerlikon
- 13.2. Market Entropy
- 13.2.1 Company's Key Areas Served
- 13.2.2 Recent Developments
- 13.3. Company Market Share Analysis 2025
- 13.3.1 Top 5 Companies Market Share Analysis
- 13.3.2 Top 3 Companies Market Share Analysis
- 13.4. List of Potential Customers
- 14. Research Methodology
List of Figures
- Figure 1: Global Textile Machinery Manufacturing Industry Revenue Breakdown (Million, %) by Region 2025 & 2033
- Figure 2: Global Textile Machinery Manufacturing Industry Volume Breakdown (Billion, %) by Region 2025 & 2033
- Figure 3: North America Textile Machinery Manufacturing Industry Revenue (Million), by Raw Material 2025 & 2033
- Figure 4: North America Textile Machinery Manufacturing Industry Volume (Billion), by Raw Material 2025 & 2033
- Figure 5: North America Textile Machinery Manufacturing Industry Revenue Share (%), by Raw Material 2025 & 2033
- Figure 6: North America Textile Machinery Manufacturing Industry Volume Share (%), by Raw Material 2025 & 2033
- Figure 7: North America Textile Machinery Manufacturing Industry Revenue (Million), by Machine Type 2025 & 2033
- Figure 8: North America Textile Machinery Manufacturing Industry Volume (Billion), by Machine Type 2025 & 2033
- Figure 9: North America Textile Machinery Manufacturing Industry Revenue Share (%), by Machine Type 2025 & 2033
- Figure 10: North America Textile Machinery Manufacturing Industry Volume Share (%), by Machine Type 2025 & 2033
- Figure 11: North America Textile Machinery Manufacturing Industry Revenue (Million), by Distribution Channel 2025 & 2033
- Figure 12: North America Textile Machinery Manufacturing Industry Volume (Billion), by Distribution Channel 2025 & 2033
- Figure 13: North America Textile Machinery Manufacturing Industry Revenue Share (%), by Distribution Channel 2025 & 2033
- Figure 14: North America Textile Machinery Manufacturing Industry Volume Share (%), by Distribution Channel 2025 & 2033
- Figure 15: North America Textile Machinery Manufacturing Industry Revenue (Million), by Application 2025 & 2033
- Figure 16: North America Textile Machinery Manufacturing Industry Volume (Billion), by Application 2025 & 2033
- Figure 17: North America Textile Machinery Manufacturing Industry Revenue Share (%), by Application 2025 & 2033
- Figure 18: North America Textile Machinery Manufacturing Industry Volume Share (%), by Application 2025 & 2033
- Figure 19: North America Textile Machinery Manufacturing Industry Revenue (Million), by Country 2025 & 2033
- Figure 20: North America Textile Machinery Manufacturing Industry Volume (Billion), by Country 2025 & 2033
- Figure 21: North America Textile Machinery Manufacturing Industry Revenue Share (%), by Country 2025 & 2033
- Figure 22: North America Textile Machinery Manufacturing Industry Volume Share (%), by Country 2025 & 2033
- Figure 23: Europe Textile Machinery Manufacturing Industry Revenue (Million), by Raw Material 2025 & 2033
- Figure 24: Europe Textile Machinery Manufacturing Industry Volume (Billion), by Raw Material 2025 & 2033
- Figure 25: Europe Textile Machinery Manufacturing Industry Revenue Share (%), by Raw Material 2025 & 2033
- Figure 26: Europe Textile Machinery Manufacturing Industry Volume Share (%), by Raw Material 2025 & 2033
- Figure 27: Europe Textile Machinery Manufacturing Industry Revenue (Million), by Machine Type 2025 & 2033
- Figure 28: Europe Textile Machinery Manufacturing Industry Volume (Billion), by Machine Type 2025 & 2033
- Figure 29: Europe Textile Machinery Manufacturing Industry Revenue Share (%), by Machine Type 2025 & 2033
- Figure 30: Europe Textile Machinery Manufacturing Industry Volume Share (%), by Machine Type 2025 & 2033
- Figure 31: Europe Textile Machinery Manufacturing Industry Revenue (Million), by Distribution Channel 2025 & 2033
- Figure 32: Europe Textile Machinery Manufacturing Industry Volume (Billion), by Distribution Channel 2025 & 2033
- Figure 33: Europe Textile Machinery Manufacturing Industry Revenue Share (%), by Distribution Channel 2025 & 2033
- Figure 34: Europe Textile Machinery Manufacturing Industry Volume Share (%), by Distribution Channel 2025 & 2033
- Figure 35: Europe Textile Machinery Manufacturing Industry Revenue (Million), by Application 2025 & 2033
- Figure 36: Europe Textile Machinery Manufacturing Industry Volume (Billion), by Application 2025 & 2033
- Figure 37: Europe Textile Machinery Manufacturing Industry Revenue Share (%), by Application 2025 & 2033
- Figure 38: Europe Textile Machinery Manufacturing Industry Volume Share (%), by Application 2025 & 2033
- Figure 39: Europe Textile Machinery Manufacturing Industry Revenue (Million), by Country 2025 & 2033
- Figure 40: Europe Textile Machinery Manufacturing Industry Volume (Billion), by Country 2025 & 2033
- Figure 41: Europe Textile Machinery Manufacturing Industry Revenue Share (%), by Country 2025 & 2033
- Figure 42: Europe Textile Machinery Manufacturing Industry Volume Share (%), by Country 2025 & 2033
- Figure 43: Asia Pacific Textile Machinery Manufacturing Industry Revenue (Million), by Raw Material 2025 & 2033
- Figure 44: Asia Pacific Textile Machinery Manufacturing Industry Volume (Billion), by Raw Material 2025 & 2033
- Figure 45: Asia Pacific Textile Machinery Manufacturing Industry Revenue Share (%), by Raw Material 2025 & 2033
- Figure 46: Asia Pacific Textile Machinery Manufacturing Industry Volume Share (%), by Raw Material 2025 & 2033
- Figure 47: Asia Pacific Textile Machinery Manufacturing Industry Revenue (Million), by Machine Type 2025 & 2033
- Figure 48: Asia Pacific Textile Machinery Manufacturing Industry Volume (Billion), by Machine Type 2025 & 2033
- Figure 49: Asia Pacific Textile Machinery Manufacturing Industry Revenue Share (%), by Machine Type 2025 & 2033
- Figure 50: Asia Pacific Textile Machinery Manufacturing Industry Volume Share (%), by Machine Type 2025 & 2033
- Figure 51: Asia Pacific Textile Machinery Manufacturing Industry Revenue (Million), by Distribution Channel 2025 & 2033
- Figure 52: Asia Pacific Textile Machinery Manufacturing Industry Volume (Billion), by Distribution Channel 2025 & 2033
- Figure 53: Asia Pacific Textile Machinery Manufacturing Industry Revenue Share (%), by Distribution Channel 2025 & 2033
- Figure 54: Asia Pacific Textile Machinery Manufacturing Industry Volume Share (%), by Distribution Channel 2025 & 2033
- Figure 55: Asia Pacific Textile Machinery Manufacturing Industry Revenue (Million), by Application 2025 & 2033
- Figure 56: Asia Pacific Textile Machinery Manufacturing Industry Volume (Billion), by Application 2025 & 2033
- Figure 57: Asia Pacific Textile Machinery Manufacturing Industry Revenue Share (%), by Application 2025 & 2033
- Figure 58: Asia Pacific Textile Machinery Manufacturing Industry Volume Share (%), by Application 2025 & 2033
- Figure 59: Asia Pacific Textile Machinery Manufacturing Industry Revenue (Million), by Country 2025 & 2033
- Figure 60: Asia Pacific Textile Machinery Manufacturing Industry Volume (Billion), by Country 2025 & 2033
- Figure 61: Asia Pacific Textile Machinery Manufacturing Industry Revenue Share (%), by Country 2025 & 2033
- Figure 62: Asia Pacific Textile Machinery Manufacturing Industry Volume Share (%), by Country 2025 & 2033
- Figure 63: Middle East Textile Machinery Manufacturing Industry Revenue (Million), by Raw Material 2025 & 2033
- Figure 64: Middle East Textile Machinery Manufacturing Industry Volume (Billion), by Raw Material 2025 & 2033
- Figure 65: Middle East Textile Machinery Manufacturing Industry Revenue Share (%), by Raw Material 2025 & 2033
- Figure 66: Middle East Textile Machinery Manufacturing Industry Volume Share (%), by Raw Material 2025 & 2033
- Figure 67: Middle East Textile Machinery Manufacturing Industry Revenue (Million), by Machine Type 2025 & 2033
- Figure 68: Middle East Textile Machinery Manufacturing Industry Volume (Billion), by Machine Type 2025 & 2033
- Figure 69: Middle East Textile Machinery Manufacturing Industry Revenue Share (%), by Machine Type 2025 & 2033
- Figure 70: Middle East Textile Machinery Manufacturing Industry Volume Share (%), by Machine Type 2025 & 2033
- Figure 71: Middle East Textile Machinery Manufacturing Industry Revenue (Million), by Distribution Channel 2025 & 2033
- Figure 72: Middle East Textile Machinery Manufacturing Industry Volume (Billion), by Distribution Channel 2025 & 2033
- Figure 73: Middle East Textile Machinery Manufacturing Industry Revenue Share (%), by Distribution Channel 2025 & 2033
- Figure 74: Middle East Textile Machinery Manufacturing Industry Volume Share (%), by Distribution Channel 2025 & 2033
- Figure 75: Middle East Textile Machinery Manufacturing Industry Revenue (Million), by Application 2025 & 2033
- Figure 76: Middle East Textile Machinery Manufacturing Industry Volume (Billion), by Application 2025 & 2033
- Figure 77: Middle East Textile Machinery Manufacturing Industry Revenue Share (%), by Application 2025 & 2033
- Figure 78: Middle East Textile Machinery Manufacturing Industry Volume Share (%), by Application 2025 & 2033
- Figure 79: Middle East Textile Machinery Manufacturing Industry Revenue (Million), by Country 2025 & 2033
- Figure 80: Middle East Textile Machinery Manufacturing Industry Volume (Billion), by Country 2025 & 2033
- Figure 81: Middle East Textile Machinery Manufacturing Industry Revenue Share (%), by Country 2025 & 2033
- Figure 82: Middle East Textile Machinery Manufacturing Industry Volume Share (%), by Country 2025 & 2033
- Figure 83: Egypt Textile Machinery Manufacturing Industry Revenue (Million), by Raw Material 2025 & 2033
- Figure 84: Egypt Textile Machinery Manufacturing Industry Volume (Billion), by Raw Material 2025 & 2033
- Figure 85: Egypt Textile Machinery Manufacturing Industry Revenue Share (%), by Raw Material 2025 & 2033
- Figure 86: Egypt Textile Machinery Manufacturing Industry Volume Share (%), by Raw Material 2025 & 2033
- Figure 87: Egypt Textile Machinery Manufacturing Industry Revenue (Million), by Machine Type 2025 & 2033
- Figure 88: Egypt Textile Machinery Manufacturing Industry Volume (Billion), by Machine Type 2025 & 2033
- Figure 89: Egypt Textile Machinery Manufacturing Industry Revenue Share (%), by Machine Type 2025 & 2033
- Figure 90: Egypt Textile Machinery Manufacturing Industry Volume Share (%), by Machine Type 2025 & 2033
- Figure 91: Egypt Textile Machinery Manufacturing Industry Revenue (Million), by Distribution Channel 2025 & 2033
- Figure 92: Egypt Textile Machinery Manufacturing Industry Volume (Billion), by Distribution Channel 2025 & 2033
- Figure 93: Egypt Textile Machinery Manufacturing Industry Revenue Share (%), by Distribution Channel 2025 & 2033
- Figure 94: Egypt Textile Machinery Manufacturing Industry Volume Share (%), by Distribution Channel 2025 & 2033
- Figure 95: Egypt Textile Machinery Manufacturing Industry Revenue (Million), by Application 2025 & 2033
- Figure 96: Egypt Textile Machinery Manufacturing Industry Volume (Billion), by Application 2025 & 2033
- Figure 97: Egypt Textile Machinery Manufacturing Industry Revenue Share (%), by Application 2025 & 2033
- Figure 98: Egypt Textile Machinery Manufacturing Industry Volume Share (%), by Application 2025 & 2033
- Figure 99: Egypt Textile Machinery Manufacturing Industry Revenue (Million), by Country 2025 & 2033
- Figure 100: Egypt Textile Machinery Manufacturing Industry Volume (Billion), by Country 2025 & 2033
- Figure 101: Egypt Textile Machinery Manufacturing Industry Revenue Share (%), by Country 2025 & 2033
- Figure 102: Egypt Textile Machinery Manufacturing Industry Volume Share (%), by Country 2025 & 2033
- Figure 103: South America Textile Machinery Manufacturing Industry Revenue (Million), by Raw Material 2025 & 2033
- Figure 104: South America Textile Machinery Manufacturing Industry Volume (Billion), by Raw Material 2025 & 2033
- Figure 105: South America Textile Machinery Manufacturing Industry Revenue Share (%), by Raw Material 2025 & 2033
- Figure 106: South America Textile Machinery Manufacturing Industry Volume Share (%), by Raw Material 2025 & 2033
- Figure 107: South America Textile Machinery Manufacturing Industry Revenue (Million), by Machine Type 2025 & 2033
- Figure 108: South America Textile Machinery Manufacturing Industry Volume (Billion), by Machine Type 2025 & 2033
- Figure 109: South America Textile Machinery Manufacturing Industry Revenue Share (%), by Machine Type 2025 & 2033
- Figure 110: South America Textile Machinery Manufacturing Industry Volume Share (%), by Machine Type 2025 & 2033
- Figure 111: South America Textile Machinery Manufacturing Industry Revenue (Million), by Distribution Channel 2025 & 2033
- Figure 112: South America Textile Machinery Manufacturing Industry Volume (Billion), by Distribution Channel 2025 & 2033
- Figure 113: South America Textile Machinery Manufacturing Industry Revenue Share (%), by Distribution Channel 2025 & 2033
- Figure 114: South America Textile Machinery Manufacturing Industry Volume Share (%), by Distribution Channel 2025 & 2033
- Figure 115: South America Textile Machinery Manufacturing Industry Revenue (Million), by Application 2025 & 2033
- Figure 116: South America Textile Machinery Manufacturing Industry Volume (Billion), by Application 2025 & 2033
- Figure 117: South America Textile Machinery Manufacturing Industry Revenue Share (%), by Application 2025 & 2033
- Figure 118: South America Textile Machinery Manufacturing Industry Volume Share (%), by Application 2025 & 2033
- Figure 119: South America Textile Machinery Manufacturing Industry Revenue (Million), by Country 2025 & 2033
- Figure 120: South America Textile Machinery Manufacturing Industry Volume (Billion), by Country 2025 & 2033
- Figure 121: South America Textile Machinery Manufacturing Industry Revenue Share (%), by Country 2025 & 2033
- Figure 122: South America Textile Machinery Manufacturing Industry Volume Share (%), by Country 2025 & 2033
List of Tables
- Table 1: Global Textile Machinery Manufacturing Industry Revenue Million Forecast, by Raw Material 2020 & 2033
- Table 2: Global Textile Machinery Manufacturing Industry Volume Billion Forecast, by Raw Material 2020 & 2033
- Table 3: Global Textile Machinery Manufacturing Industry Revenue Million Forecast, by Machine Type 2020 & 2033
- Table 4: Global Textile Machinery Manufacturing Industry Volume Billion Forecast, by Machine Type 2020 & 2033
- Table 5: Global Textile Machinery Manufacturing Industry Revenue Million Forecast, by Distribution Channel 2020 & 2033
- Table 6: Global Textile Machinery Manufacturing Industry Volume Billion Forecast, by Distribution Channel 2020 & 2033
- Table 7: Global Textile Machinery Manufacturing Industry Revenue Million Forecast, by Application 2020 & 2033
- Table 8: Global Textile Machinery Manufacturing Industry Volume Billion Forecast, by Application 2020 & 2033
- Table 9: Global Textile Machinery Manufacturing Industry Revenue Million Forecast, by Region 2020 & 2033
- Table 10: Global Textile Machinery Manufacturing Industry Volume Billion Forecast, by Region 2020 & 2033
- Table 11: Global Textile Machinery Manufacturing Industry Revenue Million Forecast, by Raw Material 2020 & 2033
- Table 12: Global Textile Machinery Manufacturing Industry Volume Billion Forecast, by Raw Material 2020 & 2033
- Table 13: Global Textile Machinery Manufacturing Industry Revenue Million Forecast, by Machine Type 2020 & 2033
- Table 14: Global Textile Machinery Manufacturing Industry Volume Billion Forecast, by Machine Type 2020 & 2033
- Table 15: Global Textile Machinery Manufacturing Industry Revenue Million Forecast, by Distribution Channel 2020 & 2033
- Table 16: Global Textile Machinery Manufacturing Industry Volume Billion Forecast, by Distribution Channel 2020 & 2033
- Table 17: Global Textile Machinery Manufacturing Industry Revenue Million Forecast, by Application 2020 & 2033
- Table 18: Global Textile Machinery Manufacturing Industry Volume Billion Forecast, by Application 2020 & 2033
- Table 19: Global Textile Machinery Manufacturing Industry Revenue Million Forecast, by Country 2020 & 2033
- Table 20: Global Textile Machinery Manufacturing Industry Volume Billion Forecast, by Country 2020 & 2033
- Table 21: United States Textile Machinery Manufacturing Industry Revenue (Million) Forecast, by Application 2020 & 2033
- Table 22: United States Textile Machinery Manufacturing Industry Volume (Billion) Forecast, by Application 2020 & 2033
- Table 23: Canada Textile Machinery Manufacturing Industry Revenue (Million) Forecast, by Application 2020 & 2033
- Table 24: Canada Textile Machinery Manufacturing Industry Volume (Billion) Forecast, by Application 2020 & 2033
- Table 25: Mexico Textile Machinery Manufacturing Industry Revenue (Million) Forecast, by Application 2020 & 2033
- Table 26: Mexico Textile Machinery Manufacturing Industry Volume (Billion) Forecast, by Application 2020 & 2033
- Table 27: Global Textile Machinery Manufacturing Industry Revenue Million Forecast, by Raw Material 2020 & 2033
- Table 28: Global Textile Machinery Manufacturing Industry Volume Billion Forecast, by Raw Material 2020 & 2033
- Table 29: Global Textile Machinery Manufacturing Industry Revenue Million Forecast, by Machine Type 2020 & 2033
- Table 30: Global Textile Machinery Manufacturing Industry Volume Billion Forecast, by Machine Type 2020 & 2033
- Table 31: Global Textile Machinery Manufacturing Industry Revenue Million Forecast, by Distribution Channel 2020 & 2033
- Table 32: Global Textile Machinery Manufacturing Industry Volume Billion Forecast, by Distribution Channel 2020 & 2033
- Table 33: Global Textile Machinery Manufacturing Industry Revenue Million Forecast, by Application 2020 & 2033
- Table 34: Global Textile Machinery Manufacturing Industry Volume Billion Forecast, by Application 2020 & 2033
- Table 35: Global Textile Machinery Manufacturing Industry Revenue Million Forecast, by Country 2020 & 2033
- Table 36: Global Textile Machinery Manufacturing Industry Volume Billion Forecast, by Country 2020 & 2033
- Table 37: Germany Textile Machinery Manufacturing Industry Revenue (Million) Forecast, by Application 2020 & 2033
- Table 38: Germany Textile Machinery Manufacturing Industry Volume (Billion) Forecast, by Application 2020 & 2033
- Table 39: France Textile Machinery Manufacturing Industry Revenue (Million) Forecast, by Application 2020 & 2033
- Table 40: France Textile Machinery Manufacturing Industry Volume (Billion) Forecast, by Application 2020 & 2033
- Table 41: United Kingdom Textile Machinery Manufacturing Industry Revenue (Million) Forecast, by Application 2020 & 2033
- Table 42: United Kingdom Textile Machinery Manufacturing Industry Volume (Billion) Forecast, by Application 2020 & 2033
- Table 43: Italy Textile Machinery Manufacturing Industry Revenue (Million) Forecast, by Application 2020 & 2033
- Table 44: Italy Textile Machinery Manufacturing Industry Volume (Billion) Forecast, by Application 2020 & 2033
- Table 45: Spain Textile Machinery Manufacturing Industry Revenue (Million) Forecast, by Application 2020 & 2033
- Table 46: Spain Textile Machinery Manufacturing Industry Volume (Billion) Forecast, by Application 2020 & 2033
- Table 47: Russia Textile Machinery Manufacturing Industry Revenue (Million) Forecast, by Application 2020 & 2033
- Table 48: Russia Textile Machinery Manufacturing Industry Volume (Billion) Forecast, by Application 2020 & 2033
- Table 49: Rest of Europe Textile Machinery Manufacturing Industry Revenue (Million) Forecast, by Application 2020 & 2033
- Table 50: Rest of Europe Textile Machinery Manufacturing Industry Volume (Billion) Forecast, by Application 2020 & 2033
- Table 51: Global Textile Machinery Manufacturing Industry Revenue Million Forecast, by Raw Material 2020 & 2033
- Table 52: Global Textile Machinery Manufacturing Industry Volume Billion Forecast, by Raw Material 2020 & 2033
- Table 53: Global Textile Machinery Manufacturing Industry Revenue Million Forecast, by Machine Type 2020 & 2033
- Table 54: Global Textile Machinery Manufacturing Industry Volume Billion Forecast, by Machine Type 2020 & 2033
- Table 55: Global Textile Machinery Manufacturing Industry Revenue Million Forecast, by Distribution Channel 2020 & 2033
- Table 56: Global Textile Machinery Manufacturing Industry Volume Billion Forecast, by Distribution Channel 2020 & 2033
- Table 57: Global Textile Machinery Manufacturing Industry Revenue Million Forecast, by Application 2020 & 2033
- Table 58: Global Textile Machinery Manufacturing Industry Volume Billion Forecast, by Application 2020 & 2033
- Table 59: Global Textile Machinery Manufacturing Industry Revenue Million Forecast, by Country 2020 & 2033
- Table 60: Global Textile Machinery Manufacturing Industry Volume Billion Forecast, by Country 2020 & 2033
- Table 61: China Textile Machinery Manufacturing Industry Revenue (Million) Forecast, by Application 2020 & 2033
- Table 62: China Textile Machinery Manufacturing Industry Volume (Billion) Forecast, by Application 2020 & 2033
- Table 63: Japan Textile Machinery Manufacturing Industry Revenue (Million) Forecast, by Application 2020 & 2033
- Table 64: Japan Textile Machinery Manufacturing Industry Volume (Billion) Forecast, by Application 2020 & 2033
- Table 65: India Textile Machinery Manufacturing Industry Revenue (Million) Forecast, by Application 2020 & 2033
- Table 66: India Textile Machinery Manufacturing Industry Volume (Billion) Forecast, by Application 2020 & 2033
- Table 67: Bangladesh Textile Machinery Manufacturing Industry Revenue (Million) Forecast, by Application 2020 & 2033
- Table 68: Bangladesh Textile Machinery Manufacturing Industry Volume (Billion) Forecast, by Application 2020 & 2033
- Table 69: Turkey Textile Machinery Manufacturing Industry Revenue (Million) Forecast, by Application 2020 & 2033
- Table 70: Turkey Textile Machinery Manufacturing Industry Volume (Billion) Forecast, by Application 2020 & 2033
- Table 71: South Korea Textile Machinery Manufacturing Industry Revenue (Million) Forecast, by Application 2020 & 2033
- Table 72: South Korea Textile Machinery Manufacturing Industry Volume (Billion) Forecast, by Application 2020 & 2033
- Table 73: Australia Textile Machinery Manufacturing Industry Revenue (Million) Forecast, by Application 2020 & 2033
- Table 74: Australia Textile Machinery Manufacturing Industry Volume (Billion) Forecast, by Application 2020 & 2033
- Table 75: Indonesia Textile Machinery Manufacturing Industry Revenue (Million) Forecast, by Application 2020 & 2033
- Table 76: Indonesia Textile Machinery Manufacturing Industry Volume (Billion) Forecast, by Application 2020 & 2033
- Table 77: Rest of Asia Pacific Textile Machinery Manufacturing Industry Revenue (Million) Forecast, by Application 2020 & 2033
- Table 78: Rest of Asia Pacific Textile Machinery Manufacturing Industry Volume (Billion) Forecast, by Application 2020 & 2033
- Table 79: Global Textile Machinery Manufacturing Industry Revenue Million Forecast, by Raw Material 2020 & 2033
- Table 80: Global Textile Machinery Manufacturing Industry Volume Billion Forecast, by Raw Material 2020 & 2033
- Table 81: Global Textile Machinery Manufacturing Industry Revenue Million Forecast, by Machine Type 2020 & 2033
- Table 82: Global Textile Machinery Manufacturing Industry Volume Billion Forecast, by Machine Type 2020 & 2033
- Table 83: Global Textile Machinery Manufacturing Industry Revenue Million Forecast, by Distribution Channel 2020 & 2033
- Table 84: Global Textile Machinery Manufacturing Industry Volume Billion Forecast, by Distribution Channel 2020 & 2033
- Table 85: Global Textile Machinery Manufacturing Industry Revenue Million Forecast, by Application 2020 & 2033
- Table 86: Global Textile Machinery Manufacturing Industry Volume Billion Forecast, by Application 2020 & 2033
- Table 87: Global Textile Machinery Manufacturing Industry Revenue Million Forecast, by Country 2020 & 2033
- Table 88: Global Textile Machinery Manufacturing Industry Volume Billion Forecast, by Country 2020 & 2033
- Table 89: Global Textile Machinery Manufacturing Industry Revenue Million Forecast, by Raw Material 2020 & 2033
- Table 90: Global Textile Machinery Manufacturing Industry Volume Billion Forecast, by Raw Material 2020 & 2033
- Table 91: Global Textile Machinery Manufacturing Industry Revenue Million Forecast, by Machine Type 2020 & 2033
- Table 92: Global Textile Machinery Manufacturing Industry Volume Billion Forecast, by Machine Type 2020 & 2033
- Table 93: Global Textile Machinery Manufacturing Industry Revenue Million Forecast, by Distribution Channel 2020 & 2033
- Table 94: Global Textile Machinery Manufacturing Industry Volume Billion Forecast, by Distribution Channel 2020 & 2033
- Table 95: Global Textile Machinery Manufacturing Industry Revenue Million Forecast, by Application 2020 & 2033
- Table 96: Global Textile Machinery Manufacturing Industry Volume Billion Forecast, by Application 2020 & 2033
- Table 97: Global Textile Machinery Manufacturing Industry Revenue Million Forecast, by Country 2020 & 2033
- Table 98: Global Textile Machinery Manufacturing Industry Volume Billion Forecast, by Country 2020 & 2033
- Table 99: South Africa Textile Machinery Manufacturing Industry Revenue (Million) Forecast, by Application 2020 & 2033
- Table 100: South Africa Textile Machinery Manufacturing Industry Volume (Billion) Forecast, by Application 2020 & 2033
- Table 101: Saudi Arabia Textile Machinery Manufacturing Industry Revenue (Million) Forecast, by Application 2020 & 2033
- Table 102: Saudi Arabia Textile Machinery Manufacturing Industry Volume (Billion) Forecast, by Application 2020 & 2033
- Table 103: Rest of Middle East Textile Machinery Manufacturing Industry Revenue (Million) Forecast, by Application 2020 & 2033
- Table 104: Rest of Middle East Textile Machinery Manufacturing Industry Volume (Billion) Forecast, by Application 2020 & 2033
- Table 105: Global Textile Machinery Manufacturing Industry Revenue Million Forecast, by Raw Material 2020 & 2033
- Table 106: Global Textile Machinery Manufacturing Industry Volume Billion Forecast, by Raw Material 2020 & 2033
- Table 107: Global Textile Machinery Manufacturing Industry Revenue Million Forecast, by Machine Type 2020 & 2033
- Table 108: Global Textile Machinery Manufacturing Industry Volume Billion Forecast, by Machine Type 2020 & 2033
- Table 109: Global Textile Machinery Manufacturing Industry Revenue Million Forecast, by Distribution Channel 2020 & 2033
- Table 110: Global Textile Machinery Manufacturing Industry Volume Billion Forecast, by Distribution Channel 2020 & 2033
- Table 111: Global Textile Machinery Manufacturing Industry Revenue Million Forecast, by Application 2020 & 2033
- Table 112: Global Textile Machinery Manufacturing Industry Volume Billion Forecast, by Application 2020 & 2033
- Table 113: Global Textile Machinery Manufacturing Industry Revenue Million Forecast, by Country 2020 & 2033
- Table 114: Global Textile Machinery Manufacturing Industry Volume Billion Forecast, by Country 2020 & 2033
- Table 115: Brazil Textile Machinery Manufacturing Industry Revenue (Million) Forecast, by Application 2020 & 2033
- Table 116: Brazil Textile Machinery Manufacturing Industry Volume (Billion) Forecast, by Application 2020 & 2033
- Table 117: Argentina Textile Machinery Manufacturing Industry Revenue (Million) Forecast, by Application 2020 & 2033
- Table 118: Argentina Textile Machinery Manufacturing Industry Volume (Billion) Forecast, by Application 2020 & 2033
- Table 119: Rest of South America Textile Machinery Manufacturing Industry Revenue (Million) Forecast, by Application 2020 & 2033
- Table 120: Rest of South America Textile Machinery Manufacturing Industry Volume (Billion) Forecast, by Application 2020 & 2033
Frequently Asked Questions
1. What is the projected Compound Annual Growth Rate (CAGR) of the Textile Machinery Manufacturing Industry?
The projected CAGR is approximately 4.87%.
2. Which companies are prominent players in the Textile Machinery Manufacturing Industry?
Key companies in the market include OC Oerlikon, Trutzschler Group, Savio Macchine Tessili S p A, Rieter Holding AG, Lakshmi Machine Works Ltd, Murata Machinery Ltd, Santoni S p A, Saurer Intelligent Technlogy AG, TMT Machinery Inc, Mayer & Cie GmbH & Co KG**List Not Exhaustive 6 3 Other Companies (Overview/Key Information.
3. What are the main segments of the Textile Machinery Manufacturing Industry?
The market segments include Raw Material, Machine Type, Distribution Channel, Application.
4. Can you provide details about the market size?
The market size is estimated to be USD 31.67 Million as of 2022.
5. What are some drivers contributing to market growth?
N/A
6. What are the notable trends driving market growth?
Spinning Machine Segment is the Fastest Growing Machinery Segment.
7. Are there any restraints impacting market growth?
N/A
8. Can you provide examples of recent developments in the market?
June, 2022: Trützschler Nonwovens & Man-Made Fibers work with Texnology, an Italian textile machinery company, to develop full needle-punching lines. T-SUPREMA will be the brand name for the lines, which will be accessible immediately. Web bonding using steel needles is the most important manufacturing method in the dry-laid nonwoven industry. The majority of uses are of a technical nature, with the most significant being durable geotextiles, automotive textiles, and filter media.
9. What pricing options are available for accessing the report?
Pricing options include single-user, multi-user, and enterprise licenses priced at USD 4750, USD 5250, and USD 8750 respectively.
10. Is the market size provided in terms of value or volume?
The market size is provided in terms of value, measured in Million and volume, measured in Billion.
11. Are there any specific market keywords associated with the report?
Yes, the market keyword associated with the report is "Textile Machinery Manufacturing Industry," which aids in identifying and referencing the specific market segment covered.
12. How do I determine which pricing option suits my needs best?
The pricing options vary based on user requirements and access needs. Individual users may opt for single-user licenses, while businesses requiring broader access may choose multi-user or enterprise licenses for cost-effective access to the report.
13. Are there any additional resources or data provided in the Textile Machinery Manufacturing Industry report?
While the report offers comprehensive insights, it's advisable to review the specific contents or supplementary materials provided to ascertain if additional resources or data are available.
14. How can I stay updated on further developments or reports in the Textile Machinery Manufacturing Industry?
To stay informed about further developments, trends, and reports in the Textile Machinery Manufacturing Industry, consider subscribing to industry newsletters, following relevant companies and organizations, or regularly checking reputable industry news sources and publications.
Methodology
Step 1 - Identification of Relevant Samples Size from Population Database


Step 2 - Approaches for Defining Global Market Size (Value, Volume* & Price*)

Note*: In applicable scenarios
Step 3 - Data Sources
Primary Research
- Web Analytics
- Survey Reports
- Research Institute
- Latest Research Reports
- Opinion Leaders
Secondary Research
- Annual Reports
- White Paper
- Latest Press Release
- Industry Association
- Paid Database
- Investor Presentations

Step 4 - Data Triangulation
Involves using different sources of information in order to increase the validity of a study
These sources are likely to be stakeholders in a program - participants, other researchers, program staff, other community members, and so on.
Then we put all data in single framework & apply various statistical tools to find out the dynamic on the market.
During the analysis stage, feedback from the stakeholder groups would be compared to determine areas of agreement as well as areas of divergence

