
Key Insights
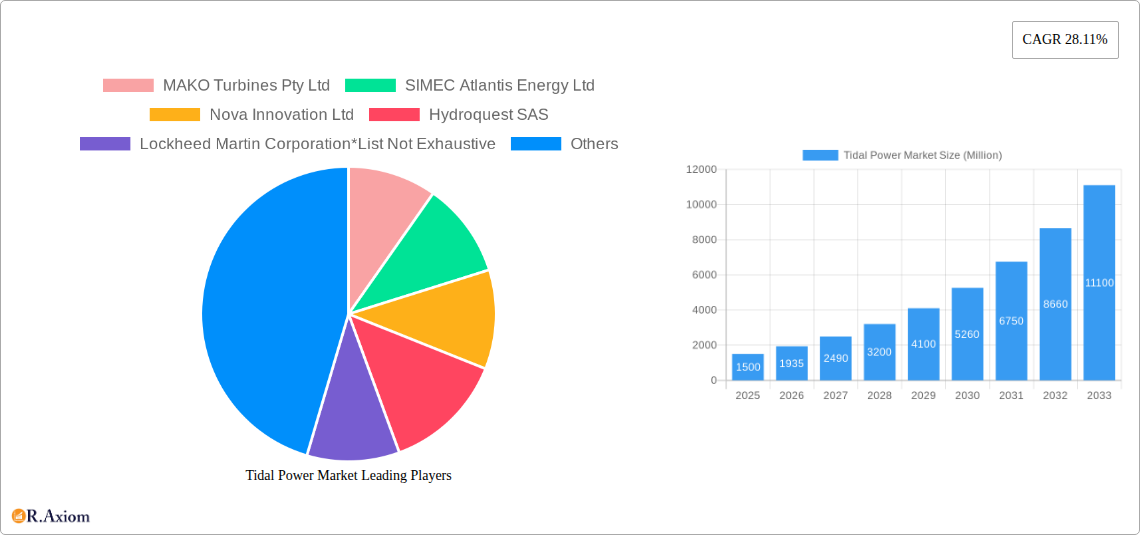
The global tidal power market is experiencing robust growth, projected to reach a significant size driven by increasing concerns about climate change and the urgent need for sustainable energy solutions. The market's Compound Annual Growth Rate (CAGR) of 28.11% from 2019 to 2024 indicates a strong upward trajectory. This growth is fueled by several key drivers: government incentives and policies promoting renewable energy adoption, technological advancements leading to more efficient and cost-effective tidal energy converters (particularly horizontal axis turbines which currently dominate the market), and a growing awareness of tidal energy's predictable and reliable nature compared to other renewable sources like solar and wind. Furthermore, the diversification of tidal energy generation methods, including tidal barrages, floating platforms, and tidal stream generation, offers opportunities for deployment in diverse geographical locations. While challenges remain, such as high initial capital costs, environmental concerns regarding marine life, and grid integration complexities, ongoing research and development are actively addressing these limitations. The market is segmented by power generation method and tidal energy converter type, with horizontal axis turbines holding a significant share currently. Key players, including MAKO Turbines Pty Ltd, SIMEC Atlantis Energy Ltd, and Orbital Marine Power Ltd, are actively shaping the market landscape through innovation and strategic partnerships. Geographic expansion is also anticipated, with North America and Europe leading the market initially, followed by increasing contributions from Asia-Pacific and other regions as suitable locations are identified and infrastructure develops.
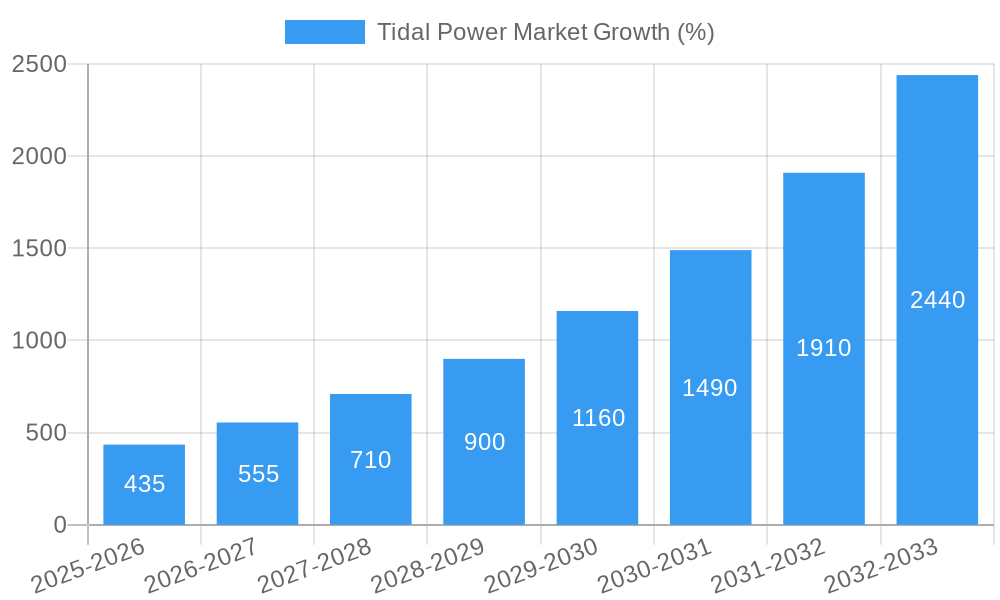
The forecast period (2025-2033) anticipates continued expansion, driven by the factors mentioned above. The market's growth will likely be influenced by the success of ongoing large-scale projects, improvements in energy storage technology (critical for mitigating tidal energy's intermittency), and decreasing production costs due to economies of scale and technological advancements. The consistent and predictable nature of tidal energy offers a crucial advantage in diversifying energy portfolios and enhancing energy security, contributing significantly to the overall growth. Specific regional growth rates will vary based on policy support, available resources, and the willingness to invest in necessary infrastructure. However, given the global trend towards renewable energy sources, the tidal power market is poised for substantial and sustained growth over the coming decade.
Tidal Power Market: A Comprehensive Report (2019-2033)
This comprehensive report provides an in-depth analysis of the global tidal power market, covering the period 2019-2033, with a focus on market size, growth drivers, challenges, and key players. The report utilizes data from 2019-2024 (Historical Period) as a baseline for projecting market trends from 2025 (Base Year and Estimated Year) to 2033 (Forecast Period). This study offers actionable insights for industry stakeholders, investors, and policymakers seeking to navigate this burgeoning sector.
Tidal Power Market Concentration & Innovation
The tidal power market is characterized by a moderate level of concentration, with a few major players dominating specific segments. Market share analysis reveals that while a handful of companies hold significant positions, the market exhibits considerable fragmentation, particularly in the emerging tidal stream generation sector. Innovation is a key driver, with continuous advancements in tidal energy converters and power generation methods. Regulatory frameworks, while varying across regions, are increasingly supportive of renewable energy development, influencing market growth. Product substitutes, mainly conventional energy sources, are facing increasing competition due to rising environmental concerns and policy changes. End-user trends show a growing demand for clean and sustainable energy sources, bolstering the market's growth. M&A activity in the sector remains relatively low with an estimated total deal value of xx Million in the period of 2019-2024, reflecting a strategic focus on organic growth and technology development.
- Market Share: The top 5 companies account for approximately xx% of the market share in 2025, with the remaining xx% distributed among numerous smaller players.
- M&A Deal Values: Total M&A deal value estimated at xx Million in the historical period.
Tidal Power Market Industry Trends & Insights
The global tidal power market is experiencing robust growth, driven by increasing concerns about climate change and the need for renewable energy solutions. Technological advancements, particularly in tidal energy converters and energy storage systems, are significantly improving the efficiency and cost-effectiveness of tidal power generation. Consumer preferences are shifting towards sustainable energy options, creating substantial demand. However, competitive dynamics remain intense, with established players facing challenges from emerging technologies and new entrants. The Compound Annual Growth Rate (CAGR) for the forecast period (2025-2033) is projected to be xx%, driven by supportive government policies and increasing private sector investments. Market penetration is expected to increase from xx% in 2025 to xx% by 2033.
Dominant Markets & Segments in Tidal Power Market
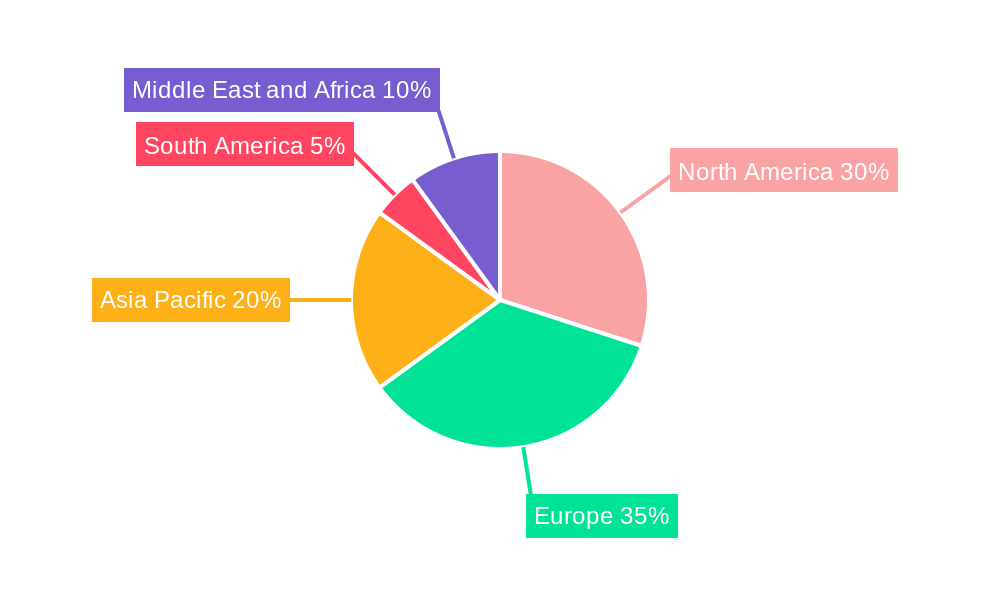
The European region, particularly the UK, currently dominates the tidal power market due to favorable government policies, substantial investment, and technological advancements. However, Asia-Pacific is emerging as a key growth region, with significant potential for development.
Power Generation Method: Tidal stream generation currently holds the largest market share, followed by floating tidal power platforms. Tidal barrage technology, while mature, faces limitations due to its high capital costs and site-specific requirements. Dynamic tidal power remains a niche segment with considerable growth potential.
- Key Drivers (Tidal Stream Generation): Technological advancements, increasing grid infrastructure, supportive government policies.
- Key Drivers (Floating Tidal Power Platforms): Reduced environmental impact, suitability for diverse sites.
Tidal Energy Converters: Horizontal axis turbines currently dominate the market, owing to their established technology and cost-effectiveness. However, vertical axis turbines are gaining traction due to their suitability for diverse flow conditions and reduced maintenance needs. Other tidal energy converters, including wave-powered systems, represent a smaller but rapidly growing segment.
- Key Drivers (Horizontal Axis Turbine): Mature technology, cost-effectiveness.
- Key Drivers (Vertical Axis Turbine): Suitability for diverse flow conditions.
Tidal Power Market Product Developments
Recent product innovations focus on improving the efficiency, reliability, and cost-effectiveness of tidal energy converters. New materials, advanced control systems, and streamlined designs are enhancing energy capture and reducing operational costs. The market is witnessing increased integration of smart grids and energy storage solutions to improve grid stability and optimize power delivery. These developments improve market fit by addressing previously limiting factors such as efficiency, cost and grid integration.
Report Scope & Segmentation Analysis
This report comprehensively segments the tidal power market based on power generation methods (Tidal Barrage, Floating Tidal Power Platform, Tidal Stream Generation, Dynamic Tidal Power) and tidal energy converters (Horizontal Axis Turbine, Vertical Axis Turbine, Other Tidal Energy Converters). Each segment's growth projections, market sizes, and competitive dynamics are detailed. Projected growth in each segment reflects technological advancements and market drivers unique to each category. Market sizes are provided for each segment for the forecast period (2025-2033).
Key Drivers of Tidal Power Market Growth
The market's growth is fueled by several factors: increasing demand for renewable energy, supportive government policies and incentives (e.g., tax breaks, feed-in tariffs), technological advancements leading to improved efficiency and reduced costs, and growing environmental awareness among consumers. Furthermore, falling capital costs for tidal energy technologies are making them increasingly competitive against traditional power sources.
Challenges in the Tidal Power Market Sector
Key challenges include the high initial capital costs associated with tidal power projects, the complex regulatory environment in many regions and environmental concerns related to marine ecosystems, requiring significant permitting processes. Furthermore, the supply chain for specific components can be limited, leading to potential bottlenecks. The intermittent nature of tidal energy also presents a challenge, necessitating effective energy storage and grid integration strategies.
Emerging Opportunities in Tidal Power Market
Significant opportunities exist in developing countries with abundant tidal resources and supportive government policies. Technological advancements, including the development of more efficient and cost-effective tidal energy converters and innovative energy storage solutions, will continue to open new markets. The integration of tidal power with other renewable energy sources, such as solar and wind, presents synergistic opportunities.
Leading Players in the Tidal Power Market Market
- MAKO Turbines Pty Ltd
- SIMEC Atlantis Energy Ltd
- Nova Innovation Ltd
- Hydroquest SAS
- Lockheed Martin Corporation
- Orbital Marine Power Ltd
- Sustainable Marine Energy Ltd
- Andritz AG
Key Developments in Tidal Power Market Industry
- March 2023: A grid-independent tidal energy demonstration project in Singapore, involving NYK and Bluenergy Solutions, commenced power generation, marking a significant step towards commercialization in Southeast Asia.
- March 2023: Walton Marina supported BigMoon Power's tidal energy project in Minas Basin by providing a facility for launching anchors, highlighting the collaborative nature of the industry.
- September 2022: Sabella, in partnership with Indonesian corporations PT PLN (Persero) and PT Meindo Elang Indah, initiated a feasibility study for a large-scale tidal farm in Indonesia, signaling expansion into new markets.
Strategic Outlook for Tidal Power Market Market
The tidal power market shows significant long-term growth potential, driven by supportive government policies, technological innovation, and increasing environmental concerns. Further advancements in energy storage and grid integration technologies will be crucial in unlocking the full potential of tidal energy. The market is expected to experience substantial expansion in the coming years, offering lucrative opportunities for both established players and new entrants.
Tidal Power Market Segmentation
-
1. Power Generation Method
- 1.1. Tidal Barrage
- 1.2. Floating Tidal Power Platform
- 1.3. Tidal Stream Generation
- 1.4. Dynamic Tidal Power
-
2. Tidal Energy Converters
- 2.1. Horizontal Axis Turbine
- 2.2. Vertical Axis Turbine
- 2.3. Other Tidal Energy Converters
Tidal Power Market Segmentation By Geography
-
1. North America
- 1.1. United States
- 1.2. Canada
- 1.3. Rest of North America
-
2. Europe
- 2.1. United Kingdom
- 2.2. Denmark
- 2.3. France
- 2.4. Rest of the Europe
-
3. Asia Pacific
- 3.1. China
- 3.2. India
- 3.3. Japan
- 3.4. Rest of the Asia Pacific
-
4. South America
- 4.1. Brazil
- 4.2. Argentina
- 4.3. Rest of South America
-
5. Middle East and Africa
- 5.1. United Arab Emirates
- 5.2. South Africa
- 5.3. Saudi Arabia
- 5.4. Rest of Middle East and Africa
Tidal Power Market REPORT HIGHLIGHTS
| Aspects | Details |
|---|---|
| Study Period | 2019-2033 |
| Base Year | 2024 |
| Estimated Year | 2025 |
| Forecast Period | 2025-2033 |
| Historical Period | 2019-2024 |
| Growth Rate | CAGR of 28.11% from 2019-2033 |
| Segmentation |
|
Table of Contents
- 1. Introduction
- 1.1. Research Scope
- 1.2. Market Segmentation
- 1.3. Research Methodology
- 1.4. Definitions and Assumptions
- 2. Executive Summary
- 2.1. Introduction
- 3. Market Dynamics
- 3.1. Introduction
- 3.2. Market Drivers
- 3.2.1. 4.; Global Energy Transition Toward Renewables4.; The Rollout of New Technologies in Many Developed Countries
- 3.3. Market Restrains
- 3.3.1. 4.; The Technology's Exorbitant Costs and Environmental Impacts
- 3.4. Market Trends
- 3.4.1. Floating Tidal Power Platform Expected to Witness Significant Growth
- 4. Market Factor Analysis
- 4.1. Porters Five Forces
- 4.2. Supply/Value Chain
- 4.3. PESTEL analysis
- 4.4. Market Entropy
- 4.5. Patent/Trademark Analysis
- 5. Global Tidal Power Market Analysis, Insights and Forecast, 2019-2031
- 5.1. Market Analysis, Insights and Forecast - by Power Generation Method
- 5.1.1. Tidal Barrage
- 5.1.2. Floating Tidal Power Platform
- 5.1.3. Tidal Stream Generation
- 5.1.4. Dynamic Tidal Power
- 5.2. Market Analysis, Insights and Forecast - by Tidal Energy Converters
- 5.2.1. Horizontal Axis Turbine
- 5.2.2. Vertical Axis Turbine
- 5.2.3. Other Tidal Energy Converters
- 5.3. Market Analysis, Insights and Forecast - by Region
- 5.3.1. North America
- 5.3.2. Europe
- 5.3.3. Asia Pacific
- 5.3.4. South America
- 5.3.5. Middle East and Africa
- 5.1. Market Analysis, Insights and Forecast - by Power Generation Method
- 6. North America Tidal Power Market Analysis, Insights and Forecast, 2019-2031
- 6.1. Market Analysis, Insights and Forecast - by Power Generation Method
- 6.1.1. Tidal Barrage
- 6.1.2. Floating Tidal Power Platform
- 6.1.3. Tidal Stream Generation
- 6.1.4. Dynamic Tidal Power
- 6.2. Market Analysis, Insights and Forecast - by Tidal Energy Converters
- 6.2.1. Horizontal Axis Turbine
- 6.2.2. Vertical Axis Turbine
- 6.2.3. Other Tidal Energy Converters
- 6.1. Market Analysis, Insights and Forecast - by Power Generation Method
- 7. Europe Tidal Power Market Analysis, Insights and Forecast, 2019-2031
- 7.1. Market Analysis, Insights and Forecast - by Power Generation Method
- 7.1.1. Tidal Barrage
- 7.1.2. Floating Tidal Power Platform
- 7.1.3. Tidal Stream Generation
- 7.1.4. Dynamic Tidal Power
- 7.2. Market Analysis, Insights and Forecast - by Tidal Energy Converters
- 7.2.1. Horizontal Axis Turbine
- 7.2.2. Vertical Axis Turbine
- 7.2.3. Other Tidal Energy Converters
- 7.1. Market Analysis, Insights and Forecast - by Power Generation Method
- 8. Asia Pacific Tidal Power Market Analysis, Insights and Forecast, 2019-2031
- 8.1. Market Analysis, Insights and Forecast - by Power Generation Method
- 8.1.1. Tidal Barrage
- 8.1.2. Floating Tidal Power Platform
- 8.1.3. Tidal Stream Generation
- 8.1.4. Dynamic Tidal Power
- 8.2. Market Analysis, Insights and Forecast - by Tidal Energy Converters
- 8.2.1. Horizontal Axis Turbine
- 8.2.2. Vertical Axis Turbine
- 8.2.3. Other Tidal Energy Converters
- 8.1. Market Analysis, Insights and Forecast - by Power Generation Method
- 9. South America Tidal Power Market Analysis, Insights and Forecast, 2019-2031
- 9.1. Market Analysis, Insights and Forecast - by Power Generation Method
- 9.1.1. Tidal Barrage
- 9.1.2. Floating Tidal Power Platform
- 9.1.3. Tidal Stream Generation
- 9.1.4. Dynamic Tidal Power
- 9.2. Market Analysis, Insights and Forecast - by Tidal Energy Converters
- 9.2.1. Horizontal Axis Turbine
- 9.2.2. Vertical Axis Turbine
- 9.2.3. Other Tidal Energy Converters
- 9.1. Market Analysis, Insights and Forecast - by Power Generation Method
- 10. Middle East and Africa Tidal Power Market Analysis, Insights and Forecast, 2019-2031
- 10.1. Market Analysis, Insights and Forecast - by Power Generation Method
- 10.1.1. Tidal Barrage
- 10.1.2. Floating Tidal Power Platform
- 10.1.3. Tidal Stream Generation
- 10.1.4. Dynamic Tidal Power
- 10.2. Market Analysis, Insights and Forecast - by Tidal Energy Converters
- 10.2.1. Horizontal Axis Turbine
- 10.2.2. Vertical Axis Turbine
- 10.2.3. Other Tidal Energy Converters
- 10.1. Market Analysis, Insights and Forecast - by Power Generation Method
- 11. North America Tidal Power Market Analysis, Insights and Forecast, 2019-2031
- 11.1. Market Analysis, Insights and Forecast - By Country/Sub-region
- 11.1.1 United States
- 11.1.2 Canada
- 11.1.3 Rest of North America
- 12. Europe Tidal Power Market Analysis, Insights and Forecast, 2019-2031
- 12.1. Market Analysis, Insights and Forecast - By Country/Sub-region
- 12.1.1 United Kingdom
- 12.1.2 Denmark
- 12.1.3 France
- 12.1.4 Rest of the Europe
- 13. Asia Pacific Tidal Power Market Analysis, Insights and Forecast, 2019-2031
- 13.1. Market Analysis, Insights and Forecast - By Country/Sub-region
- 13.1.1 China
- 13.1.2 India
- 13.1.3 Japan
- 13.1.4 Rest of the Asia Pacific
- 14. South America Tidal Power Market Analysis, Insights and Forecast, 2019-2031
- 14.1. Market Analysis, Insights and Forecast - By Country/Sub-region
- 14.1.1 Brazil
- 14.1.2 Argentina
- 14.1.3 Rest of South America
- 15. Middle East and Africa Tidal Power Market Analysis, Insights and Forecast, 2019-2031
- 15.1. Market Analysis, Insights and Forecast - By Country/Sub-region
- 15.1.1 United Arab Emirates
- 15.1.2 South Africa
- 15.1.3 Saudi Arabia
- 15.1.4 Rest of Middle East and Africa
- 16. Competitive Analysis
- 16.1. Global Market Share Analysis 2024
- 16.2. Company Profiles
- 16.2.1 MAKO Turbines Pty Ltd
- 16.2.1.1. Overview
- 16.2.1.2. Products
- 16.2.1.3. SWOT Analysis
- 16.2.1.4. Recent Developments
- 16.2.1.5. Financials (Based on Availability)
- 16.2.2 SIMEC Atlantis Energy Ltd
- 16.2.2.1. Overview
- 16.2.2.2. Products
- 16.2.2.3. SWOT Analysis
- 16.2.2.4. Recent Developments
- 16.2.2.5. Financials (Based on Availability)
- 16.2.3 Nova Innovation Ltd
- 16.2.3.1. Overview
- 16.2.3.2. Products
- 16.2.3.3. SWOT Analysis
- 16.2.3.4. Recent Developments
- 16.2.3.5. Financials (Based on Availability)
- 16.2.4 Hydroquest SAS
- 16.2.4.1. Overview
- 16.2.4.2. Products
- 16.2.4.3. SWOT Analysis
- 16.2.4.4. Recent Developments
- 16.2.4.5. Financials (Based on Availability)
- 16.2.5 Lockheed Martin Corporation*List Not Exhaustive
- 16.2.5.1. Overview
- 16.2.5.2. Products
- 16.2.5.3. SWOT Analysis
- 16.2.5.4. Recent Developments
- 16.2.5.5. Financials (Based on Availability)
- 16.2.6 Orbital Marine Power Ltd
- 16.2.6.1. Overview
- 16.2.6.2. Products
- 16.2.6.3. SWOT Analysis
- 16.2.6.4. Recent Developments
- 16.2.6.5. Financials (Based on Availability)
- 16.2.7 Sustainable Marine Energy Ltd
- 16.2.7.1. Overview
- 16.2.7.2. Products
- 16.2.7.3. SWOT Analysis
- 16.2.7.4. Recent Developments
- 16.2.7.5. Financials (Based on Availability)
- 16.2.8 Andritz AG
- 16.2.8.1. Overview
- 16.2.8.2. Products
- 16.2.8.3. SWOT Analysis
- 16.2.8.4. Recent Developments
- 16.2.8.5. Financials (Based on Availability)
- 16.2.1 MAKO Turbines Pty Ltd
List of Figures
- Figure 1: Global Tidal Power Market Revenue Breakdown (Million, %) by Region 2024 & 2032
- Figure 2: Global Tidal Power Market Volume Breakdown (gigawatt, %) by Region 2024 & 2032
- Figure 3: North America Tidal Power Market Revenue (Million), by Country 2024 & 2032
- Figure 4: North America Tidal Power Market Volume (gigawatt), by Country 2024 & 2032
- Figure 5: North America Tidal Power Market Revenue Share (%), by Country 2024 & 2032
- Figure 6: North America Tidal Power Market Volume Share (%), by Country 2024 & 2032
- Figure 7: Europe Tidal Power Market Revenue (Million), by Country 2024 & 2032
- Figure 8: Europe Tidal Power Market Volume (gigawatt), by Country 2024 & 2032
- Figure 9: Europe Tidal Power Market Revenue Share (%), by Country 2024 & 2032
- Figure 10: Europe Tidal Power Market Volume Share (%), by Country 2024 & 2032
- Figure 11: Asia Pacific Tidal Power Market Revenue (Million), by Country 2024 & 2032
- Figure 12: Asia Pacific Tidal Power Market Volume (gigawatt), by Country 2024 & 2032
- Figure 13: Asia Pacific Tidal Power Market Revenue Share (%), by Country 2024 & 2032
- Figure 14: Asia Pacific Tidal Power Market Volume Share (%), by Country 2024 & 2032
- Figure 15: South America Tidal Power Market Revenue (Million), by Country 2024 & 2032
- Figure 16: South America Tidal Power Market Volume (gigawatt), by Country 2024 & 2032
- Figure 17: South America Tidal Power Market Revenue Share (%), by Country 2024 & 2032
- Figure 18: South America Tidal Power Market Volume Share (%), by Country 2024 & 2032
- Figure 19: Middle East and Africa Tidal Power Market Revenue (Million), by Country 2024 & 2032
- Figure 20: Middle East and Africa Tidal Power Market Volume (gigawatt), by Country 2024 & 2032
- Figure 21: Middle East and Africa Tidal Power Market Revenue Share (%), by Country 2024 & 2032
- Figure 22: Middle East and Africa Tidal Power Market Volume Share (%), by Country 2024 & 2032
- Figure 23: North America Tidal Power Market Revenue (Million), by Power Generation Method 2024 & 2032
- Figure 24: North America Tidal Power Market Volume (gigawatt), by Power Generation Method 2024 & 2032
- Figure 25: North America Tidal Power Market Revenue Share (%), by Power Generation Method 2024 & 2032
- Figure 26: North America Tidal Power Market Volume Share (%), by Power Generation Method 2024 & 2032
- Figure 27: North America Tidal Power Market Revenue (Million), by Tidal Energy Converters 2024 & 2032
- Figure 28: North America Tidal Power Market Volume (gigawatt), by Tidal Energy Converters 2024 & 2032
- Figure 29: North America Tidal Power Market Revenue Share (%), by Tidal Energy Converters 2024 & 2032
- Figure 30: North America Tidal Power Market Volume Share (%), by Tidal Energy Converters 2024 & 2032
- Figure 31: North America Tidal Power Market Revenue (Million), by Country 2024 & 2032
- Figure 32: North America Tidal Power Market Volume (gigawatt), by Country 2024 & 2032
- Figure 33: North America Tidal Power Market Revenue Share (%), by Country 2024 & 2032
- Figure 34: North America Tidal Power Market Volume Share (%), by Country 2024 & 2032
- Figure 35: Europe Tidal Power Market Revenue (Million), by Power Generation Method 2024 & 2032
- Figure 36: Europe Tidal Power Market Volume (gigawatt), by Power Generation Method 2024 & 2032
- Figure 37: Europe Tidal Power Market Revenue Share (%), by Power Generation Method 2024 & 2032
- Figure 38: Europe Tidal Power Market Volume Share (%), by Power Generation Method 2024 & 2032
- Figure 39: Europe Tidal Power Market Revenue (Million), by Tidal Energy Converters 2024 & 2032
- Figure 40: Europe Tidal Power Market Volume (gigawatt), by Tidal Energy Converters 2024 & 2032
- Figure 41: Europe Tidal Power Market Revenue Share (%), by Tidal Energy Converters 2024 & 2032
- Figure 42: Europe Tidal Power Market Volume Share (%), by Tidal Energy Converters 2024 & 2032
- Figure 43: Europe Tidal Power Market Revenue (Million), by Country 2024 & 2032
- Figure 44: Europe Tidal Power Market Volume (gigawatt), by Country 2024 & 2032
- Figure 45: Europe Tidal Power Market Revenue Share (%), by Country 2024 & 2032
- Figure 46: Europe Tidal Power Market Volume Share (%), by Country 2024 & 2032
- Figure 47: Asia Pacific Tidal Power Market Revenue (Million), by Power Generation Method 2024 & 2032
- Figure 48: Asia Pacific Tidal Power Market Volume (gigawatt), by Power Generation Method 2024 & 2032
- Figure 49: Asia Pacific Tidal Power Market Revenue Share (%), by Power Generation Method 2024 & 2032
- Figure 50: Asia Pacific Tidal Power Market Volume Share (%), by Power Generation Method 2024 & 2032
- Figure 51: Asia Pacific Tidal Power Market Revenue (Million), by Tidal Energy Converters 2024 & 2032
- Figure 52: Asia Pacific Tidal Power Market Volume (gigawatt), by Tidal Energy Converters 2024 & 2032
- Figure 53: Asia Pacific Tidal Power Market Revenue Share (%), by Tidal Energy Converters 2024 & 2032
- Figure 54: Asia Pacific Tidal Power Market Volume Share (%), by Tidal Energy Converters 2024 & 2032
- Figure 55: Asia Pacific Tidal Power Market Revenue (Million), by Country 2024 & 2032
- Figure 56: Asia Pacific Tidal Power Market Volume (gigawatt), by Country 2024 & 2032
- Figure 57: Asia Pacific Tidal Power Market Revenue Share (%), by Country 2024 & 2032
- Figure 58: Asia Pacific Tidal Power Market Volume Share (%), by Country 2024 & 2032
- Figure 59: South America Tidal Power Market Revenue (Million), by Power Generation Method 2024 & 2032
- Figure 60: South America Tidal Power Market Volume (gigawatt), by Power Generation Method 2024 & 2032
- Figure 61: South America Tidal Power Market Revenue Share (%), by Power Generation Method 2024 & 2032
- Figure 62: South America Tidal Power Market Volume Share (%), by Power Generation Method 2024 & 2032
- Figure 63: South America Tidal Power Market Revenue (Million), by Tidal Energy Converters 2024 & 2032
- Figure 64: South America Tidal Power Market Volume (gigawatt), by Tidal Energy Converters 2024 & 2032
- Figure 65: South America Tidal Power Market Revenue Share (%), by Tidal Energy Converters 2024 & 2032
- Figure 66: South America Tidal Power Market Volume Share (%), by Tidal Energy Converters 2024 & 2032
- Figure 67: South America Tidal Power Market Revenue (Million), by Country 2024 & 2032
- Figure 68: South America Tidal Power Market Volume (gigawatt), by Country 2024 & 2032
- Figure 69: South America Tidal Power Market Revenue Share (%), by Country 2024 & 2032
- Figure 70: South America Tidal Power Market Volume Share (%), by Country 2024 & 2032
- Figure 71: Middle East and Africa Tidal Power Market Revenue (Million), by Power Generation Method 2024 & 2032
- Figure 72: Middle East and Africa Tidal Power Market Volume (gigawatt), by Power Generation Method 2024 & 2032
- Figure 73: Middle East and Africa Tidal Power Market Revenue Share (%), by Power Generation Method 2024 & 2032
- Figure 74: Middle East and Africa Tidal Power Market Volume Share (%), by Power Generation Method 2024 & 2032
- Figure 75: Middle East and Africa Tidal Power Market Revenue (Million), by Tidal Energy Converters 2024 & 2032
- Figure 76: Middle East and Africa Tidal Power Market Volume (gigawatt), by Tidal Energy Converters 2024 & 2032
- Figure 77: Middle East and Africa Tidal Power Market Revenue Share (%), by Tidal Energy Converters 2024 & 2032
- Figure 78: Middle East and Africa Tidal Power Market Volume Share (%), by Tidal Energy Converters 2024 & 2032
- Figure 79: Middle East and Africa Tidal Power Market Revenue (Million), by Country 2024 & 2032
- Figure 80: Middle East and Africa Tidal Power Market Volume (gigawatt), by Country 2024 & 2032
- Figure 81: Middle East and Africa Tidal Power Market Revenue Share (%), by Country 2024 & 2032
- Figure 82: Middle East and Africa Tidal Power Market Volume Share (%), by Country 2024 & 2032
List of Tables
- Table 1: Global Tidal Power Market Revenue Million Forecast, by Region 2019 & 2032
- Table 2: Global Tidal Power Market Volume gigawatt Forecast, by Region 2019 & 2032
- Table 3: Global Tidal Power Market Revenue Million Forecast, by Power Generation Method 2019 & 2032
- Table 4: Global Tidal Power Market Volume gigawatt Forecast, by Power Generation Method 2019 & 2032
- Table 5: Global Tidal Power Market Revenue Million Forecast, by Tidal Energy Converters 2019 & 2032
- Table 6: Global Tidal Power Market Volume gigawatt Forecast, by Tidal Energy Converters 2019 & 2032
- Table 7: Global Tidal Power Market Revenue Million Forecast, by Region 2019 & 2032
- Table 8: Global Tidal Power Market Volume gigawatt Forecast, by Region 2019 & 2032
- Table 9: Global Tidal Power Market Revenue Million Forecast, by Country 2019 & 2032
- Table 10: Global Tidal Power Market Volume gigawatt Forecast, by Country 2019 & 2032
- Table 11: United States Tidal Power Market Revenue (Million) Forecast, by Application 2019 & 2032
- Table 12: United States Tidal Power Market Volume (gigawatt) Forecast, by Application 2019 & 2032
- Table 13: Canada Tidal Power Market Revenue (Million) Forecast, by Application 2019 & 2032
- Table 14: Canada Tidal Power Market Volume (gigawatt) Forecast, by Application 2019 & 2032
- Table 15: Rest of North America Tidal Power Market Revenue (Million) Forecast, by Application 2019 & 2032
- Table 16: Rest of North America Tidal Power Market Volume (gigawatt) Forecast, by Application 2019 & 2032
- Table 17: Global Tidal Power Market Revenue Million Forecast, by Country 2019 & 2032
- Table 18: Global Tidal Power Market Volume gigawatt Forecast, by Country 2019 & 2032
- Table 19: United Kingdom Tidal Power Market Revenue (Million) Forecast, by Application 2019 & 2032
- Table 20: United Kingdom Tidal Power Market Volume (gigawatt) Forecast, by Application 2019 & 2032
- Table 21: Denmark Tidal Power Market Revenue (Million) Forecast, by Application 2019 & 2032
- Table 22: Denmark Tidal Power Market Volume (gigawatt) Forecast, by Application 2019 & 2032
- Table 23: France Tidal Power Market Revenue (Million) Forecast, by Application 2019 & 2032
- Table 24: France Tidal Power Market Volume (gigawatt) Forecast, by Application 2019 & 2032
- Table 25: Rest of the Europe Tidal Power Market Revenue (Million) Forecast, by Application 2019 & 2032
- Table 26: Rest of the Europe Tidal Power Market Volume (gigawatt) Forecast, by Application 2019 & 2032
- Table 27: Global Tidal Power Market Revenue Million Forecast, by Country 2019 & 2032
- Table 28: Global Tidal Power Market Volume gigawatt Forecast, by Country 2019 & 2032
- Table 29: China Tidal Power Market Revenue (Million) Forecast, by Application 2019 & 2032
- Table 30: China Tidal Power Market Volume (gigawatt) Forecast, by Application 2019 & 2032
- Table 31: India Tidal Power Market Revenue (Million) Forecast, by Application 2019 & 2032
- Table 32: India Tidal Power Market Volume (gigawatt) Forecast, by Application 2019 & 2032
- Table 33: Japan Tidal Power Market Revenue (Million) Forecast, by Application 2019 & 2032
- Table 34: Japan Tidal Power Market Volume (gigawatt) Forecast, by Application 2019 & 2032
- Table 35: Rest of the Asia Pacific Tidal Power Market Revenue (Million) Forecast, by Application 2019 & 2032
- Table 36: Rest of the Asia Pacific Tidal Power Market Volume (gigawatt) Forecast, by Application 2019 & 2032
- Table 37: Global Tidal Power Market Revenue Million Forecast, by Country 2019 & 2032
- Table 38: Global Tidal Power Market Volume gigawatt Forecast, by Country 2019 & 2032
- Table 39: Brazil Tidal Power Market Revenue (Million) Forecast, by Application 2019 & 2032
- Table 40: Brazil Tidal Power Market Volume (gigawatt) Forecast, by Application 2019 & 2032
- Table 41: Argentina Tidal Power Market Revenue (Million) Forecast, by Application 2019 & 2032
- Table 42: Argentina Tidal Power Market Volume (gigawatt) Forecast, by Application 2019 & 2032
- Table 43: Rest of South America Tidal Power Market Revenue (Million) Forecast, by Application 2019 & 2032
- Table 44: Rest of South America Tidal Power Market Volume (gigawatt) Forecast, by Application 2019 & 2032
- Table 45: Global Tidal Power Market Revenue Million Forecast, by Country 2019 & 2032
- Table 46: Global Tidal Power Market Volume gigawatt Forecast, by Country 2019 & 2032
- Table 47: United Arab Emirates Tidal Power Market Revenue (Million) Forecast, by Application 2019 & 2032
- Table 48: United Arab Emirates Tidal Power Market Volume (gigawatt) Forecast, by Application 2019 & 2032
- Table 49: South Africa Tidal Power Market Revenue (Million) Forecast, by Application 2019 & 2032
- Table 50: South Africa Tidal Power Market Volume (gigawatt) Forecast, by Application 2019 & 2032
- Table 51: Saudi Arabia Tidal Power Market Revenue (Million) Forecast, by Application 2019 & 2032
- Table 52: Saudi Arabia Tidal Power Market Volume (gigawatt) Forecast, by Application 2019 & 2032
- Table 53: Rest of Middle East and Africa Tidal Power Market Revenue (Million) Forecast, by Application 2019 & 2032
- Table 54: Rest of Middle East and Africa Tidal Power Market Volume (gigawatt) Forecast, by Application 2019 & 2032
- Table 55: Global Tidal Power Market Revenue Million Forecast, by Power Generation Method 2019 & 2032
- Table 56: Global Tidal Power Market Volume gigawatt Forecast, by Power Generation Method 2019 & 2032
- Table 57: Global Tidal Power Market Revenue Million Forecast, by Tidal Energy Converters 2019 & 2032
- Table 58: Global Tidal Power Market Volume gigawatt Forecast, by Tidal Energy Converters 2019 & 2032
- Table 59: Global Tidal Power Market Revenue Million Forecast, by Country 2019 & 2032
- Table 60: Global Tidal Power Market Volume gigawatt Forecast, by Country 2019 & 2032
- Table 61: United States Tidal Power Market Revenue (Million) Forecast, by Application 2019 & 2032
- Table 62: United States Tidal Power Market Volume (gigawatt) Forecast, by Application 2019 & 2032
- Table 63: Canada Tidal Power Market Revenue (Million) Forecast, by Application 2019 & 2032
- Table 64: Canada Tidal Power Market Volume (gigawatt) Forecast, by Application 2019 & 2032
- Table 65: Rest of North America Tidal Power Market Revenue (Million) Forecast, by Application 2019 & 2032
- Table 66: Rest of North America Tidal Power Market Volume (gigawatt) Forecast, by Application 2019 & 2032
- Table 67: Global Tidal Power Market Revenue Million Forecast, by Power Generation Method 2019 & 2032
- Table 68: Global Tidal Power Market Volume gigawatt Forecast, by Power Generation Method 2019 & 2032
- Table 69: Global Tidal Power Market Revenue Million Forecast, by Tidal Energy Converters 2019 & 2032
- Table 70: Global Tidal Power Market Volume gigawatt Forecast, by Tidal Energy Converters 2019 & 2032
- Table 71: Global Tidal Power Market Revenue Million Forecast, by Country 2019 & 2032
- Table 72: Global Tidal Power Market Volume gigawatt Forecast, by Country 2019 & 2032
- Table 73: United Kingdom Tidal Power Market Revenue (Million) Forecast, by Application 2019 & 2032
- Table 74: United Kingdom Tidal Power Market Volume (gigawatt) Forecast, by Application 2019 & 2032
- Table 75: Denmark Tidal Power Market Revenue (Million) Forecast, by Application 2019 & 2032
- Table 76: Denmark Tidal Power Market Volume (gigawatt) Forecast, by Application 2019 & 2032
- Table 77: France Tidal Power Market Revenue (Million) Forecast, by Application 2019 & 2032
- Table 78: France Tidal Power Market Volume (gigawatt) Forecast, by Application 2019 & 2032
- Table 79: Rest of the Europe Tidal Power Market Revenue (Million) Forecast, by Application 2019 & 2032
- Table 80: Rest of the Europe Tidal Power Market Volume (gigawatt) Forecast, by Application 2019 & 2032
- Table 81: Global Tidal Power Market Revenue Million Forecast, by Power Generation Method 2019 & 2032
- Table 82: Global Tidal Power Market Volume gigawatt Forecast, by Power Generation Method 2019 & 2032
- Table 83: Global Tidal Power Market Revenue Million Forecast, by Tidal Energy Converters 2019 & 2032
- Table 84: Global Tidal Power Market Volume gigawatt Forecast, by Tidal Energy Converters 2019 & 2032
- Table 85: Global Tidal Power Market Revenue Million Forecast, by Country 2019 & 2032
- Table 86: Global Tidal Power Market Volume gigawatt Forecast, by Country 2019 & 2032
- Table 87: China Tidal Power Market Revenue (Million) Forecast, by Application 2019 & 2032
- Table 88: China Tidal Power Market Volume (gigawatt) Forecast, by Application 2019 & 2032
- Table 89: India Tidal Power Market Revenue (Million) Forecast, by Application 2019 & 2032
- Table 90: India Tidal Power Market Volume (gigawatt) Forecast, by Application 2019 & 2032
- Table 91: Japan Tidal Power Market Revenue (Million) Forecast, by Application 2019 & 2032
- Table 92: Japan Tidal Power Market Volume (gigawatt) Forecast, by Application 2019 & 2032
- Table 93: Rest of the Asia Pacific Tidal Power Market Revenue (Million) Forecast, by Application 2019 & 2032
- Table 94: Rest of the Asia Pacific Tidal Power Market Volume (gigawatt) Forecast, by Application 2019 & 2032
- Table 95: Global Tidal Power Market Revenue Million Forecast, by Power Generation Method 2019 & 2032
- Table 96: Global Tidal Power Market Volume gigawatt Forecast, by Power Generation Method 2019 & 2032
- Table 97: Global Tidal Power Market Revenue Million Forecast, by Tidal Energy Converters 2019 & 2032
- Table 98: Global Tidal Power Market Volume gigawatt Forecast, by Tidal Energy Converters 2019 & 2032
- Table 99: Global Tidal Power Market Revenue Million Forecast, by Country 2019 & 2032
- Table 100: Global Tidal Power Market Volume gigawatt Forecast, by Country 2019 & 2032
- Table 101: Brazil Tidal Power Market Revenue (Million) Forecast, by Application 2019 & 2032
- Table 102: Brazil Tidal Power Market Volume (gigawatt) Forecast, by Application 2019 & 2032
- Table 103: Argentina Tidal Power Market Revenue (Million) Forecast, by Application 2019 & 2032
- Table 104: Argentina Tidal Power Market Volume (gigawatt) Forecast, by Application 2019 & 2032
- Table 105: Rest of South America Tidal Power Market Revenue (Million) Forecast, by Application 2019 & 2032
- Table 106: Rest of South America Tidal Power Market Volume (gigawatt) Forecast, by Application 2019 & 2032
- Table 107: Global Tidal Power Market Revenue Million Forecast, by Power Generation Method 2019 & 2032
- Table 108: Global Tidal Power Market Volume gigawatt Forecast, by Power Generation Method 2019 & 2032
- Table 109: Global Tidal Power Market Revenue Million Forecast, by Tidal Energy Converters 2019 & 2032
- Table 110: Global Tidal Power Market Volume gigawatt Forecast, by Tidal Energy Converters 2019 & 2032
- Table 111: Global Tidal Power Market Revenue Million Forecast, by Country 2019 & 2032
- Table 112: Global Tidal Power Market Volume gigawatt Forecast, by Country 2019 & 2032
- Table 113: United Arab Emirates Tidal Power Market Revenue (Million) Forecast, by Application 2019 & 2032
- Table 114: United Arab Emirates Tidal Power Market Volume (gigawatt) Forecast, by Application 2019 & 2032
- Table 115: South Africa Tidal Power Market Revenue (Million) Forecast, by Application 2019 & 2032
- Table 116: South Africa Tidal Power Market Volume (gigawatt) Forecast, by Application 2019 & 2032
- Table 117: Saudi Arabia Tidal Power Market Revenue (Million) Forecast, by Application 2019 & 2032
- Table 118: Saudi Arabia Tidal Power Market Volume (gigawatt) Forecast, by Application 2019 & 2032
- Table 119: Rest of Middle East and Africa Tidal Power Market Revenue (Million) Forecast, by Application 2019 & 2032
- Table 120: Rest of Middle East and Africa Tidal Power Market Volume (gigawatt) Forecast, by Application 2019 & 2032
Frequently Asked Questions
1. What is the projected Compound Annual Growth Rate (CAGR) of the Tidal Power Market?
The projected CAGR is approximately 28.11%.
2. Which companies are prominent players in the Tidal Power Market?
Key companies in the market include MAKO Turbines Pty Ltd, SIMEC Atlantis Energy Ltd, Nova Innovation Ltd, Hydroquest SAS, Lockheed Martin Corporation*List Not Exhaustive, Orbital Marine Power Ltd, Sustainable Marine Energy Ltd, Andritz AG.
3. What are the main segments of the Tidal Power Market?
The market segments include Power Generation Method, Tidal Energy Converters.
4. Can you provide details about the market size?
The market size is estimated to be USD XX Million as of 2022.
5. What are some drivers contributing to market growth?
4.; Global Energy Transition Toward Renewables4.; The Rollout of New Technologies in Many Developed Countries.
6. What are the notable trends driving market growth?
Floating Tidal Power Platform Expected to Witness Significant Growth.
7. Are there any restraints impacting market growth?
4.; The Technology's Exorbitant Costs and Environmental Impacts.
8. Can you provide examples of recent developments in the market?
March 2023, for the first time in Southeast Asia, a tidal-energy demonstration outside the grid in Singapore began generating power. NYK participated in this demonstration project, which is being run by Bluenergy Solutions, a marine renewable energy solutions developer, off Raffles Lighthouse on Satumu Island, some 14 kilometers off Singapore's main island. The project's goal is to commercialize tidal energy generation and supply.
9. What pricing options are available for accessing the report?
Pricing options include single-user, multi-user, and enterprise licenses priced at USD 4750, USD 5250, and USD 8750 respectively.
10. Is the market size provided in terms of value or volume?
The market size is provided in terms of value, measured in Million and volume, measured in gigawatt.
11. Are there any specific market keywords associated with the report?
Yes, the market keyword associated with the report is "Tidal Power Market," which aids in identifying and referencing the specific market segment covered.
12. How do I determine which pricing option suits my needs best?
The pricing options vary based on user requirements and access needs. Individual users may opt for single-user licenses, while businesses requiring broader access may choose multi-user or enterprise licenses for cost-effective access to the report.
13. Are there any additional resources or data provided in the Tidal Power Market report?
While the report offers comprehensive insights, it's advisable to review the specific contents or supplementary materials provided to ascertain if additional resources or data are available.
14. How can I stay updated on further developments or reports in the Tidal Power Market?
To stay informed about further developments, trends, and reports in the Tidal Power Market, consider subscribing to industry newsletters, following relevant companies and organizations, or regularly checking reputable industry news sources and publications.
Methodology
Step 1 - Identification of Relevant Samples Size from Population Database


Step 2 - Approaches for Defining Global Market Size (Value, Volume* & Price*)

Note*: In applicable scenarios
Step 3 - Data Sources
Primary Research
- Web Analytics
- Survey Reports
- Research Institute
- Latest Research Reports
- Opinion Leaders
Secondary Research
- Annual Reports
- White Paper
- Latest Press Release
- Industry Association
- Paid Database
- Investor Presentations

Step 4 - Data Triangulation
Involves using different sources of information in order to increase the validity of a study
These sources are likely to be stakeholders in a program - participants, other researchers, program staff, other community members, and so on.
Then we put all data in single framework & apply various statistical tools to find out the dynamic on the market.
During the analysis stage, feedback from the stakeholder groups would be compared to determine areas of agreement as well as areas of divergence


