
Key Insights
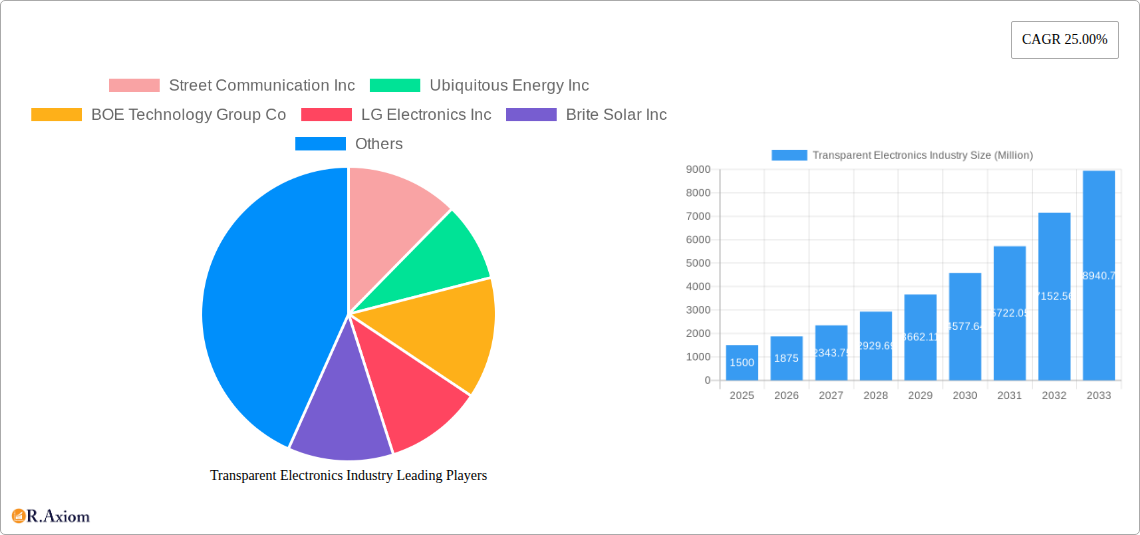
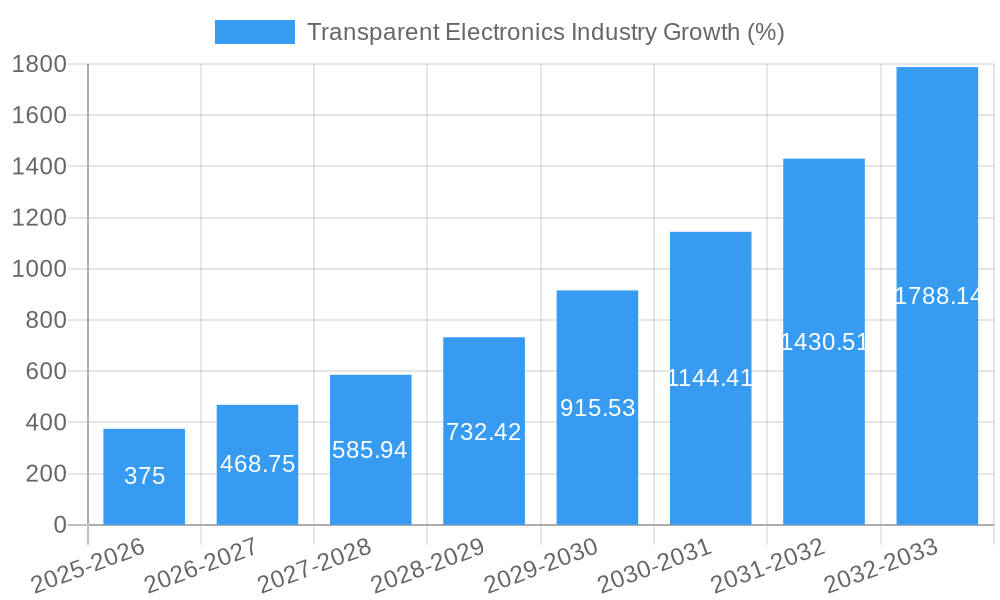
The transparent electronics market is experiencing explosive growth, projected to reach a substantial size by 2033, driven by a remarkable Compound Annual Growth Rate (CAGR) of 25%. This surge is fueled by several key factors. Firstly, increasing demand from the automotive sector for heads-up displays and other advanced driver-assistance systems (ADAS) is a significant driver. Secondly, the building infrastructure segment is adopting transparent electronics for smart windows and energy-efficient solutions, boosting market expansion. The consumer electronics industry also contributes significantly, with the integration of transparent displays in smartphones, wearable devices, and other innovative products. Technological advancements in materials science, leading to improved transparency, durability, and energy efficiency of transparent displays, solar panels, and smart windows, are further accelerating market growth. Competition among major players like BOE Technology Group, LG Electronics, and Panasonic, coupled with the emergence of innovative startups, fosters innovation and fuels market expansion.
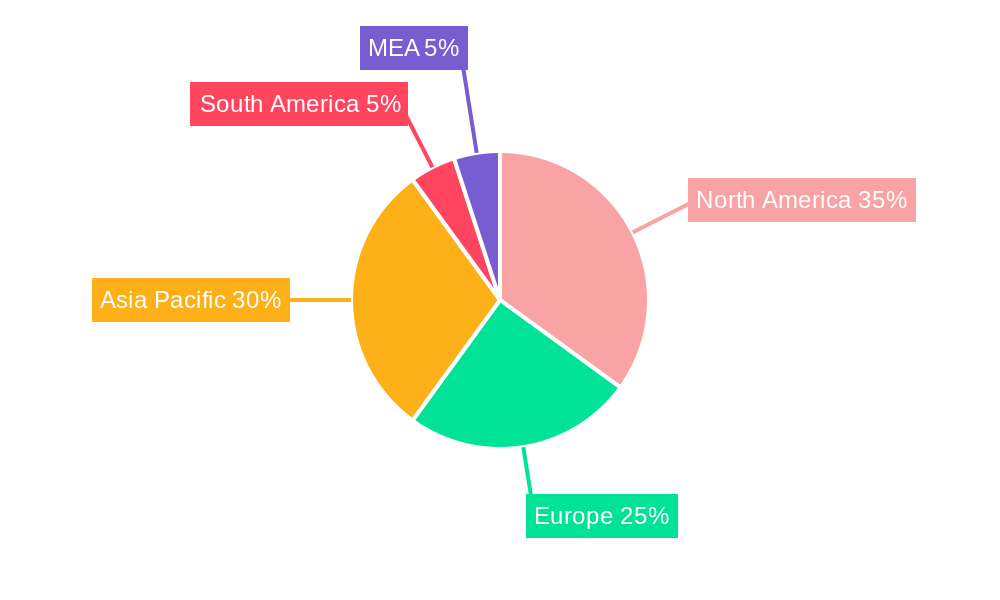
Despite the strong growth trajectory, certain restraints exist. High manufacturing costs associated with the complex fabrication processes involved in producing transparent electronics pose a challenge, limiting wider adoption, particularly in price-sensitive markets. Furthermore, the long-term reliability and durability of some transparent components need further improvement to ensure widespread consumer acceptance. Addressing these challenges will be crucial for unlocking the full potential of this dynamic market. Market segmentation by product type (transparent displays, solar panels, smart windows, etc.) and end-user industry allows for a granular understanding of market dynamics, enabling targeted investment and product development strategies for businesses operating in this sector. Regional analysis shows a strong presence of North America and Asia-Pacific, particularly China, while Europe and other regions are also witnessing substantial growth.
Transparent Electronics Industry: A Comprehensive Market Report (2019-2033)
This detailed report provides a comprehensive analysis of the Transparent Electronics industry, offering invaluable insights for stakeholders, investors, and industry professionals. The study covers the period from 2019 to 2033, with a focus on the forecast period of 2025-2033 and a base year of 2025. The report uses Million as the unit for all market values. Expected market size values where unavailable are represented by "xx".
Transparent Electronics Industry Market Concentration & Innovation
This section analyzes the competitive landscape of the transparent electronics market, examining market concentration, innovation drivers, regulatory frameworks, and key industry dynamics. The market is characterized by a moderate level of concentration, with several key players holding significant market share. Street Communication Inc., Ubiquitous Energy Inc., and BOE Technology Group Co. are among the leading companies, collectively accounting for an estimated xx% of the global market share in 2025. Innovation is driven primarily by advancements in materials science, display technologies, and energy harvesting. Stringent regulatory frameworks regarding energy efficiency and environmental impact are also shaping the market. Product substitution is a factor, with traditional displays and solar panels facing increasing competition from transparent alternatives. Recent M&A activities have been moderate, with a total deal value of approximately $xx Million in the past three years. Key mergers and acquisitions include [Insert details of M&A activities if available, otherwise use "xx"]. The analysis also includes an assessment of end-user trends and their impact on product development and market demand.
Transparent Electronics Industry Industry Trends & Insights
The transparent electronics industry is experiencing significant growth, driven by technological advancements and increasing demand from various end-user industries. The market is projected to exhibit a Compound Annual Growth Rate (CAGR) of xx% during the forecast period (2025-2033), reaching a market size of xx Million by 2033. Key growth drivers include the rising adoption of smart buildings, the increasing demand for energy-efficient solutions in the automotive sector, and the growing popularity of transparent displays in consumer electronics. Technological advancements such as the development of flexible and transparent electronics are further fueling market growth. Consumer preference for aesthetically pleasing and energy-efficient products is also driving demand. The competitive landscape is characterized by intense competition among established players and emerging startups, leading to continuous innovation and product differentiation. Market penetration in key segments such as automotive and consumer electronics is steadily increasing, driven by favorable regulatory policies and government incentives in some regions.
Dominant Markets & Segments in Transparent Electronics Industry
The global transparent electronics market is dominated by [Specify the dominant region, e.g., North America/Asia-Pacific] region, driven by factors such as strong economic growth, advanced infrastructure, and supportive government policies. Within this region, [Specify the dominant country] is a key market, exhibiting significant growth potential.
By End-user Industry Application:
- Automotive: High growth is expected due to the increasing demand for advanced driver-assistance systems (ADAS) and improved vehicle aesthetics.
- Building Infrastructure: Smart buildings and energy-efficient constructions are key drivers for growth in this segment.
- Consumer Electronics: The demand for sleek and innovative transparent displays in smartphones, wearables, and other consumer electronics is driving the market segment.
- Other End-user Industry: This segment includes diverse applications like healthcare, aerospace, and retail, with moderate growth potential.
By Product:
- Transparent Displays: This segment is expected to dominate the market due to increasing applications in various sectors.
- Transparent Solar Panels: Growing interest in renewable energy sources is driving the expansion of this segment.
- Smart Windows: The demand for energy-efficient and aesthetically pleasing windows is promoting growth in this area.
- Other Products: This includes various emerging applications and products within the transparent electronics market with a combined growth potential.
Transparent Electronics Industry Product Developments
Recent product innovations in the transparent electronics industry include advancements in materials science, leading to improved transparency, flexibility, and durability. New applications are emerging in areas such as augmented reality (AR) displays, transparent solar cells for building-integrated photovoltaics (BIPV), and interactive smart windows. These developments are enhancing product features and broadening market applicability, creating competitive advantages for companies that adopt these technologies. The market is also seeing integration of transparent electronics with other technologies, such as sensors and IoT devices, further increasing their functionality and market value.
Report Scope & Segmentation Analysis
This report comprehensively segments the transparent electronics market by end-user industry application (Automotive, Building Infrastructure, Consumer Electronics, Other End-user Industry) and by product (Transparent Displays, Transparent Solar Panels, Smart Windows, Other Products). Each segment is analyzed in detail, including growth projections, market size estimates for the forecast period, and competitive dynamics within each segment. Growth rates vary across segments, with the [Specify fastest-growing segment] expected to experience the most rapid growth during the forecast period. Competitive intensity also differs across segments, with certain segments experiencing more intense competition due to the presence of a larger number of established and emerging players.
Key Drivers of Transparent Electronics Industry Growth
The transparent electronics industry's growth is primarily propelled by technological advancements in materials science, enabling the creation of more efficient and versatile transparent components. Furthermore, increasing demand for energy-efficient solutions across various sectors, such as the automotive and building industries, significantly contributes to market expansion. Government initiatives and supportive regulations promoting the adoption of renewable energy technologies and smart infrastructure are also key growth drivers.
Challenges in the Transparent Electronics Industry Sector
Several challenges hinder the growth of the transparent electronics industry. High manufacturing costs associated with specialized materials and complex production processes pose a significant barrier. Furthermore, supply chain disruptions and the limited availability of critical raw materials can impact production and profitability. Intense competition among established players and emerging startups also creates pressure on margins and requires continuous innovation. Regulatory hurdles and safety standards related to new materials and applications further complicate market expansion. The total estimated impact of these challenges on market growth in 2025 is approximately xx Million.
Emerging Opportunities in Transparent Electronics Industry
Significant opportunities exist for growth in the transparent electronics industry, including the expanding adoption of augmented reality (AR) and virtual reality (VR) technologies, which increase demand for transparent displays. The development of flexible and wearable transparent electronics opens up new avenues in various sectors such as healthcare and consumer electronics. Moreover, the integration of transparent electronics with other technologies, such as sensors and IoT devices, presents considerable growth potential. Finally, expanding into new and developing markets presents significant opportunities for market expansion.
Leading Players in the Transparent Electronics Industry Market
- Street Communication Inc
- Ubiquitous Energy Inc
- BOE Technology Group Co
- LG Electronics Inc
- Brite Solar Inc
- Panasonic Corporation
- ClearLED Ltd
- Shenzhen Nexnovo Technology Co Ltd
- Shenzhen AuroLED Technology Co Ltd
- Corning Incorporated
Key Developments in Transparent Electronics Industry Industry
- 2023 Q3: BOE Technology Group Co. launched a new generation of transparent AMOLED displays.
- 2022 Q4: Ubiquitous Energy Inc. announced a partnership with a major automotive manufacturer for the development of transparent solar panels for vehicles.
- 2021 Q2: LG Electronics Inc. unveiled its latest transparent OLED display technology.
- [Add more key developments with dates if available, otherwise use "xx" for placeholder data]
Strategic Outlook for Transparent Electronics Industry Market
The transparent electronics market holds significant growth potential over the next decade, driven by technological innovations and increasing demand across diverse sectors. Continued advancements in materials science, leading to improved efficiency and cost reduction, will be crucial for market expansion. Strategic partnerships and collaborations among key players will facilitate the development of new applications and the integration of transparent electronics with other technologies. The focus on sustainability and energy efficiency will further fuel market growth, creating opportunities for companies that prioritize these aspects in their product development and marketing strategies. The market is expected to witness significant expansion and diversification in the coming years, with the emergence of new applications and technologies driving further growth.
Transparent Electronics Industry Segmentation
-
1. Product
- 1.1. Transparent Displays
- 1.2. Transparent Solar Panels
- 1.3. Smart Windows
- 1.4. Other Products
-
2. End-user Industry Application
- 2.1. Automotive
- 2.2. Building Infrastructure
- 2.3. Consumer Electronics
- 2.4. Other End-user Industry
Transparent Electronics Industry Segmentation By Geography
- 1. North America
- 2. Europe
- 3. Asia Pacific
- 4. Rest of the World
Transparent Electronics Industry REPORT HIGHLIGHTS
| Aspects | Details |
|---|---|
| Study Period | 2019-2033 |
| Base Year | 2024 |
| Estimated Year | 2025 |
| Forecast Period | 2025-2033 |
| Historical Period | 2019-2024 |
| Growth Rate | CAGR of 25.00% from 2019-2033 |
| Segmentation |
|
Table of Contents
- 1. Introduction
- 1.1. Research Scope
- 1.2. Market Segmentation
- 1.3. Research Methodology
- 1.4. Definitions and Assumptions
- 2. Executive Summary
- 2.1. Introduction
- 3. Market Dynamics
- 3.1. Introduction
- 3.2. Market Drivers
- 3.2.1. ; Growing Penetration of Touch-Enabled Electronic Devices
- 3.3. Market Restrains
- 3.3.1. Data Security and Privacy
- 3.4. Market Trends
- 3.4.1. Transparent Display Through AMOLED in Smartphone to Witness a Market Growth
- 4. Market Factor Analysis
- 4.1. Porters Five Forces
- 4.2. Supply/Value Chain
- 4.3. PESTEL analysis
- 4.4. Market Entropy
- 4.5. Patent/Trademark Analysis
- 5. Global Transparent Electronics Industry Analysis, Insights and Forecast, 2019-2031
- 5.1. Market Analysis, Insights and Forecast - by Product
- 5.1.1. Transparent Displays
- 5.1.2. Transparent Solar Panels
- 5.1.3. Smart Windows
- 5.1.4. Other Products
- 5.2. Market Analysis, Insights and Forecast - by End-user Industry Application
- 5.2.1. Automotive
- 5.2.2. Building Infrastructure
- 5.2.3. Consumer Electronics
- 5.2.4. Other End-user Industry
- 5.3. Market Analysis, Insights and Forecast - by Region
- 5.3.1. North America
- 5.3.2. Europe
- 5.3.3. Asia Pacific
- 5.3.4. Rest of the World
- 5.1. Market Analysis, Insights and Forecast - by Product
- 6. North America Transparent Electronics Industry Analysis, Insights and Forecast, 2019-2031
- 6.1. Market Analysis, Insights and Forecast - by Product
- 6.1.1. Transparent Displays
- 6.1.2. Transparent Solar Panels
- 6.1.3. Smart Windows
- 6.1.4. Other Products
- 6.2. Market Analysis, Insights and Forecast - by End-user Industry Application
- 6.2.1. Automotive
- 6.2.2. Building Infrastructure
- 6.2.3. Consumer Electronics
- 6.2.4. Other End-user Industry
- 6.1. Market Analysis, Insights and Forecast - by Product
- 7. Europe Transparent Electronics Industry Analysis, Insights and Forecast, 2019-2031
- 7.1. Market Analysis, Insights and Forecast - by Product
- 7.1.1. Transparent Displays
- 7.1.2. Transparent Solar Panels
- 7.1.3. Smart Windows
- 7.1.4. Other Products
- 7.2. Market Analysis, Insights and Forecast - by End-user Industry Application
- 7.2.1. Automotive
- 7.2.2. Building Infrastructure
- 7.2.3. Consumer Electronics
- 7.2.4. Other End-user Industry
- 7.1. Market Analysis, Insights and Forecast - by Product
- 8. Asia Pacific Transparent Electronics Industry Analysis, Insights and Forecast, 2019-2031
- 8.1. Market Analysis, Insights and Forecast - by Product
- 8.1.1. Transparent Displays
- 8.1.2. Transparent Solar Panels
- 8.1.3. Smart Windows
- 8.1.4. Other Products
- 8.2. Market Analysis, Insights and Forecast - by End-user Industry Application
- 8.2.1. Automotive
- 8.2.2. Building Infrastructure
- 8.2.3. Consumer Electronics
- 8.2.4. Other End-user Industry
- 8.1. Market Analysis, Insights and Forecast - by Product
- 9. Rest of the World Transparent Electronics Industry Analysis, Insights and Forecast, 2019-2031
- 9.1. Market Analysis, Insights and Forecast - by Product
- 9.1.1. Transparent Displays
- 9.1.2. Transparent Solar Panels
- 9.1.3. Smart Windows
- 9.1.4. Other Products
- 9.2. Market Analysis, Insights and Forecast - by End-user Industry Application
- 9.2.1. Automotive
- 9.2.2. Building Infrastructure
- 9.2.3. Consumer Electronics
- 9.2.4. Other End-user Industry
- 9.1. Market Analysis, Insights and Forecast - by Product
- 10. North America Transparent Electronics Industry Analysis, Insights and Forecast, 2019-2031
- 10.1. Market Analysis, Insights and Forecast - By Country/Sub-region
- 10.1.1 United States
- 10.1.2 Canada
- 10.1.3 Mexico
- 11. Europe Transparent Electronics Industry Analysis, Insights and Forecast, 2019-2031
- 11.1. Market Analysis, Insights and Forecast - By Country/Sub-region
- 11.1.1 Germany
- 11.1.2 United Kingdom
- 11.1.3 France
- 11.1.4 Spain
- 11.1.5 Italy
- 11.1.6 Spain
- 11.1.7 Belgium
- 11.1.8 Netherland
- 11.1.9 Nordics
- 11.1.10 Rest of Europe
- 12. Asia Pacific Transparent Electronics Industry Analysis, Insights and Forecast, 2019-2031
- 12.1. Market Analysis, Insights and Forecast - By Country/Sub-region
- 12.1.1 China
- 12.1.2 Japan
- 12.1.3 India
- 12.1.4 South Korea
- 12.1.5 Southeast Asia
- 12.1.6 Australia
- 12.1.7 Indonesia
- 12.1.8 Phillipes
- 12.1.9 Singapore
- 12.1.10 Thailandc
- 12.1.11 Rest of Asia Pacific
- 13. South America Transparent Electronics Industry Analysis, Insights and Forecast, 2019-2031
- 13.1. Market Analysis, Insights and Forecast - By Country/Sub-region
- 13.1.1 Brazil
- 13.1.2 Argentina
- 13.1.3 Peru
- 13.1.4 Chile
- 13.1.5 Colombia
- 13.1.6 Ecuador
- 13.1.7 Venezuela
- 13.1.8 Rest of South America
- 14. North America Transparent Electronics Industry Analysis, Insights and Forecast, 2019-2031
- 14.1. Market Analysis, Insights and Forecast - By Country/Sub-region
- 14.1.1 United States
- 14.1.2 Canada
- 14.1.3 Mexico
- 15. MEA Transparent Electronics Industry Analysis, Insights and Forecast, 2019-2031
- 15.1. Market Analysis, Insights and Forecast - By Country/Sub-region
- 15.1.1 United Arab Emirates
- 15.1.2 Saudi Arabia
- 15.1.3 South Africa
- 15.1.4 Rest of Middle East and Africa
- 16. Competitive Analysis
- 16.1. Global Market Share Analysis 2024
- 16.2. Company Profiles
- 16.2.1 Street Communication Inc
- 16.2.1.1. Overview
- 16.2.1.2. Products
- 16.2.1.3. SWOT Analysis
- 16.2.1.4. Recent Developments
- 16.2.1.5. Financials (Based on Availability)
- 16.2.2 Ubiquitous Energy Inc
- 16.2.2.1. Overview
- 16.2.2.2. Products
- 16.2.2.3. SWOT Analysis
- 16.2.2.4. Recent Developments
- 16.2.2.5. Financials (Based on Availability)
- 16.2.3 BOE Technology Group Co
- 16.2.3.1. Overview
- 16.2.3.2. Products
- 16.2.3.3. SWOT Analysis
- 16.2.3.4. Recent Developments
- 16.2.3.5. Financials (Based on Availability)
- 16.2.4 LG Electronics Inc
- 16.2.4.1. Overview
- 16.2.4.2. Products
- 16.2.4.3. SWOT Analysis
- 16.2.4.4. Recent Developments
- 16.2.4.5. Financials (Based on Availability)
- 16.2.5 Brite Solar Inc
- 16.2.5.1. Overview
- 16.2.5.2. Products
- 16.2.5.3. SWOT Analysis
- 16.2.5.4. Recent Developments
- 16.2.5.5. Financials (Based on Availability)
- 16.2.6 Panasonic Corporation
- 16.2.6.1. Overview
- 16.2.6.2. Products
- 16.2.6.3. SWOT Analysis
- 16.2.6.4. Recent Developments
- 16.2.6.5. Financials (Based on Availability)
- 16.2.7 ClearLED Ltd
- 16.2.7.1. Overview
- 16.2.7.2. Products
- 16.2.7.3. SWOT Analysis
- 16.2.7.4. Recent Developments
- 16.2.7.5. Financials (Based on Availability)
- 16.2.8 Shenzhen Nexnovo Technology Co Ltd
- 16.2.8.1. Overview
- 16.2.8.2. Products
- 16.2.8.3. SWOT Analysis
- 16.2.8.4. Recent Developments
- 16.2.8.5. Financials (Based on Availability)
- 16.2.9 Shenzhen AuroLED Technology Co Ltd
- 16.2.9.1. Overview
- 16.2.9.2. Products
- 16.2.9.3. SWOT Analysis
- 16.2.9.4. Recent Developments
- 16.2.9.5. Financials (Based on Availability)
- 16.2.10 Corning Incorporated
- 16.2.10.1. Overview
- 16.2.10.2. Products
- 16.2.10.3. SWOT Analysis
- 16.2.10.4. Recent Developments
- 16.2.10.5. Financials (Based on Availability)
- 16.2.1 Street Communication Inc
List of Figures
- Figure 1: Global Transparent Electronics Industry Revenue Breakdown (Million, %) by Region 2024 & 2032
- Figure 2: North America Transparent Electronics Industry Revenue (Million), by Country 2024 & 2032
- Figure 3: North America Transparent Electronics Industry Revenue Share (%), by Country 2024 & 2032
- Figure 4: Europe Transparent Electronics Industry Revenue (Million), by Country 2024 & 2032
- Figure 5: Europe Transparent Electronics Industry Revenue Share (%), by Country 2024 & 2032
- Figure 6: Asia Pacific Transparent Electronics Industry Revenue (Million), by Country 2024 & 2032
- Figure 7: Asia Pacific Transparent Electronics Industry Revenue Share (%), by Country 2024 & 2032
- Figure 8: South America Transparent Electronics Industry Revenue (Million), by Country 2024 & 2032
- Figure 9: South America Transparent Electronics Industry Revenue Share (%), by Country 2024 & 2032
- Figure 10: North America Transparent Electronics Industry Revenue (Million), by Country 2024 & 2032
- Figure 11: North America Transparent Electronics Industry Revenue Share (%), by Country 2024 & 2032
- Figure 12: MEA Transparent Electronics Industry Revenue (Million), by Country 2024 & 2032
- Figure 13: MEA Transparent Electronics Industry Revenue Share (%), by Country 2024 & 2032
- Figure 14: North America Transparent Electronics Industry Revenue (Million), by Product 2024 & 2032
- Figure 15: North America Transparent Electronics Industry Revenue Share (%), by Product 2024 & 2032
- Figure 16: North America Transparent Electronics Industry Revenue (Million), by End-user Industry Application 2024 & 2032
- Figure 17: North America Transparent Electronics Industry Revenue Share (%), by End-user Industry Application 2024 & 2032
- Figure 18: North America Transparent Electronics Industry Revenue (Million), by Country 2024 & 2032
- Figure 19: North America Transparent Electronics Industry Revenue Share (%), by Country 2024 & 2032
- Figure 20: Europe Transparent Electronics Industry Revenue (Million), by Product 2024 & 2032
- Figure 21: Europe Transparent Electronics Industry Revenue Share (%), by Product 2024 & 2032
- Figure 22: Europe Transparent Electronics Industry Revenue (Million), by End-user Industry Application 2024 & 2032
- Figure 23: Europe Transparent Electronics Industry Revenue Share (%), by End-user Industry Application 2024 & 2032
- Figure 24: Europe Transparent Electronics Industry Revenue (Million), by Country 2024 & 2032
- Figure 25: Europe Transparent Electronics Industry Revenue Share (%), by Country 2024 & 2032
- Figure 26: Asia Pacific Transparent Electronics Industry Revenue (Million), by Product 2024 & 2032
- Figure 27: Asia Pacific Transparent Electronics Industry Revenue Share (%), by Product 2024 & 2032
- Figure 28: Asia Pacific Transparent Electronics Industry Revenue (Million), by End-user Industry Application 2024 & 2032
- Figure 29: Asia Pacific Transparent Electronics Industry Revenue Share (%), by End-user Industry Application 2024 & 2032
- Figure 30: Asia Pacific Transparent Electronics Industry Revenue (Million), by Country 2024 & 2032
- Figure 31: Asia Pacific Transparent Electronics Industry Revenue Share (%), by Country 2024 & 2032
- Figure 32: Rest of the World Transparent Electronics Industry Revenue (Million), by Product 2024 & 2032
- Figure 33: Rest of the World Transparent Electronics Industry Revenue Share (%), by Product 2024 & 2032
- Figure 34: Rest of the World Transparent Electronics Industry Revenue (Million), by End-user Industry Application 2024 & 2032
- Figure 35: Rest of the World Transparent Electronics Industry Revenue Share (%), by End-user Industry Application 2024 & 2032
- Figure 36: Rest of the World Transparent Electronics Industry Revenue (Million), by Country 2024 & 2032
- Figure 37: Rest of the World Transparent Electronics Industry Revenue Share (%), by Country 2024 & 2032
List of Tables
- Table 1: Global Transparent Electronics Industry Revenue Million Forecast, by Region 2019 & 2032
- Table 2: Global Transparent Electronics Industry Revenue Million Forecast, by Product 2019 & 2032
- Table 3: Global Transparent Electronics Industry Revenue Million Forecast, by End-user Industry Application 2019 & 2032
- Table 4: Global Transparent Electronics Industry Revenue Million Forecast, by Region 2019 & 2032
- Table 5: Global Transparent Electronics Industry Revenue Million Forecast, by Country 2019 & 2032
- Table 6: United States Transparent Electronics Industry Revenue (Million) Forecast, by Application 2019 & 2032
- Table 7: Canada Transparent Electronics Industry Revenue (Million) Forecast, by Application 2019 & 2032
- Table 8: Mexico Transparent Electronics Industry Revenue (Million) Forecast, by Application 2019 & 2032
- Table 9: Global Transparent Electronics Industry Revenue Million Forecast, by Country 2019 & 2032
- Table 10: Germany Transparent Electronics Industry Revenue (Million) Forecast, by Application 2019 & 2032
- Table 11: United Kingdom Transparent Electronics Industry Revenue (Million) Forecast, by Application 2019 & 2032
- Table 12: France Transparent Electronics Industry Revenue (Million) Forecast, by Application 2019 & 2032
- Table 13: Spain Transparent Electronics Industry Revenue (Million) Forecast, by Application 2019 & 2032
- Table 14: Italy Transparent Electronics Industry Revenue (Million) Forecast, by Application 2019 & 2032
- Table 15: Spain Transparent Electronics Industry Revenue (Million) Forecast, by Application 2019 & 2032
- Table 16: Belgium Transparent Electronics Industry Revenue (Million) Forecast, by Application 2019 & 2032
- Table 17: Netherland Transparent Electronics Industry Revenue (Million) Forecast, by Application 2019 & 2032
- Table 18: Nordics Transparent Electronics Industry Revenue (Million) Forecast, by Application 2019 & 2032
- Table 19: Rest of Europe Transparent Electronics Industry Revenue (Million) Forecast, by Application 2019 & 2032
- Table 20: Global Transparent Electronics Industry Revenue Million Forecast, by Country 2019 & 2032
- Table 21: China Transparent Electronics Industry Revenue (Million) Forecast, by Application 2019 & 2032
- Table 22: Japan Transparent Electronics Industry Revenue (Million) Forecast, by Application 2019 & 2032
- Table 23: India Transparent Electronics Industry Revenue (Million) Forecast, by Application 2019 & 2032
- Table 24: South Korea Transparent Electronics Industry Revenue (Million) Forecast, by Application 2019 & 2032
- Table 25: Southeast Asia Transparent Electronics Industry Revenue (Million) Forecast, by Application 2019 & 2032
- Table 26: Australia Transparent Electronics Industry Revenue (Million) Forecast, by Application 2019 & 2032
- Table 27: Indonesia Transparent Electronics Industry Revenue (Million) Forecast, by Application 2019 & 2032
- Table 28: Phillipes Transparent Electronics Industry Revenue (Million) Forecast, by Application 2019 & 2032
- Table 29: Singapore Transparent Electronics Industry Revenue (Million) Forecast, by Application 2019 & 2032
- Table 30: Thailandc Transparent Electronics Industry Revenue (Million) Forecast, by Application 2019 & 2032
- Table 31: Rest of Asia Pacific Transparent Electronics Industry Revenue (Million) Forecast, by Application 2019 & 2032
- Table 32: Global Transparent Electronics Industry Revenue Million Forecast, by Country 2019 & 2032
- Table 33: Brazil Transparent Electronics Industry Revenue (Million) Forecast, by Application 2019 & 2032
- Table 34: Argentina Transparent Electronics Industry Revenue (Million) Forecast, by Application 2019 & 2032
- Table 35: Peru Transparent Electronics Industry Revenue (Million) Forecast, by Application 2019 & 2032
- Table 36: Chile Transparent Electronics Industry Revenue (Million) Forecast, by Application 2019 & 2032
- Table 37: Colombia Transparent Electronics Industry Revenue (Million) Forecast, by Application 2019 & 2032
- Table 38: Ecuador Transparent Electronics Industry Revenue (Million) Forecast, by Application 2019 & 2032
- Table 39: Venezuela Transparent Electronics Industry Revenue (Million) Forecast, by Application 2019 & 2032
- Table 40: Rest of South America Transparent Electronics Industry Revenue (Million) Forecast, by Application 2019 & 2032
- Table 41: Global Transparent Electronics Industry Revenue Million Forecast, by Country 2019 & 2032
- Table 42: United States Transparent Electronics Industry Revenue (Million) Forecast, by Application 2019 & 2032
- Table 43: Canada Transparent Electronics Industry Revenue (Million) Forecast, by Application 2019 & 2032
- Table 44: Mexico Transparent Electronics Industry Revenue (Million) Forecast, by Application 2019 & 2032
- Table 45: Global Transparent Electronics Industry Revenue Million Forecast, by Country 2019 & 2032
- Table 46: United Arab Emirates Transparent Electronics Industry Revenue (Million) Forecast, by Application 2019 & 2032
- Table 47: Saudi Arabia Transparent Electronics Industry Revenue (Million) Forecast, by Application 2019 & 2032
- Table 48: South Africa Transparent Electronics Industry Revenue (Million) Forecast, by Application 2019 & 2032
- Table 49: Rest of Middle East and Africa Transparent Electronics Industry Revenue (Million) Forecast, by Application 2019 & 2032
- Table 50: Global Transparent Electronics Industry Revenue Million Forecast, by Product 2019 & 2032
- Table 51: Global Transparent Electronics Industry Revenue Million Forecast, by End-user Industry Application 2019 & 2032
- Table 52: Global Transparent Electronics Industry Revenue Million Forecast, by Country 2019 & 2032
- Table 53: Global Transparent Electronics Industry Revenue Million Forecast, by Product 2019 & 2032
- Table 54: Global Transparent Electronics Industry Revenue Million Forecast, by End-user Industry Application 2019 & 2032
- Table 55: Global Transparent Electronics Industry Revenue Million Forecast, by Country 2019 & 2032
- Table 56: Global Transparent Electronics Industry Revenue Million Forecast, by Product 2019 & 2032
- Table 57: Global Transparent Electronics Industry Revenue Million Forecast, by End-user Industry Application 2019 & 2032
- Table 58: Global Transparent Electronics Industry Revenue Million Forecast, by Country 2019 & 2032
- Table 59: Global Transparent Electronics Industry Revenue Million Forecast, by Product 2019 & 2032
- Table 60: Global Transparent Electronics Industry Revenue Million Forecast, by End-user Industry Application 2019 & 2032
- Table 61: Global Transparent Electronics Industry Revenue Million Forecast, by Country 2019 & 2032
Frequently Asked Questions
1. What is the projected Compound Annual Growth Rate (CAGR) of the Transparent Electronics Industry?
The projected CAGR is approximately 25.00%.
2. Which companies are prominent players in the Transparent Electronics Industry?
Key companies in the market include Street Communication Inc, Ubiquitous Energy Inc, BOE Technology Group Co, LG Electronics Inc, Brite Solar Inc, Panasonic Corporation, ClearLED Ltd, Shenzhen Nexnovo Technology Co Ltd, Shenzhen AuroLED Technology Co Ltd, Corning Incorporated.
3. What are the main segments of the Transparent Electronics Industry?
The market segments include Product, End-user Industry Application.
4. Can you provide details about the market size?
The market size is estimated to be USD XX Million as of 2022.
5. What are some drivers contributing to market growth?
; Growing Penetration of Touch-Enabled Electronic Devices.
6. What are the notable trends driving market growth?
Transparent Display Through AMOLED in Smartphone to Witness a Market Growth.
7. Are there any restraints impacting market growth?
Data Security and Privacy.
8. Can you provide examples of recent developments in the market?
N/A
9. What pricing options are available for accessing the report?
Pricing options include single-user, multi-user, and enterprise licenses priced at USD 4750, USD 5250, and USD 8750 respectively.
10. Is the market size provided in terms of value or volume?
The market size is provided in terms of value, measured in Million.
11. Are there any specific market keywords associated with the report?
Yes, the market keyword associated with the report is "Transparent Electronics Industry," which aids in identifying and referencing the specific market segment covered.
12. How do I determine which pricing option suits my needs best?
The pricing options vary based on user requirements and access needs. Individual users may opt for single-user licenses, while businesses requiring broader access may choose multi-user or enterprise licenses for cost-effective access to the report.
13. Are there any additional resources or data provided in the Transparent Electronics Industry report?
While the report offers comprehensive insights, it's advisable to review the specific contents or supplementary materials provided to ascertain if additional resources or data are available.
14. How can I stay updated on further developments or reports in the Transparent Electronics Industry?
To stay informed about further developments, trends, and reports in the Transparent Electronics Industry, consider subscribing to industry newsletters, following relevant companies and organizations, or regularly checking reputable industry news sources and publications.
Methodology
Step 1 - Identification of Relevant Samples Size from Population Database


Step 2 - Approaches for Defining Global Market Size (Value, Volume* & Price*)

Note*: In applicable scenarios
Step 3 - Data Sources
Primary Research
- Web Analytics
- Survey Reports
- Research Institute
- Latest Research Reports
- Opinion Leaders
Secondary Research
- Annual Reports
- White Paper
- Latest Press Release
- Industry Association
- Paid Database
- Investor Presentations

Step 4 - Data Triangulation
Involves using different sources of information in order to increase the validity of a study
These sources are likely to be stakeholders in a program - participants, other researchers, program staff, other community members, and so on.
Then we put all data in single framework & apply various statistical tools to find out the dynamic on the market.
During the analysis stage, feedback from the stakeholder groups would be compared to determine areas of agreement as well as areas of divergence


