
Key Insights
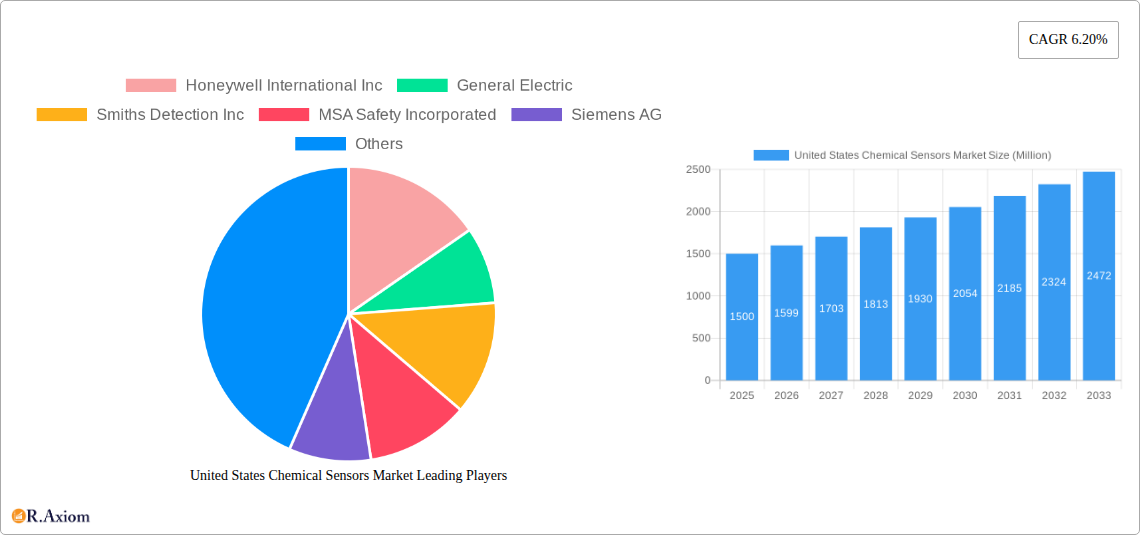
The United States chemical sensors market, exhibiting a Compound Annual Growth Rate (CAGR) of 6.20% from 2019 to 2024, is poised for continued expansion through 2033. Driven by increasing demand across diverse sectors, including industrial process monitoring, environmental protection, and healthcare diagnostics, this market is projected to reach significant value. The electrochemical and optical sensor types dominate the product landscape, while industrial and medical applications represent the largest market segments. Technological advancements leading to smaller, more sensitive, and cost-effective sensors are fueling market growth. Stringent environmental regulations and the rising need for real-time monitoring in various industries further stimulate demand. However, challenges such as the high initial investment costs associated with sensor deployment and the need for specialized expertise in sensor maintenance could potentially restrain market growth to some degree. Growth is anticipated to be particularly strong in the medical segment, driven by the rising prevalence of chronic diseases and the growing adoption of point-of-care diagnostics. The robust growth in the industrial sector, fueled by automation and the increasing need for process optimization, will also contribute significantly to market expansion. Key players, such as Honeywell International Inc., General Electric, and Smiths Detection Inc., are strategically investing in research and development to enhance sensor technology and expand their market presence.
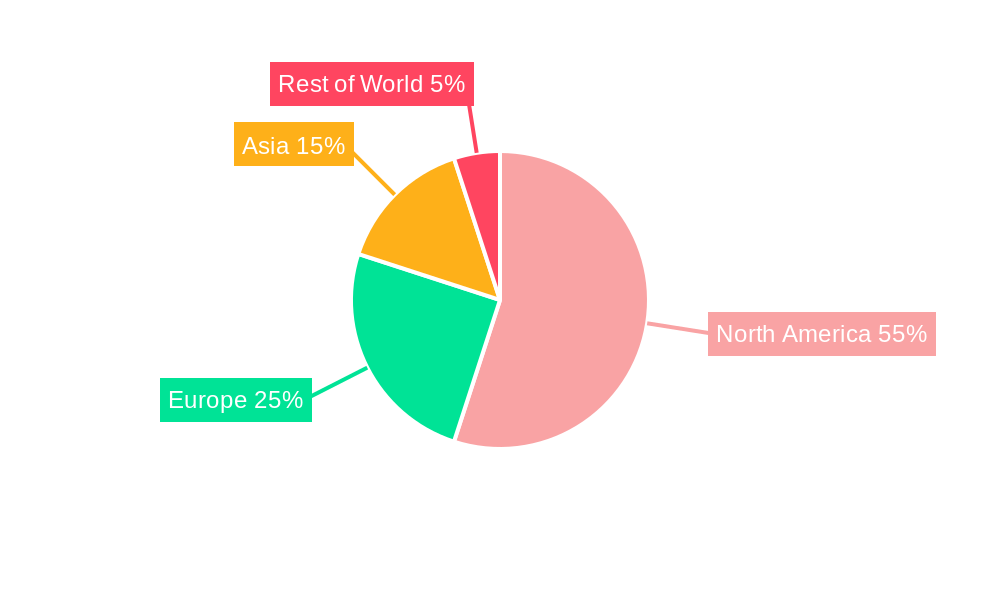
The North American region, particularly the United States, is expected to remain a dominant player in the global chemical sensors market. This is attributable to the well-established industrial base, substantial government funding for research and development in sensor technologies, and the prevalence of advanced healthcare infrastructure. Europe and Asia are also expected to witness significant growth, driven by increasing industrialization and government initiatives promoting environmental monitoring. While precise regional market share figures are unavailable, we can infer a significant portion of the overall market is captured by North America due to its advanced technology sector and the high demand across various industries mentioned above. The market's growth trajectory will be influenced by factors such as technological innovations, government regulations, and the economic conditions in key regions. The ongoing development of miniaturized and wireless sensors will open up new opportunities in various niche applications, contributing to the market's overall expansion.
United States Chemical Sensors Market: A Comprehensive Report (2019-2033)
This comprehensive report provides an in-depth analysis of the United States chemical sensors market, offering valuable insights for industry stakeholders, investors, and strategic decision-makers. Covering the period from 2019 to 2033, with a focus on 2025, this report meticulously examines market dynamics, segmentation, key players, and future growth prospects. The study period is 2019–2033, the base year is 2025, and the forecast period is 2025–2033. The historical period is 2019–2024.
United States Chemical Sensors Market Market Concentration & Innovation
The United States chemical sensors market exhibits a moderately concentrated landscape, with several major players holding significant market share. Honeywell International Inc, General Electric, Smiths Detection Inc, MSA Safety Incorporated, and Siemens AG are among the key companies driving innovation and shaping market dynamics. Market share data for 2024 indicates that Honeywell International Inc holds approximately xx% market share, followed by General Electric at xx%, and Smiths Detection Inc at xx%. Smaller players contribute significantly to market diversity and innovation.
- Innovation Drivers: Advancements in micro-electromechanical systems (MEMS), nanotechnology, and artificial intelligence (AI) are fueling the development of highly sensitive and selective chemical sensors with improved performance and cost-effectiveness.
- Regulatory Frameworks: Stringent environmental regulations and safety standards are driving the adoption of chemical sensors across various industries. The EPA's Clean Air Act and Clean Water Act directly impact demand for environmental monitoring sensors.
- Product Substitutes: While other technologies exist for monitoring chemical compounds, the advantages of chemical sensors in terms of sensitivity, selectivity, and cost-effectiveness makes them a preferred choice for many applications.
- End-User Trends: The growing demand for real-time monitoring and data analytics in various end-use sectors, such as industrial process control, healthcare diagnostics, and environmental protection, is a major factor influencing market expansion.
- M&A Activities: The market has witnessed several mergers and acquisitions in recent years, with deal values ranging from xx Million to xx Million. The acquisition of Sensor Scientific Inc. by CTS Corporation exemplifies strategic moves to strengthen market positions and expand product portfolios.
United States Chemical Sensors Market Industry Trends & Insights
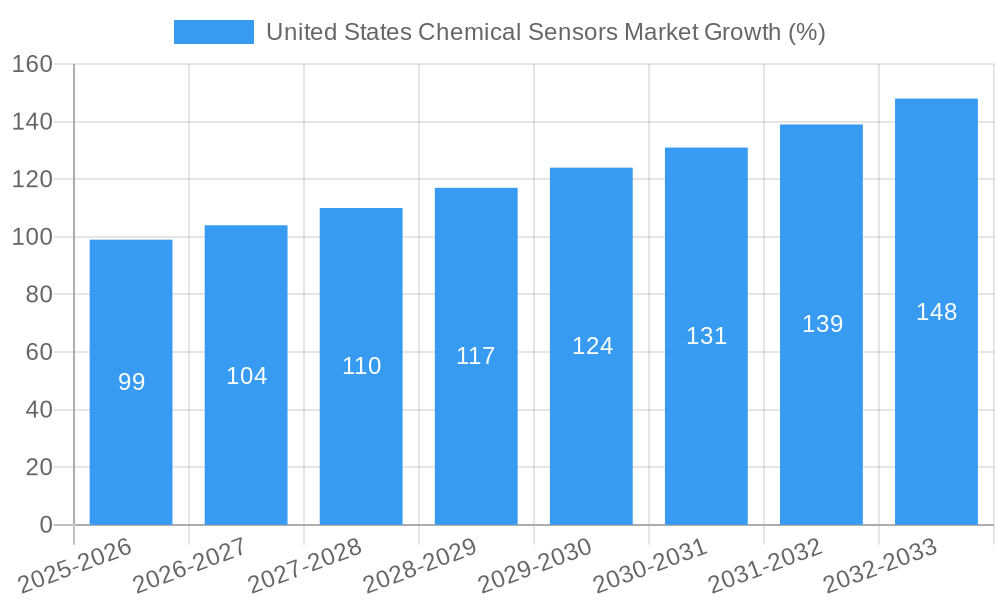
The United States chemical sensors market is witnessing robust growth, driven by increasing demand across diverse applications. The market is projected to register a CAGR of xx% during the forecast period (2025-2033). This growth is attributed to several key factors:
- Technological Disruptions: The integration of advanced technologies, such as IoT, cloud computing, and big data analytics, is transforming the way chemical sensors are designed, deployed, and utilized, leading to increased efficiency and improved data analysis capabilities.
- Consumer Preferences: Growing concerns about environmental sustainability and personal safety are driving demand for sophisticated chemical sensors for air and water quality monitoring, particularly in residential and commercial applications. This trend increases penetration rates of sensors in consumer markets.
- Competitive Dynamics: Intense competition among established players and emerging entrants is driving innovation and price reductions, which ultimately benefits end-users. The market is experiencing consolidation with larger players acquiring smaller, specialized firms.
Dominant Markets & Segments in United States Chemical Sensors Market
The industrial sector is the dominant application segment in the United States chemical sensors market, accounting for approximately xx% of the total market value in 2025. This is followed by the environmental monitoring and medical sectors.
By Product Type:
- Electrochemical Sensors: This segment holds the largest market share, driven by their cost-effectiveness and suitability for various applications.
- Optical Sensors: The optical sensor segment is experiencing rapid growth due to its high sensitivity and selectivity.
- Pallister/Catalytic Bead Sensors: This segment holds a relatively smaller market share compared to electrochemical and optical sensors.
- Other Product Types: This category includes emerging technologies such as piezoelectric and field-effect transistor (FET) based sensors, with potential for market expansion in specific applications.
By Application:
- Industrial: High demand for process monitoring and control across various manufacturing industries. This includes the petrochemical, pharmaceutical, and food & beverage industries, all of which use sensors extensively.
- Medical: Growing applications in diagnostics, drug delivery, and biosensors.
- Environmental Monitoring: Driven by increasing concerns regarding air and water pollution, coupled with increasingly stringent environmental regulations.
- Defense and Homeland Security: Demand for chemical detection and identification systems in military and security applications.
- Other Applications: Includes sectors such as agriculture, automotive, and consumer goods, indicating a wide and versatile usage of chemical sensors.
Key Drivers:
- Robust industrial growth and technological advancements are driving the demand for chemical sensors in various manufacturing processes.
- Stringent environmental regulations necessitate the deployment of reliable chemical sensors for monitoring air and water quality.
- Rising investments in healthcare infrastructure are fueling the adoption of medical sensors for diagnostics and treatment.
United States Chemical Sensors Market Product Developments
Recent advancements have focused on miniaturization, improved sensitivity and selectivity, wireless connectivity, and integration with data analytics platforms. New sensor designs leverage nanomaterials and advanced signal processing techniques to provide enhanced performance and cost-effectiveness. The integration with IoT and cloud computing facilitates real-time monitoring and remote data analysis, optimizing sensor deployment and maintenance across various applications.
Report Scope & Segmentation Analysis
This report segments the United States chemical sensors market by product type (electrochemical, optical, Pallister/Catalytic Bead, other) and application (industrial, medical, environmental monitoring, defense and homeland security, other). Each segment's market size, growth projections, and competitive landscape are analyzed in detail. Growth in the electrochemical segment is driven by cost-effectiveness and wide applications. Optical sensors are growing rapidly due to their enhanced performance, while the other segments show steady but slower growth rates in comparison. The industrial application sector dominates due to its extensive use of sensor technologies for monitoring and control of manufacturing processes.
Key Drivers of United States Chemical Sensors Market Growth
The market's growth is propelled by technological advancements, stringent environmental regulations, and increasing industrial automation. The integration of IoT and AI into chemical sensors enhances their capabilities, creating new opportunities. Furthermore, growing government investments in environmental monitoring and healthcare infrastructure, coupled with rising consumer awareness of environmental and health issues, fuel market demand.
Challenges in the United States Chemical Sensors Market Sector
The market faces challenges such as high initial investment costs for advanced sensor technologies and the need for skilled labor for deployment and maintenance. Supply chain disruptions can impact production and availability of components, while intense competition from both domestic and international players can pressure profit margins. Regulatory compliance issues and evolving safety standards also pose challenges for manufacturers.
Emerging Opportunities in United States Chemical Sensors Market
The market presents significant opportunities in developing advanced sensors with enhanced sensitivity, selectivity, and data analytics capabilities. Integration with IoT and AI platforms can create innovative applications across diverse sectors. The growing need for portable, wireless sensors creates opportunities for miniaturized, energy-efficient designs. New applications in sectors like precision agriculture and smart cities further fuel market expansion.
Leading Players in the United States Chemical Sensors Market Market
- Honeywell International Inc
- General Electric
- Smiths Detection Inc
- MSA Safety Incorporated
- Siemens AG
- SICK AG
- Hans Turck GmbH & Co KG
- Pepperl+Fuchs Group
- AirTest Technologies Inc
- SenseAir AB
Key Developments in United States Chemical Sensors Market Industry
- December 2020: The US-based CTS Corporation acquired Sensor Scientific Inc., a privately held temperature sensing company, expanding its presence in the industrial temperature sensing market.
- January 2021: Sensemetrics introduced Strand, a sensor connectivity device, enhancing its sensor automation product portfolio and expanding applications in various sectors like mining.
Strategic Outlook for United States Chemical Sensors Market Market
The United States chemical sensors market is poised for significant growth, driven by technological innovation, increasing demand across diverse applications, and supportive government policies. Focus on developing cost-effective, high-performance sensors with advanced data analytics capabilities will be crucial for success. Strategic partnerships and collaborations will facilitate the integration of sensor technologies into broader ecosystems, creating new opportunities and driving market expansion.
United States Chemical Sensors Market Segmentation
-
1. Product Type
- 1.1. Electrochemical
- 1.2. Optical
- 1.3. Pallister/Catalytic Bead
- 1.4. Other Product Types
-
2. Application
- 2.1. Industrial
- 2.2. Medical
- 2.3. Environmental Monitoring
- 2.4. Defense and Homeland Security
- 2.5. Other Applications
United States Chemical Sensors Market Segmentation By Geography
- 1. United States
United States Chemical Sensors Market REPORT HIGHLIGHTS
| Aspects | Details |
|---|---|
| Study Period | 2019-2033 |
| Base Year | 2024 |
| Estimated Year | 2025 |
| Forecast Period | 2025-2033 |
| Historical Period | 2019-2024 |
| Growth Rate | CAGR of 6.20% from 2019-2033 |
| Segmentation |
|
Table of Contents
- 1. Introduction
- 1.1. Research Scope
- 1.2. Market Segmentation
- 1.3. Research Methodology
- 1.4. Definitions and Assumptions
- 2. Executive Summary
- 2.1. Introduction
- 3. Market Dynamics
- 3.1. Introduction
- 3.2. Market Drivers
- 3.2.1. Growing Developments in Miniaturised and Portable Electrochemical Sensors; Increased Adoption from Automotive and Healthcare Sector
- 3.3. Market Restrains
- 3.3.1. Lower Awareness of Facility Management Services
- 3.4. Market Trends
- 3.4.1. Medical Segment will Witness a Significant Growth
- 4. Market Factor Analysis
- 4.1. Porters Five Forces
- 4.2. Supply/Value Chain
- 4.3. PESTEL analysis
- 4.4. Market Entropy
- 4.5. Patent/Trademark Analysis
- 5. United States Chemical Sensors Market Analysis, Insights and Forecast, 2019-2031
- 5.1. Market Analysis, Insights and Forecast - by Product Type
- 5.1.1. Electrochemical
- 5.1.2. Optical
- 5.1.3. Pallister/Catalytic Bead
- 5.1.4. Other Product Types
- 5.2. Market Analysis, Insights and Forecast - by Application
- 5.2.1. Industrial
- 5.2.2. Medical
- 5.2.3. Environmental Monitoring
- 5.2.4. Defense and Homeland Security
- 5.2.5. Other Applications
- 5.3. Market Analysis, Insights and Forecast - by Region
- 5.3.1. United States
- 5.1. Market Analysis, Insights and Forecast - by Product Type
- 6. North America United States Chemical Sensors Market Analysis, Insights and Forecast, 2019-2031
- 6.1. Market Analysis, Insights and Forecast - By Country/Sub-region
- 6.1.1.
- 7. Europe United States Chemical Sensors Market Analysis, Insights and Forecast, 2019-2031
- 7.1. Market Analysis, Insights and Forecast - By Country/Sub-region
- 7.1.1.
- 8. Asia United States Chemical Sensors Market Analysis, Insights and Forecast, 2019-2031
- 8.1. Market Analysis, Insights and Forecast - By Country/Sub-region
- 8.1.1.
- 9. Australia and New Zealand United States Chemical Sensors Market Analysis, Insights and Forecast, 2019-2031
- 9.1. Market Analysis, Insights and Forecast - By Country/Sub-region
- 9.1.1.
- 10. Latin America United States Chemical Sensors Market Analysis, Insights and Forecast, 2019-2031
- 10.1. Market Analysis, Insights and Forecast - By Country/Sub-region
- 10.1.1.
- 11. Middle East and Africa United States Chemical Sensors Market Analysis, Insights and Forecast, 2019-2031
- 11.1. Market Analysis, Insights and Forecast - By Country/Sub-region
- 11.1.1.
- 12. Competitive Analysis
- 12.1. Market Share Analysis 2024
- 12.2. Company Profiles
- 12.2.1 Honeywell International Inc
- 12.2.1.1. Overview
- 12.2.1.2. Products
- 12.2.1.3. SWOT Analysis
- 12.2.1.4. Recent Developments
- 12.2.1.5. Financials (Based on Availability)
- 12.2.2 General Electric
- 12.2.2.1. Overview
- 12.2.2.2. Products
- 12.2.2.3. SWOT Analysis
- 12.2.2.4. Recent Developments
- 12.2.2.5. Financials (Based on Availability)
- 12.2.3 Smiths Detection Inc
- 12.2.3.1. Overview
- 12.2.3.2. Products
- 12.2.3.3. SWOT Analysis
- 12.2.3.4. Recent Developments
- 12.2.3.5. Financials (Based on Availability)
- 12.2.4 MSA Safety Incorporated
- 12.2.4.1. Overview
- 12.2.4.2. Products
- 12.2.4.3. SWOT Analysis
- 12.2.4.4. Recent Developments
- 12.2.4.5. Financials (Based on Availability)
- 12.2.5 Siemens AG
- 12.2.5.1. Overview
- 12.2.5.2. Products
- 12.2.5.3. SWOT Analysis
- 12.2.5.4. Recent Developments
- 12.2.5.5. Financials (Based on Availability)
- 12.2.6 SICK AG
- 12.2.6.1. Overview
- 12.2.6.2. Products
- 12.2.6.3. SWOT Analysis
- 12.2.6.4. Recent Developments
- 12.2.6.5. Financials (Based on Availability)
- 12.2.7 Hans Turck GmbH & Co KG
- 12.2.7.1. Overview
- 12.2.7.2. Products
- 12.2.7.3. SWOT Analysis
- 12.2.7.4. Recent Developments
- 12.2.7.5. Financials (Based on Availability)
- 12.2.8 Pepperl+Fuchs Group
- 12.2.8.1. Overview
- 12.2.8.2. Products
- 12.2.8.3. SWOT Analysis
- 12.2.8.4. Recent Developments
- 12.2.8.5. Financials (Based on Availability)
- 12.2.9 AirTest Technologies Inc
- 12.2.9.1. Overview
- 12.2.9.2. Products
- 12.2.9.3. SWOT Analysis
- 12.2.9.4. Recent Developments
- 12.2.9.5. Financials (Based on Availability)
- 12.2.10 SenseAir AB
- 12.2.10.1. Overview
- 12.2.10.2. Products
- 12.2.10.3. SWOT Analysis
- 12.2.10.4. Recent Developments
- 12.2.10.5. Financials (Based on Availability)
- 12.2.1 Honeywell International Inc
List of Figures
- Figure 1: United States Chemical Sensors Market Revenue Breakdown (Million, %) by Product 2024 & 2032
- Figure 2: United States Chemical Sensors Market Share (%) by Company 2024
List of Tables
- Table 1: United States Chemical Sensors Market Revenue Million Forecast, by Region 2019 & 2032
- Table 2: United States Chemical Sensors Market Volume K Unit Forecast, by Region 2019 & 2032
- Table 3: United States Chemical Sensors Market Revenue Million Forecast, by Product Type 2019 & 2032
- Table 4: United States Chemical Sensors Market Volume K Unit Forecast, by Product Type 2019 & 2032
- Table 5: United States Chemical Sensors Market Revenue Million Forecast, by Application 2019 & 2032
- Table 6: United States Chemical Sensors Market Volume K Unit Forecast, by Application 2019 & 2032
- Table 7: United States Chemical Sensors Market Revenue Million Forecast, by Region 2019 & 2032
- Table 8: United States Chemical Sensors Market Volume K Unit Forecast, by Region 2019 & 2032
- Table 9: United States Chemical Sensors Market Revenue Million Forecast, by Country 2019 & 2032
- Table 10: United States Chemical Sensors Market Volume K Unit Forecast, by Country 2019 & 2032
- Table 11: United States Chemical Sensors Market Revenue (Million) Forecast, by Application 2019 & 2032
- Table 12: United States Chemical Sensors Market Volume (K Unit) Forecast, by Application 2019 & 2032
- Table 13: United States Chemical Sensors Market Revenue Million Forecast, by Country 2019 & 2032
- Table 14: United States Chemical Sensors Market Volume K Unit Forecast, by Country 2019 & 2032
- Table 15: United States Chemical Sensors Market Revenue (Million) Forecast, by Application 2019 & 2032
- Table 16: United States Chemical Sensors Market Volume (K Unit) Forecast, by Application 2019 & 2032
- Table 17: United States Chemical Sensors Market Revenue Million Forecast, by Country 2019 & 2032
- Table 18: United States Chemical Sensors Market Volume K Unit Forecast, by Country 2019 & 2032
- Table 19: United States Chemical Sensors Market Revenue (Million) Forecast, by Application 2019 & 2032
- Table 20: United States Chemical Sensors Market Volume (K Unit) Forecast, by Application 2019 & 2032
- Table 21: United States Chemical Sensors Market Revenue Million Forecast, by Country 2019 & 2032
- Table 22: United States Chemical Sensors Market Volume K Unit Forecast, by Country 2019 & 2032
- Table 23: United States Chemical Sensors Market Revenue (Million) Forecast, by Application 2019 & 2032
- Table 24: United States Chemical Sensors Market Volume (K Unit) Forecast, by Application 2019 & 2032
- Table 25: United States Chemical Sensors Market Revenue Million Forecast, by Country 2019 & 2032
- Table 26: United States Chemical Sensors Market Volume K Unit Forecast, by Country 2019 & 2032
- Table 27: United States Chemical Sensors Market Revenue (Million) Forecast, by Application 2019 & 2032
- Table 28: United States Chemical Sensors Market Volume (K Unit) Forecast, by Application 2019 & 2032
- Table 29: United States Chemical Sensors Market Revenue Million Forecast, by Country 2019 & 2032
- Table 30: United States Chemical Sensors Market Volume K Unit Forecast, by Country 2019 & 2032
- Table 31: United States Chemical Sensors Market Revenue (Million) Forecast, by Application 2019 & 2032
- Table 32: United States Chemical Sensors Market Volume (K Unit) Forecast, by Application 2019 & 2032
- Table 33: United States Chemical Sensors Market Revenue Million Forecast, by Product Type 2019 & 2032
- Table 34: United States Chemical Sensors Market Volume K Unit Forecast, by Product Type 2019 & 2032
- Table 35: United States Chemical Sensors Market Revenue Million Forecast, by Application 2019 & 2032
- Table 36: United States Chemical Sensors Market Volume K Unit Forecast, by Application 2019 & 2032
- Table 37: United States Chemical Sensors Market Revenue Million Forecast, by Country 2019 & 2032
- Table 38: United States Chemical Sensors Market Volume K Unit Forecast, by Country 2019 & 2032
Frequently Asked Questions
1. What is the projected Compound Annual Growth Rate (CAGR) of the United States Chemical Sensors Market?
The projected CAGR is approximately 6.20%.
2. Which companies are prominent players in the United States Chemical Sensors Market?
Key companies in the market include Honeywell International Inc, General Electric, Smiths Detection Inc, MSA Safety Incorporated, Siemens AG, SICK AG, Hans Turck GmbH & Co KG, Pepperl+Fuchs Group, AirTest Technologies Inc, SenseAir AB.
3. What are the main segments of the United States Chemical Sensors Market?
The market segments include Product Type, Application.
4. Can you provide details about the market size?
The market size is estimated to be USD XX Million as of 2022.
5. What are some drivers contributing to market growth?
Growing Developments in Miniaturised and Portable Electrochemical Sensors; Increased Adoption from Automotive and Healthcare Sector.
6. What are the notable trends driving market growth?
Medical Segment will Witness a Significant Growth.
7. Are there any restraints impacting market growth?
Lower Awareness of Facility Management Services.
8. Can you provide examples of recent developments in the market?
January 2021: Sensemetrics introduced Strand, a sensor connectivity device, as part of its sensor automation product portfolio, which can be applied in mining amongst other industries.
9. What pricing options are available for accessing the report?
Pricing options include single-user, multi-user, and enterprise licenses priced at USD 3800, USD 4500, and USD 5800 respectively.
10. Is the market size provided in terms of value or volume?
The market size is provided in terms of value, measured in Million and volume, measured in K Unit.
11. Are there any specific market keywords associated with the report?
Yes, the market keyword associated with the report is "United States Chemical Sensors Market," which aids in identifying and referencing the specific market segment covered.
12. How do I determine which pricing option suits my needs best?
The pricing options vary based on user requirements and access needs. Individual users may opt for single-user licenses, while businesses requiring broader access may choose multi-user or enterprise licenses for cost-effective access to the report.
13. Are there any additional resources or data provided in the United States Chemical Sensors Market report?
While the report offers comprehensive insights, it's advisable to review the specific contents or supplementary materials provided to ascertain if additional resources or data are available.
14. How can I stay updated on further developments or reports in the United States Chemical Sensors Market?
To stay informed about further developments, trends, and reports in the United States Chemical Sensors Market, consider subscribing to industry newsletters, following relevant companies and organizations, or regularly checking reputable industry news sources and publications.
Methodology
Step 1 - Identification of Relevant Samples Size from Population Database


Step 2 - Approaches for Defining Global Market Size (Value, Volume* & Price*)

Note*: In applicable scenarios
Step 3 - Data Sources
Primary Research
- Web Analytics
- Survey Reports
- Research Institute
- Latest Research Reports
- Opinion Leaders
Secondary Research
- Annual Reports
- White Paper
- Latest Press Release
- Industry Association
- Paid Database
- Investor Presentations

Step 4 - Data Triangulation
Involves using different sources of information in order to increase the validity of a study
These sources are likely to be stakeholders in a program - participants, other researchers, program staff, other community members, and so on.
Then we put all data in single framework & apply various statistical tools to find out the dynamic on the market.
During the analysis stage, feedback from the stakeholder groups would be compared to determine areas of agreement as well as areas of divergence


