

Key Insights
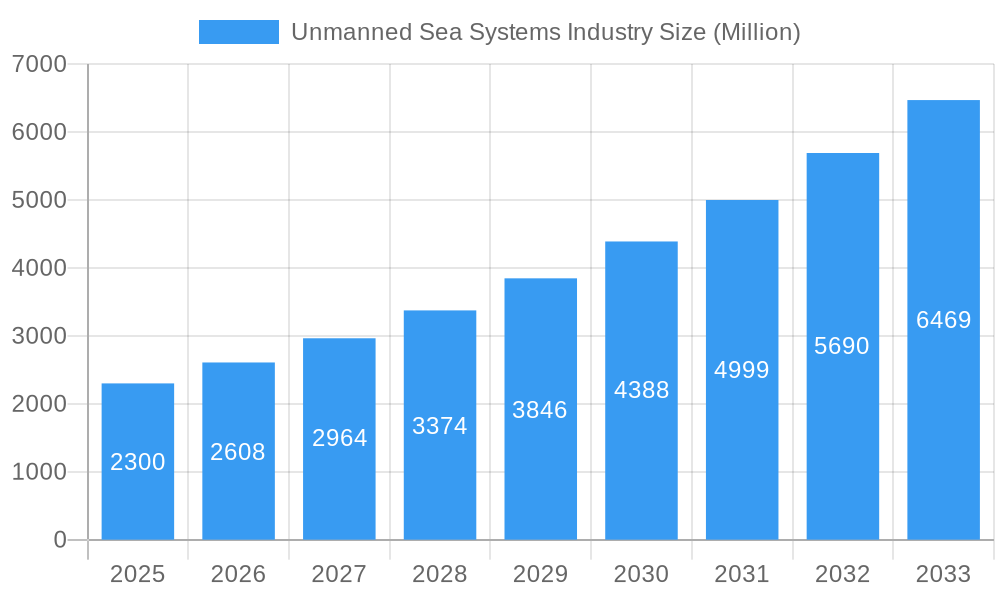
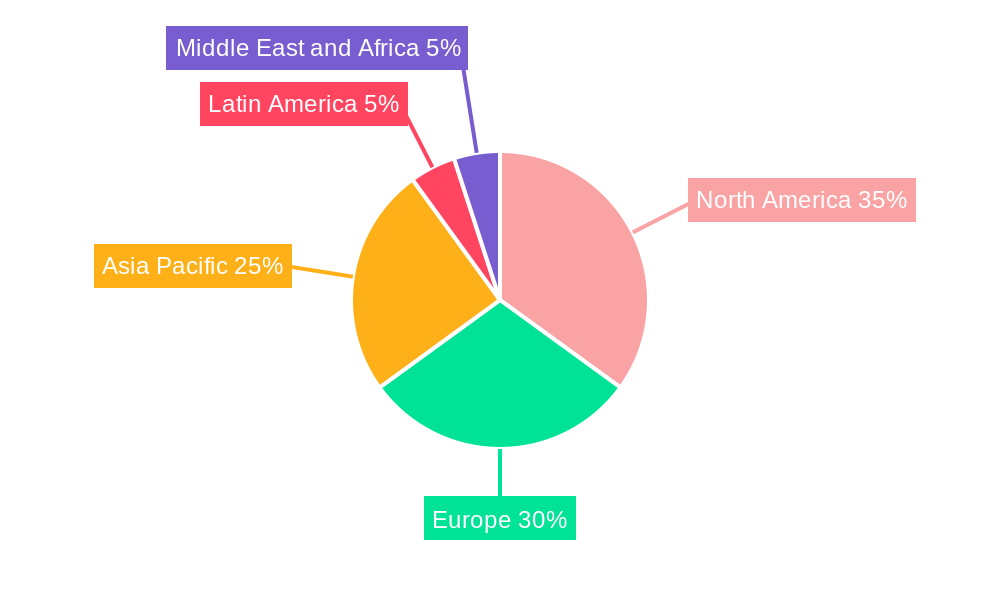
The Unmanned Sea Systems (USS) industry, encompassing Unmanned Underwater Vehicles (UUVs), Unmanned Surface Vehicles (USVs), and encompassing Remotely Operated Vehicles (ROVs) and Autonomous Vehicles (AVs), is experiencing robust growth, projected to reach a market size of $2.3 billion in 2025. This expansion is fueled by increasing military investments in autonomous maritime surveillance and defense systems, coupled with burgeoning commercial applications in oceanographic research, offshore energy exploration, and maritime infrastructure inspection. The diverse applications of USS across military (anti-submarine warfare, mine countermeasures), commercial (subsea infrastructure monitoring, seabed mapping), and other sectors (environmental monitoring, search and rescue) are driving market expansion. Technological advancements in areas like AI-powered navigation, improved sensor integration, and enhanced communication systems are further accelerating adoption. The market is segmented geographically, with North America and Europe currently holding significant market share due to strong technological capabilities and substantial defense budgets. However, the Asia-Pacific region is poised for rapid growth driven by increasing infrastructure development and government initiatives.
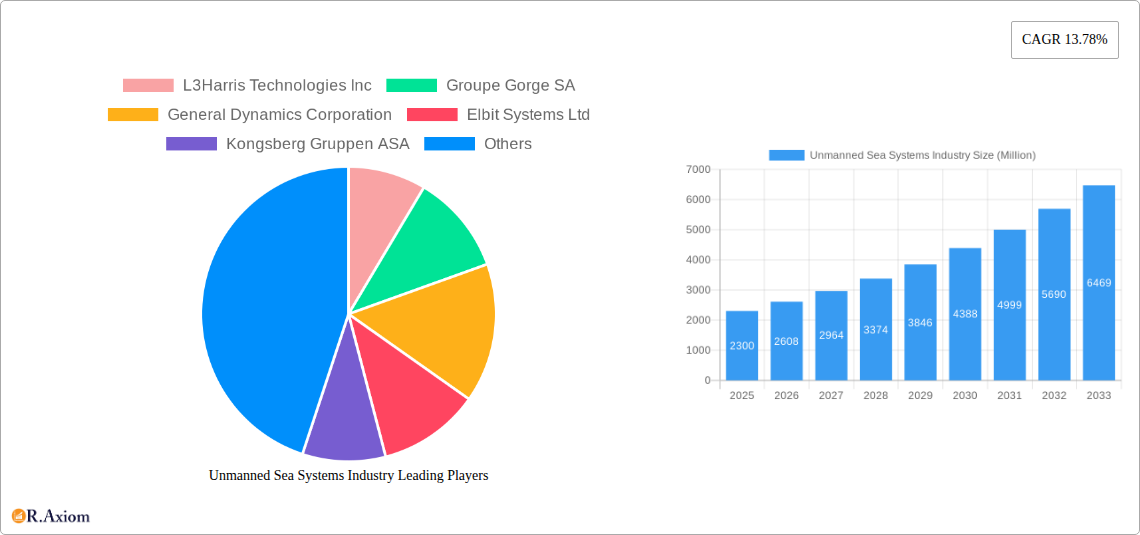
Unmanned Sea Systems Industry Market Size (In Billion)
Despite promising growth projections, the USS market faces challenges. High initial investment costs for sophisticated systems and the need for specialized skilled personnel can limit adoption, particularly for smaller companies. Regulatory hurdles related to autonomous navigation and data security also pose constraints on market growth. Nevertheless, ongoing technological innovation and increasing demand across various application areas are expected to mitigate these challenges, leading to a sustained Compound Annual Growth Rate (CAGR) of 13.78% from 2025-2033. The market's future trajectory depends significantly on continued investment in research and development, the creation of robust regulatory frameworks, and the successful integration of advanced technologies into existing operational workflows. Competitive landscape is marked by a mix of established defense contractors and specialized technology companies, driving innovation and offering diverse solutions to meet market needs.
Unmanned Sea Systems Industry Company Market Share
Unmanned Sea Systems Industry: A Comprehensive Market Analysis (2019-2033)
This comprehensive report provides an in-depth analysis of the Unmanned Sea Systems (USS) industry, covering the period from 2019 to 2033. It examines market dynamics, key players, technological advancements, and future growth prospects. The report is essential for industry stakeholders, investors, and researchers seeking a detailed understanding of this rapidly evolving sector. The report utilizes data from 2019-2024 as the historical period, 2025 as the base and estimated year, and 2025-2033 as the forecast period. The market is segmented by type (Unmanned Underwater Vehicles (UUV), Unmanned Surface Vehicles (USV)), capability (Remotely Operated Vehicles, Autonomous Vehicles), and application (Military, Commercial, Other Applications).
Unmanned Sea Systems Industry Market Concentration & Innovation
The Unmanned Sea Systems market is characterized by a moderately concentrated landscape, with a few major players holding significant market share. Companies like L3Harris Technologies Inc, General Dynamics Corporation, and Lockheed Martin Corporation have established strong positions through extensive R&D, strategic acquisitions, and long-term government contracts. However, smaller, specialized companies are also making inroads, particularly in the niche areas of autonomous navigation and advanced sensor technologies.
- Market Share: The top 5 players collectively hold an estimated xx% market share in 2025, with L3Harris Technologies Inc holding approximately xx%. This concentration is expected to slightly decrease by 2033 due to increased competition and the emergence of innovative startups.
- Innovation Drivers: Advancements in AI, robotics, sensor technology, and communication systems are major drivers of innovation. Miniaturization, increased autonomy, and improved payload capabilities are key trends.
- Regulatory Frameworks: International and national maritime regulations significantly impact the development and deployment of USS. Standards related to safety, data security, and environmental impact are continuously evolving.
- Product Substitutes: While direct substitutes are limited, the increasing affordability and capability of other surveillance and inspection technologies might pose indirect competitive pressures.
- End-User Trends: The growing demand for enhanced maritime security, offshore resource exploration, and oceanographic research is driving market expansion across various applications.
- M&A Activities: The industry has witnessed significant M&A activity in recent years. Deal values have fluctuated, with larger transactions exceeding USD 100 Million focused on gaining technological expertise and expanding market reach. For instance, xx major M&A deals were completed between 2019 and 2024, totaling an approximate value of USD xx Million.
Unmanned Sea Systems Industry Industry Trends & Insights
The Unmanned Sea Systems industry is experiencing robust growth, driven by several factors. Increased defense spending, particularly in naval modernization programs, is fueling demand for military applications. Simultaneously, the commercial sector is embracing USS for tasks such as offshore inspection, environmental monitoring, and underwater infrastructure maintenance. This dual-market driver creates a strong foundation for sustained growth.
The market is expected to witness significant technological disruption in the coming years. The integration of artificial intelligence (AI) and machine learning (ML) will enhance the autonomy and operational efficiency of USS. Advances in sensor technology and improved communication systems are also crucial. Consumer preferences are shifting towards more reliable, cost-effective, and user-friendly systems. The competitive landscape remains dynamic, with established players investing heavily in R&D and smaller companies entering the market with innovative solutions. The Compound Annual Growth Rate (CAGR) is projected to be xx% during the forecast period (2025-2033), with a market penetration rate of xx% by 2033 in the commercial sector.
Dominant Markets & Segments in Unmanned Sea Systems Industry
The North American region, particularly the United States, dominates the Unmanned Sea Systems market, driven by significant military spending and technological advancements. The region is the largest adopter of both UUVs and USVs across military and commercial applications. The Asia-Pacific region is exhibiting rapid growth, fueled by increased naval modernization programs and expanding commercial applications. Europe holds a strong position, particularly in the development of advanced autonomous vehicles.
- Type: The UUV segment holds a larger market share than the USV segment in 2025, driven by increasing demand for underwater surveillance and inspection. However, the USV market is projected to witness faster growth in the forecast period due to expanding commercial applications.
- Capability: The Autonomous Vehicles segment shows robust growth due to its efficiency and reduced operational costs. The Remotely Operated Vehicles (ROV) segment continues to be a significant market segment, especially for tasks requiring high maneuverability and precision.
- Application: The Military application segment accounts for a considerable portion of the overall market, with growing demand for UUVs and USVs for intelligence gathering, mine countermeasures, and anti-submarine warfare. However, the Commercial segment is exhibiting rapid growth, driven by the increasing adoption of USS in various civilian applications.
Key Drivers for Regional Dominance:
- North America: High defense budgets, strong technological base, established industry players.
- Asia-Pacific: Increasing naval modernization, economic growth, rising demand for maritime security.
- Europe: Focus on technological innovation, strong research infrastructure, government support for autonomous systems.
Unmanned Sea Systems Industry Product Developments
Recent product innovations include the development of more compact and energy-efficient UUVs, improved autonomous navigation systems for both UUVs and USVs, integration of advanced sensor suites, and the introduction of hybrid systems combining ROV and autonomous capabilities. These advancements aim to improve operational efficiency, reduce costs, and enhance the capabilities of Unmanned Sea Systems. The market fit is driven by the growing need for enhanced situational awareness, reduced reliance on manned platforms, and efficient operation in diverse environments.
Report Scope & Segmentation Analysis
This report provides a comprehensive analysis of the Unmanned Sea Systems market, segmented by type (UUVs and USVs), capability (ROVs and Autonomous Vehicles), and application (Military, Commercial, and Other Applications). Each segment's growth projections, market sizes (in Millions of USD), and competitive dynamics are analyzed. Growth rates vary across segments, with autonomous vehicles and commercial applications showing particularly high growth potential.
Key Drivers of Unmanned Sea Systems Industry Growth
Several factors are driving the growth of the Unmanned Sea Systems industry. These include increasing defense budgets globally, especially for naval modernization, the need for improved maritime security and surveillance, advancements in autonomous technology, and the increasing demand for cost-effective solutions in commercial applications, such as offshore energy exploration and environmental monitoring. Government initiatives promoting the adoption of unmanned systems also contribute to market growth.
Challenges in the Unmanned Sea Systems Industry Sector
The Unmanned Sea Systems industry faces various challenges, including stringent regulatory hurdles for deployment and operation, supply chain constraints impacting component availability and costs, and significant competitive pressure among both established players and emerging innovative companies. The high initial investment costs and technological complexities associated with development and deployment of advanced systems also present obstacles. These factors can potentially impact the market's growth trajectory.
Emerging Opportunities in Unmanned Sea Systems Industry
Emerging opportunities exist in the development and deployment of more sophisticated AI-powered autonomous systems, expanded applications in areas like oceanographic research, underwater infrastructure inspection, and aquaculture, and the integration of USS into broader maritime surveillance and security networks. The growing focus on sustainable maritime operations also presents opportunities for environmentally friendly and energy-efficient USS solutions.
Leading Players in the Unmanned Sea Systems Industry Market
- L3Harris Technologies Inc
- Groupe Gorge SA
- General Dynamics Corporation
- Elbit Systems Ltd
- Kongsberg Gruppen ASA
- Lockheed Martin Corporation
- Maritime Robotics AS
- Teledyne Technologies Incorporated
- thyssenkrupp AG
- BAE Systems plc
- Saab AB
- The Boeing Company
Key Developments in Unmanned Sea Systems Industry Industry
- September 2023: HII received a FAR-based contract from the US Navy for USD 19 Million with a ceiling of USD 347 Million to begin shipments of the REMUS 300 to PMS 408 by September 2024, with ongoing technology advancements and deliveries through 2028. This signifies a significant investment in UUV technology and long-term commitment to the REMUS platform.
- October 2023: The Naval Sea Systems Command, Washington, DC, signed a modification contract with Lockheed Martin Corporation to provide engineering support for Extra Large Unmanned Undersea Vehicle (UUV). The value of the contract was USD 11 Million, and it will be completed by September 2024. This contract highlights the ongoing development of advanced UUV capabilities for the US Navy.
Strategic Outlook for Unmanned Sea Systems Industry Market
The Unmanned Sea Systems market is poised for substantial growth, driven by continuous technological advancements, increased defense spending, and expanding commercial applications. The integration of AI and improved sensor capabilities will unlock new opportunities and applications, particularly in autonomous navigation, enhanced situational awareness, and cost-effective operations. Future market potential lies in the development of more versatile, reliable, and user-friendly systems catering to diverse customer needs across both military and commercial sectors.
Unmanned Sea Systems Industry Segmentation
- 1. Production Analysis
- 2. Consumption Analysis
- 3. Import Market Analysis (Value & Volume)
- 4. Export Market Analysis (Value & Volume)
- 5. Price Trend Analysis
Unmanned Sea Systems Industry Segmentation By Geography
-
1. North America
- 1.1. United States
- 1.2. Canada
- 1.3. Mexico
-
2. South America
- 2.1. Brazil
- 2.2. Argentina
- 2.3. Rest of South America
-
3. Europe
- 3.1. United Kingdom
- 3.2. Germany
- 3.3. France
- 3.4. Italy
- 3.5. Spain
- 3.6. Russia
- 3.7. Benelux
- 3.8. Nordics
- 3.9. Rest of Europe
-
4. Middle East & Africa
- 4.1. Turkey
- 4.2. Israel
- 4.3. GCC
- 4.4. North Africa
- 4.5. South Africa
- 4.6. Rest of Middle East & Africa
-
5. Asia Pacific
- 5.1. China
- 5.2. India
- 5.3. Japan
- 5.4. South Korea
- 5.5. ASEAN
- 5.6. Oceania
- 5.7. Rest of Asia Pacific
Unmanned Sea Systems Industry Regional Market Share
Geographic Coverage of Unmanned Sea Systems Industry
Unmanned Sea Systems Industry REPORT HIGHLIGHTS
| Aspects | Details |
|---|---|
| Study Period | 2020-2034 |
| Base Year | 2025 |
| Estimated Year | 2026 |
| Forecast Period | 2026-2034 |
| Historical Period | 2020-2025 |
| Growth Rate | CAGR of 13.78% from 2020-2034 |
| Segmentation |
|
Table of Contents
- 1. Introduction
- 1.1. Research Scope
- 1.2. Market Segmentation
- 1.3. Research Objective
- 1.4. Definitions and Assumptions
- 2. Executive Summary
- 2.1. Market Snapshot
- 3. Market Dynamics
- 3.1. Market Drivers
- 3.2. Market Restrains
- 3.3. Market Trends
- 3.4. Market Opportunities
- 4. Market Factor Analysis
- 4.1. Porters Five Forces
- 4.1.1. Bargaining Power of Suppliers
- 4.1.2. Bargaining Power of Buyers
- 4.1.3. Threat of New Entrants
- 4.1.4. Threat of Substitutes
- 4.1.5. Competitive Rivalry
- 4.2. PESTEL analysis
- 4.3. BCG Analysis
- 4.3.1. Stars (High Growth, High Market Share)
- 4.3.2. Cash Cows (Low Growth, High Market Share)
- 4.3.3. Question Mark (High Growth, Low Market Share)
- 4.3.4. Dogs (Low Growth, Low Market Share)
- 4.4. Ansoff Matrix Analysis
- 4.5. Supply Chain Analysis
- 4.6. Regulatory Landscape
- 4.7. Current Market Potential and Opportunity Assessment (TAM–SAM–SOM Framework)
- 4.8. RAX Analyst Note
- 4.1. Porters Five Forces
- 5. Market Analysis, Insights and Forecast 2021-2033
- 5.1. Market Analysis, Insights and Forecast - by Production Analysis
- 5.2. Market Analysis, Insights and Forecast - by Consumption Analysis
- 5.3. Market Analysis, Insights and Forecast - by Import Market Analysis (Value & Volume)
- 5.4. Market Analysis, Insights and Forecast - by Export Market Analysis (Value & Volume)
- 5.5. Market Analysis, Insights and Forecast - by Price Trend Analysis
- 5.6. Market Analysis, Insights and Forecast - by Region
- 5.6.1. North America
- 5.6.2. South America
- 5.6.3. Europe
- 5.6.4. Middle East & Africa
- 5.6.5. Asia Pacific
- 6. Global Unmanned Sea Systems Industry Analysis, Insights and Forecast, 2021-2033
- 6.1. Market Analysis, Insights and Forecast - by Production Analysis
- 6.2. Market Analysis, Insights and Forecast - by Consumption Analysis
- 6.3. Market Analysis, Insights and Forecast - by Import Market Analysis (Value & Volume)
- 6.4. Market Analysis, Insights and Forecast - by Export Market Analysis (Value & Volume)
- 6.5. Market Analysis, Insights and Forecast - by Price Trend Analysis
- 7. North America Unmanned Sea Systems Industry Analysis, Insights and Forecast, 2020-2032
- 7.1. Market Analysis, Insights and Forecast - by Production Analysis
- 7.2. Market Analysis, Insights and Forecast - by Consumption Analysis
- 7.3. Market Analysis, Insights and Forecast - by Import Market Analysis (Value & Volume)
- 7.4. Market Analysis, Insights and Forecast - by Export Market Analysis (Value & Volume)
- 7.5. Market Analysis, Insights and Forecast - by Price Trend Analysis
- 8. South America Unmanned Sea Systems Industry Analysis, Insights and Forecast, 2020-2032
- 8.1. Market Analysis, Insights and Forecast - by Production Analysis
- 8.2. Market Analysis, Insights and Forecast - by Consumption Analysis
- 8.3. Market Analysis, Insights and Forecast - by Import Market Analysis (Value & Volume)
- 8.4. Market Analysis, Insights and Forecast - by Export Market Analysis (Value & Volume)
- 8.5. Market Analysis, Insights and Forecast - by Price Trend Analysis
- 9. Europe Unmanned Sea Systems Industry Analysis, Insights and Forecast, 2020-2032
- 9.1. Market Analysis, Insights and Forecast - by Production Analysis
- 9.2. Market Analysis, Insights and Forecast - by Consumption Analysis
- 9.3. Market Analysis, Insights and Forecast - by Import Market Analysis (Value & Volume)
- 9.4. Market Analysis, Insights and Forecast - by Export Market Analysis (Value & Volume)
- 9.5. Market Analysis, Insights and Forecast - by Price Trend Analysis
- 10. Middle East & Africa Unmanned Sea Systems Industry Analysis, Insights and Forecast, 2020-2032
- 10.1. Market Analysis, Insights and Forecast - by Production Analysis
- 10.2. Market Analysis, Insights and Forecast - by Consumption Analysis
- 10.3. Market Analysis, Insights and Forecast - by Import Market Analysis (Value & Volume)
- 10.4. Market Analysis, Insights and Forecast - by Export Market Analysis (Value & Volume)
- 10.5. Market Analysis, Insights and Forecast - by Price Trend Analysis
- 11. Asia Pacific Unmanned Sea Systems Industry Analysis, Insights and Forecast, 2020-2032
- 11.1. Market Analysis, Insights and Forecast - by Production Analysis
- 11.2. Market Analysis, Insights and Forecast - by Consumption Analysis
- 11.3. Market Analysis, Insights and Forecast - by Import Market Analysis (Value & Volume)
- 11.4. Market Analysis, Insights and Forecast - by Export Market Analysis (Value & Volume)
- 11.5. Market Analysis, Insights and Forecast - by Price Trend Analysis
- 12. Competitive Analysis
- 12.1. Company Profiles
- 12.1.1 L3Harris Technologies Inc
- 12.1.1.1. Company Overview
- 12.1.1.2. Products
- 12.1.1.3. Company Financials
- 12.1.1.4. SWOT Analysis
- 12.1.2 Groupe Gorge SA
- 12.1.2.1. Company Overview
- 12.1.2.2. Products
- 12.1.2.3. Company Financials
- 12.1.2.4. SWOT Analysis
- 12.1.3 General Dynamics Corporation
- 12.1.3.1. Company Overview
- 12.1.3.2. Products
- 12.1.3.3. Company Financials
- 12.1.3.4. SWOT Analysis
- 12.1.4 Elbit Systems Ltd
- 12.1.4.1. Company Overview
- 12.1.4.2. Products
- 12.1.4.3. Company Financials
- 12.1.4.4. SWOT Analysis
- 12.1.5 Kongsberg Gruppen ASA
- 12.1.5.1. Company Overview
- 12.1.5.2. Products
- 12.1.5.3. Company Financials
- 12.1.5.4. SWOT Analysis
- 12.1.6 Lockheed Martin Corporation
- 12.1.6.1. Company Overview
- 12.1.6.2. Products
- 12.1.6.3. Company Financials
- 12.1.6.4. SWOT Analysis
- 12.1.7 Maritime Robotics AS
- 12.1.7.1. Company Overview
- 12.1.7.2. Products
- 12.1.7.3. Company Financials
- 12.1.7.4. SWOT Analysis
- 12.1.8 Teledyne Technologies Incorporated
- 12.1.8.1. Company Overview
- 12.1.8.2. Products
- 12.1.8.3. Company Financials
- 12.1.8.4. SWOT Analysis
- 12.1.9 thyssenkrupp AG
- 12.1.9.1. Company Overview
- 12.1.9.2. Products
- 12.1.9.3. Company Financials
- 12.1.9.4. SWOT Analysis
- 12.1.10 BAE Systems plc
- 12.1.10.1. Company Overview
- 12.1.10.2. Products
- 12.1.10.3. Company Financials
- 12.1.10.4. SWOT Analysis
- 12.1.11 Saab AB
- 12.1.11.1. Company Overview
- 12.1.11.2. Products
- 12.1.11.3. Company Financials
- 12.1.11.4. SWOT Analysis
- 12.1.12 The Boeing Company
- 12.1.12.1. Company Overview
- 12.1.12.2. Products
- 12.1.12.3. Company Financials
- 12.1.12.4. SWOT Analysis
- 12.1.1 L3Harris Technologies Inc
- 12.2. Market Entropy
- 12.2.1 Company's Key Areas Served
- 12.2.2 Recent Developments
- 12.3. Company Market Share Analysis 2025
- 12.3.1 Top 5 Companies Market Share Analysis
- 12.3.2 Top 3 Companies Market Share Analysis
- 12.4. List of Potential Customers
- 13. Research Methodology
List of Figures
- Figure 1: Global Unmanned Sea Systems Industry Revenue Breakdown (Million, %) by Region 2025 & 2033
- Figure 2: North America Unmanned Sea Systems Industry Revenue (Million), by Production Analysis 2025 & 2033
- Figure 3: North America Unmanned Sea Systems Industry Revenue Share (%), by Production Analysis 2025 & 2033
- Figure 4: North America Unmanned Sea Systems Industry Revenue (Million), by Consumption Analysis 2025 & 2033
- Figure 5: North America Unmanned Sea Systems Industry Revenue Share (%), by Consumption Analysis 2025 & 2033
- Figure 6: North America Unmanned Sea Systems Industry Revenue (Million), by Import Market Analysis (Value & Volume) 2025 & 2033
- Figure 7: North America Unmanned Sea Systems Industry Revenue Share (%), by Import Market Analysis (Value & Volume) 2025 & 2033
- Figure 8: North America Unmanned Sea Systems Industry Revenue (Million), by Export Market Analysis (Value & Volume) 2025 & 2033
- Figure 9: North America Unmanned Sea Systems Industry Revenue Share (%), by Export Market Analysis (Value & Volume) 2025 & 2033
- Figure 10: North America Unmanned Sea Systems Industry Revenue (Million), by Price Trend Analysis 2025 & 2033
- Figure 11: North America Unmanned Sea Systems Industry Revenue Share (%), by Price Trend Analysis 2025 & 2033
- Figure 12: North America Unmanned Sea Systems Industry Revenue (Million), by Country 2025 & 2033
- Figure 13: North America Unmanned Sea Systems Industry Revenue Share (%), by Country 2025 & 2033
- Figure 14: South America Unmanned Sea Systems Industry Revenue (Million), by Production Analysis 2025 & 2033
- Figure 15: South America Unmanned Sea Systems Industry Revenue Share (%), by Production Analysis 2025 & 2033
- Figure 16: South America Unmanned Sea Systems Industry Revenue (Million), by Consumption Analysis 2025 & 2033
- Figure 17: South America Unmanned Sea Systems Industry Revenue Share (%), by Consumption Analysis 2025 & 2033
- Figure 18: South America Unmanned Sea Systems Industry Revenue (Million), by Import Market Analysis (Value & Volume) 2025 & 2033
- Figure 19: South America Unmanned Sea Systems Industry Revenue Share (%), by Import Market Analysis (Value & Volume) 2025 & 2033
- Figure 20: South America Unmanned Sea Systems Industry Revenue (Million), by Export Market Analysis (Value & Volume) 2025 & 2033
- Figure 21: South America Unmanned Sea Systems Industry Revenue Share (%), by Export Market Analysis (Value & Volume) 2025 & 2033
- Figure 22: South America Unmanned Sea Systems Industry Revenue (Million), by Price Trend Analysis 2025 & 2033
- Figure 23: South America Unmanned Sea Systems Industry Revenue Share (%), by Price Trend Analysis 2025 & 2033
- Figure 24: South America Unmanned Sea Systems Industry Revenue (Million), by Country 2025 & 2033
- Figure 25: South America Unmanned Sea Systems Industry Revenue Share (%), by Country 2025 & 2033
- Figure 26: Europe Unmanned Sea Systems Industry Revenue (Million), by Production Analysis 2025 & 2033
- Figure 27: Europe Unmanned Sea Systems Industry Revenue Share (%), by Production Analysis 2025 & 2033
- Figure 28: Europe Unmanned Sea Systems Industry Revenue (Million), by Consumption Analysis 2025 & 2033
- Figure 29: Europe Unmanned Sea Systems Industry Revenue Share (%), by Consumption Analysis 2025 & 2033
- Figure 30: Europe Unmanned Sea Systems Industry Revenue (Million), by Import Market Analysis (Value & Volume) 2025 & 2033
- Figure 31: Europe Unmanned Sea Systems Industry Revenue Share (%), by Import Market Analysis (Value & Volume) 2025 & 2033
- Figure 32: Europe Unmanned Sea Systems Industry Revenue (Million), by Export Market Analysis (Value & Volume) 2025 & 2033
- Figure 33: Europe Unmanned Sea Systems Industry Revenue Share (%), by Export Market Analysis (Value & Volume) 2025 & 2033
- Figure 34: Europe Unmanned Sea Systems Industry Revenue (Million), by Price Trend Analysis 2025 & 2033
- Figure 35: Europe Unmanned Sea Systems Industry Revenue Share (%), by Price Trend Analysis 2025 & 2033
- Figure 36: Europe Unmanned Sea Systems Industry Revenue (Million), by Country 2025 & 2033
- Figure 37: Europe Unmanned Sea Systems Industry Revenue Share (%), by Country 2025 & 2033
- Figure 38: Middle East & Africa Unmanned Sea Systems Industry Revenue (Million), by Production Analysis 2025 & 2033
- Figure 39: Middle East & Africa Unmanned Sea Systems Industry Revenue Share (%), by Production Analysis 2025 & 2033
- Figure 40: Middle East & Africa Unmanned Sea Systems Industry Revenue (Million), by Consumption Analysis 2025 & 2033
- Figure 41: Middle East & Africa Unmanned Sea Systems Industry Revenue Share (%), by Consumption Analysis 2025 & 2033
- Figure 42: Middle East & Africa Unmanned Sea Systems Industry Revenue (Million), by Import Market Analysis (Value & Volume) 2025 & 2033
- Figure 43: Middle East & Africa Unmanned Sea Systems Industry Revenue Share (%), by Import Market Analysis (Value & Volume) 2025 & 2033
- Figure 44: Middle East & Africa Unmanned Sea Systems Industry Revenue (Million), by Export Market Analysis (Value & Volume) 2025 & 2033
- Figure 45: Middle East & Africa Unmanned Sea Systems Industry Revenue Share (%), by Export Market Analysis (Value & Volume) 2025 & 2033
- Figure 46: Middle East & Africa Unmanned Sea Systems Industry Revenue (Million), by Price Trend Analysis 2025 & 2033
- Figure 47: Middle East & Africa Unmanned Sea Systems Industry Revenue Share (%), by Price Trend Analysis 2025 & 2033
- Figure 48: Middle East & Africa Unmanned Sea Systems Industry Revenue (Million), by Country 2025 & 2033
- Figure 49: Middle East & Africa Unmanned Sea Systems Industry Revenue Share (%), by Country 2025 & 2033
- Figure 50: Asia Pacific Unmanned Sea Systems Industry Revenue (Million), by Production Analysis 2025 & 2033
- Figure 51: Asia Pacific Unmanned Sea Systems Industry Revenue Share (%), by Production Analysis 2025 & 2033
- Figure 52: Asia Pacific Unmanned Sea Systems Industry Revenue (Million), by Consumption Analysis 2025 & 2033
- Figure 53: Asia Pacific Unmanned Sea Systems Industry Revenue Share (%), by Consumption Analysis 2025 & 2033
- Figure 54: Asia Pacific Unmanned Sea Systems Industry Revenue (Million), by Import Market Analysis (Value & Volume) 2025 & 2033
- Figure 55: Asia Pacific Unmanned Sea Systems Industry Revenue Share (%), by Import Market Analysis (Value & Volume) 2025 & 2033
- Figure 56: Asia Pacific Unmanned Sea Systems Industry Revenue (Million), by Export Market Analysis (Value & Volume) 2025 & 2033
- Figure 57: Asia Pacific Unmanned Sea Systems Industry Revenue Share (%), by Export Market Analysis (Value & Volume) 2025 & 2033
- Figure 58: Asia Pacific Unmanned Sea Systems Industry Revenue (Million), by Price Trend Analysis 2025 & 2033
- Figure 59: Asia Pacific Unmanned Sea Systems Industry Revenue Share (%), by Price Trend Analysis 2025 & 2033
- Figure 60: Asia Pacific Unmanned Sea Systems Industry Revenue (Million), by Country 2025 & 2033
- Figure 61: Asia Pacific Unmanned Sea Systems Industry Revenue Share (%), by Country 2025 & 2033
List of Tables
- Table 1: Global Unmanned Sea Systems Industry Revenue Million Forecast, by Production Analysis 2020 & 2033
- Table 2: Global Unmanned Sea Systems Industry Revenue Million Forecast, by Consumption Analysis 2020 & 2033
- Table 3: Global Unmanned Sea Systems Industry Revenue Million Forecast, by Import Market Analysis (Value & Volume) 2020 & 2033
- Table 4: Global Unmanned Sea Systems Industry Revenue Million Forecast, by Export Market Analysis (Value & Volume) 2020 & 2033
- Table 5: Global Unmanned Sea Systems Industry Revenue Million Forecast, by Price Trend Analysis 2020 & 2033
- Table 6: Global Unmanned Sea Systems Industry Revenue Million Forecast, by Region 2020 & 2033
- Table 7: Global Unmanned Sea Systems Industry Revenue Million Forecast, by Production Analysis 2020 & 2033
- Table 8: Global Unmanned Sea Systems Industry Revenue Million Forecast, by Consumption Analysis 2020 & 2033
- Table 9: Global Unmanned Sea Systems Industry Revenue Million Forecast, by Import Market Analysis (Value & Volume) 2020 & 2033
- Table 10: Global Unmanned Sea Systems Industry Revenue Million Forecast, by Export Market Analysis (Value & Volume) 2020 & 2033
- Table 11: Global Unmanned Sea Systems Industry Revenue Million Forecast, by Price Trend Analysis 2020 & 2033
- Table 12: Global Unmanned Sea Systems Industry Revenue Million Forecast, by Country 2020 & 2033
- Table 13: United States Unmanned Sea Systems Industry Revenue (Million) Forecast, by Application 2020 & 2033
- Table 14: Canada Unmanned Sea Systems Industry Revenue (Million) Forecast, by Application 2020 & 2033
- Table 15: Mexico Unmanned Sea Systems Industry Revenue (Million) Forecast, by Application 2020 & 2033
- Table 16: Global Unmanned Sea Systems Industry Revenue Million Forecast, by Production Analysis 2020 & 2033
- Table 17: Global Unmanned Sea Systems Industry Revenue Million Forecast, by Consumption Analysis 2020 & 2033
- Table 18: Global Unmanned Sea Systems Industry Revenue Million Forecast, by Import Market Analysis (Value & Volume) 2020 & 2033
- Table 19: Global Unmanned Sea Systems Industry Revenue Million Forecast, by Export Market Analysis (Value & Volume) 2020 & 2033
- Table 20: Global Unmanned Sea Systems Industry Revenue Million Forecast, by Price Trend Analysis 2020 & 2033
- Table 21: Global Unmanned Sea Systems Industry Revenue Million Forecast, by Country 2020 & 2033
- Table 22: Brazil Unmanned Sea Systems Industry Revenue (Million) Forecast, by Application 2020 & 2033
- Table 23: Argentina Unmanned Sea Systems Industry Revenue (Million) Forecast, by Application 2020 & 2033
- Table 24: Rest of South America Unmanned Sea Systems Industry Revenue (Million) Forecast, by Application 2020 & 2033
- Table 25: Global Unmanned Sea Systems Industry Revenue Million Forecast, by Production Analysis 2020 & 2033
- Table 26: Global Unmanned Sea Systems Industry Revenue Million Forecast, by Consumption Analysis 2020 & 2033
- Table 27: Global Unmanned Sea Systems Industry Revenue Million Forecast, by Import Market Analysis (Value & Volume) 2020 & 2033
- Table 28: Global Unmanned Sea Systems Industry Revenue Million Forecast, by Export Market Analysis (Value & Volume) 2020 & 2033
- Table 29: Global Unmanned Sea Systems Industry Revenue Million Forecast, by Price Trend Analysis 2020 & 2033
- Table 30: Global Unmanned Sea Systems Industry Revenue Million Forecast, by Country 2020 & 2033
- Table 31: United Kingdom Unmanned Sea Systems Industry Revenue (Million) Forecast, by Application 2020 & 2033
- Table 32: Germany Unmanned Sea Systems Industry Revenue (Million) Forecast, by Application 2020 & 2033
- Table 33: France Unmanned Sea Systems Industry Revenue (Million) Forecast, by Application 2020 & 2033
- Table 34: Italy Unmanned Sea Systems Industry Revenue (Million) Forecast, by Application 2020 & 2033
- Table 35: Spain Unmanned Sea Systems Industry Revenue (Million) Forecast, by Application 2020 & 2033
- Table 36: Russia Unmanned Sea Systems Industry Revenue (Million) Forecast, by Application 2020 & 2033
- Table 37: Benelux Unmanned Sea Systems Industry Revenue (Million) Forecast, by Application 2020 & 2033
- Table 38: Nordics Unmanned Sea Systems Industry Revenue (Million) Forecast, by Application 2020 & 2033
- Table 39: Rest of Europe Unmanned Sea Systems Industry Revenue (Million) Forecast, by Application 2020 & 2033
- Table 40: Global Unmanned Sea Systems Industry Revenue Million Forecast, by Production Analysis 2020 & 2033
- Table 41: Global Unmanned Sea Systems Industry Revenue Million Forecast, by Consumption Analysis 2020 & 2033
- Table 42: Global Unmanned Sea Systems Industry Revenue Million Forecast, by Import Market Analysis (Value & Volume) 2020 & 2033
- Table 43: Global Unmanned Sea Systems Industry Revenue Million Forecast, by Export Market Analysis (Value & Volume) 2020 & 2033
- Table 44: Global Unmanned Sea Systems Industry Revenue Million Forecast, by Price Trend Analysis 2020 & 2033
- Table 45: Global Unmanned Sea Systems Industry Revenue Million Forecast, by Country 2020 & 2033
- Table 46: Turkey Unmanned Sea Systems Industry Revenue (Million) Forecast, by Application 2020 & 2033
- Table 47: Israel Unmanned Sea Systems Industry Revenue (Million) Forecast, by Application 2020 & 2033
- Table 48: GCC Unmanned Sea Systems Industry Revenue (Million) Forecast, by Application 2020 & 2033
- Table 49: North Africa Unmanned Sea Systems Industry Revenue (Million) Forecast, by Application 2020 & 2033
- Table 50: South Africa Unmanned Sea Systems Industry Revenue (Million) Forecast, by Application 2020 & 2033
- Table 51: Rest of Middle East & Africa Unmanned Sea Systems Industry Revenue (Million) Forecast, by Application 2020 & 2033
- Table 52: Global Unmanned Sea Systems Industry Revenue Million Forecast, by Production Analysis 2020 & 2033
- Table 53: Global Unmanned Sea Systems Industry Revenue Million Forecast, by Consumption Analysis 2020 & 2033
- Table 54: Global Unmanned Sea Systems Industry Revenue Million Forecast, by Import Market Analysis (Value & Volume) 2020 & 2033
- Table 55: Global Unmanned Sea Systems Industry Revenue Million Forecast, by Export Market Analysis (Value & Volume) 2020 & 2033
- Table 56: Global Unmanned Sea Systems Industry Revenue Million Forecast, by Price Trend Analysis 2020 & 2033
- Table 57: Global Unmanned Sea Systems Industry Revenue Million Forecast, by Country 2020 & 2033
- Table 58: China Unmanned Sea Systems Industry Revenue (Million) Forecast, by Application 2020 & 2033
- Table 59: India Unmanned Sea Systems Industry Revenue (Million) Forecast, by Application 2020 & 2033
- Table 60: Japan Unmanned Sea Systems Industry Revenue (Million) Forecast, by Application 2020 & 2033
- Table 61: South Korea Unmanned Sea Systems Industry Revenue (Million) Forecast, by Application 2020 & 2033
- Table 62: ASEAN Unmanned Sea Systems Industry Revenue (Million) Forecast, by Application 2020 & 2033
- Table 63: Oceania Unmanned Sea Systems Industry Revenue (Million) Forecast, by Application 2020 & 2033
- Table 64: Rest of Asia Pacific Unmanned Sea Systems Industry Revenue (Million) Forecast, by Application 2020 & 2033
Frequently Asked Questions
1. What is the projected Compound Annual Growth Rate (CAGR) of the Unmanned Sea Systems Industry?
The projected CAGR is approximately 13.78%.
2. Which companies are prominent players in the Unmanned Sea Systems Industry?
Key companies in the market include L3Harris Technologies Inc, Groupe Gorge SA, General Dynamics Corporation, Elbit Systems Ltd, Kongsberg Gruppen ASA, Lockheed Martin Corporation, Maritime Robotics AS, Teledyne Technologies Incorporated, thyssenkrupp AG, BAE Systems plc, Saab AB, The Boeing Company.
3. What are the main segments of the Unmanned Sea Systems Industry?
The market segments include Production Analysis, Consumption Analysis, Import Market Analysis (Value & Volume), Export Market Analysis (Value & Volume), Price Trend Analysis.
4. Can you provide details about the market size?
The market size is estimated to be USD 2.30 Million as of 2022.
5. What are some drivers contributing to market growth?
Increase in Internet of Things (IoT) and Autonomous Systems; Rise in Demand for Military and Defense Satellite Communication Solutions.
6. What are the notable trends driving market growth?
Remotely Operated Vehicles (ROVs) Segment Will Showcase Significant Growth During the Forecast Period.
7. Are there any restraints impacting market growth?
Cybersecurity Threats to Satellite Communication; Interference in Transmission of Data.
8. Can you provide examples of recent developments in the market?
October 2023: The Naval Sea Systems Command, Washington, DC, signed a modification contract with Lockheed Martin Corporation to provide engineering support for Extra Large Unmanned Undersea Vehicle (UUV). The value of the contract was USD 11 million, and it will be completed by September 2024.
9. What pricing options are available for accessing the report?
Pricing options include single-user, multi-user, and enterprise licenses priced at USD 4750, USD 5250, and USD 8750 respectively.
10. Is the market size provided in terms of value or volume?
The market size is provided in terms of value, measured in Million.
11. Are there any specific market keywords associated with the report?
Yes, the market keyword associated with the report is "Unmanned Sea Systems Industry," which aids in identifying and referencing the specific market segment covered.
12. How do I determine which pricing option suits my needs best?
The pricing options vary based on user requirements and access needs. Individual users may opt for single-user licenses, while businesses requiring broader access may choose multi-user or enterprise licenses for cost-effective access to the report.
13. Are there any additional resources or data provided in the Unmanned Sea Systems Industry report?
While the report offers comprehensive insights, it's advisable to review the specific contents or supplementary materials provided to ascertain if additional resources or data are available.
14. How can I stay updated on further developments or reports in the Unmanned Sea Systems Industry?
To stay informed about further developments, trends, and reports in the Unmanned Sea Systems Industry, consider subscribing to industry newsletters, following relevant companies and organizations, or regularly checking reputable industry news sources and publications.
Methodology
Step 1 - Identification of Relevant Samples Size from Population Database


Step 2 - Approaches for Defining Global Market Size (Value, Volume* & Price*)

Note*: In applicable scenarios
Step 3 - Data Sources
Primary Research
- Web Analytics
- Survey Reports
- Research Institute
- Latest Research Reports
- Opinion Leaders
Secondary Research
- Annual Reports
- White Paper
- Latest Press Release
- Industry Association
- Paid Database
- Investor Presentations

Step 4 - Data Triangulation
Involves using different sources of information in order to increase the validity of a study
These sources are likely to be stakeholders in a program - participants, other researchers, program staff, other community members, and so on.
Then we put all data in single framework & apply various statistical tools to find out the dynamic on the market.
During the analysis stage, feedback from the stakeholder groups would be compared to determine areas of agreement as well as areas of divergence