
Key Insights
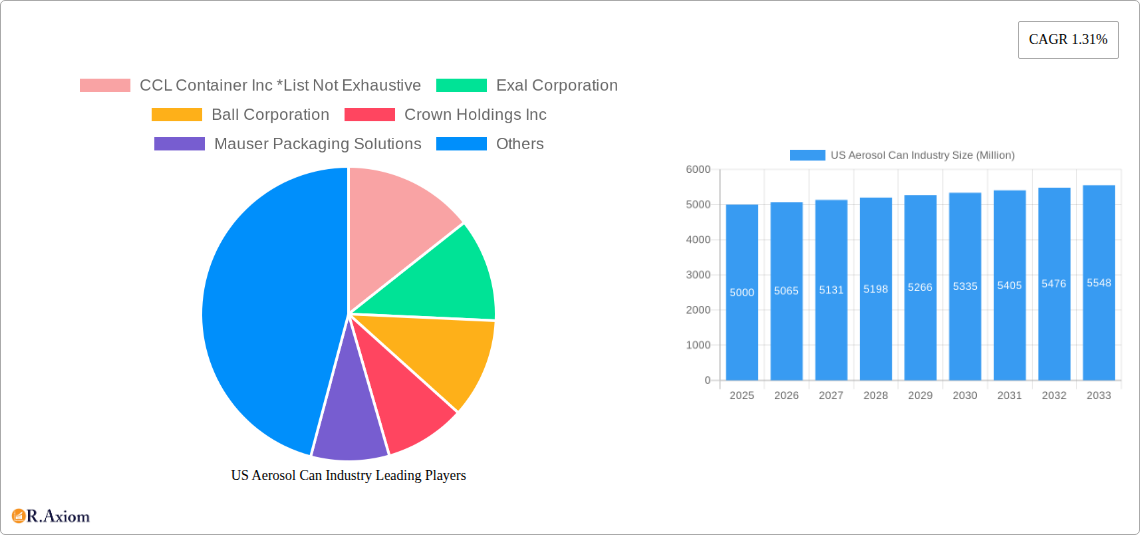
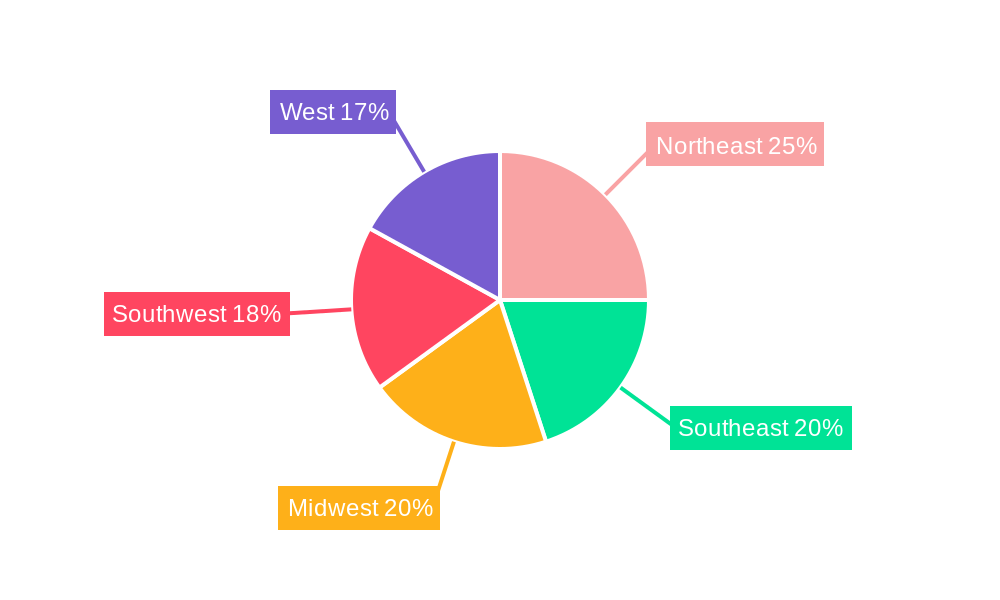
The US aerosol can market, valued at approximately $5 billion in 2025, is projected to experience steady growth, driven primarily by the increasing demand from the cosmetic and personal care, pharmaceutical/veterinary, and household sectors. Aluminum remains the dominant material type, owing to its lightweight nature, recyclability, and compatibility with a wide range of products. However, the market is witnessing a gradual shift towards sustainable packaging solutions, with a rising interest in steel-tinplate cans and other eco-friendly alternatives. Growth is further fueled by innovations in can design and functionality, catering to evolving consumer preferences and product formulations. Regional variations exist, with the Northeast and West potentially exhibiting higher growth rates due to strong consumer spending and a higher concentration of key industries. Competitive landscape is characterized by established players like Ball Corporation and Crown Holdings Inc., along with smaller niche players focusing on specialized can designs or sustainable materials. Challenges include fluctuating raw material prices, stringent environmental regulations, and increasing transportation costs. The forecast period (2025-2033) anticipates a continued, albeit moderate, expansion of the market, driven by product diversification and increasing adoption of aerosol packaging across diverse industries.
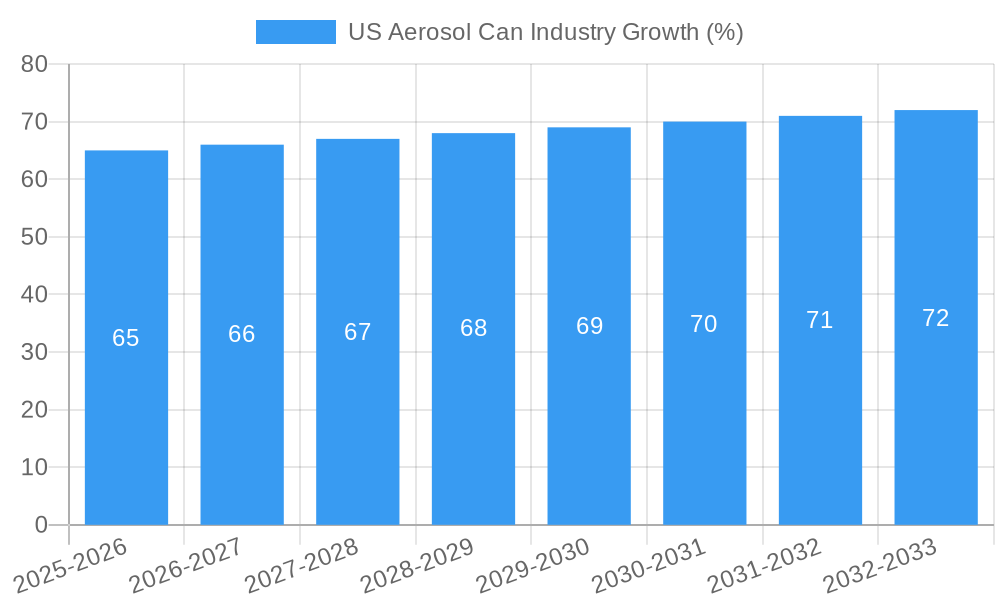
Despite the inherent challenges, the long-term outlook for the US aerosol can market remains positive. The projected CAGR of 1.31% indicates a relatively stable growth trajectory, primarily supported by the ongoing demand across various end-use sectors. The market is expected to see strategic mergers and acquisitions as larger players seek to expand their market share and product portfolio. Furthermore, advancements in manufacturing technologies, particularly those aimed at improving sustainability and reducing environmental impact, are likely to shape the market's future. Companies are increasingly focusing on lightweighting designs and exploring innovative materials to address concerns regarding carbon footprint and waste management. The continued growth across sectors like personal care and pharmaceuticals will contribute significantly to the market's overall expansion in the coming years.
This comprehensive report provides an in-depth analysis of the US aerosol can industry, offering valuable insights into market dynamics, growth drivers, challenges, and future opportunities. Covering the period from 2019 to 2033, with a base year of 2025, this report is an essential resource for industry stakeholders, investors, and strategic decision-makers. The report leverages extensive primary and secondary research to provide a detailed understanding of market segmentation, competitive landscape, and future trends.
US Aerosol Can Industry Market Concentration & Innovation
This section analyzes the competitive landscape of the US aerosol can industry, examining market concentration, innovation drivers, regulatory frameworks, product substitutes, end-user trends, and mergers and acquisitions (M&A) activities. The market is moderately concentrated, with key players holding significant market share. For example, Ball Corporation and Crown Holdings Inc. are estimated to hold a combined xx% market share in 2025, while CCL Container Inc. holds approximately xx%. However, the presence of several smaller players contributes to a dynamic competitive environment.
- Innovation Drivers: Sustainable packaging solutions (lightweighting, recyclable materials), improved dispensing technologies, and specialized coatings are driving innovation.
- Regulatory Framework: Environmental regulations (e.g., reducing propellant emissions) and safety standards influence product development and material selection.
- Product Substitutes: Alternative packaging formats (e.g., pouches, pumps) pose a competitive threat, particularly in certain end-use segments.
- End-User Trends: Growing demand from the cosmetic and personal care sector, coupled with increasing popularity of aerosol-based household and automotive products, fuel market growth.
- M&A Activity: The industry has witnessed several significant M&A deals in recent years, with total deal values exceeding $xx Million in the period 2019-2024. These transactions have reshaped the competitive landscape and fostered innovation.
US Aerosol Can Industry Industry Trends & Insights
The US aerosol can industry is experiencing robust growth, driven by several key factors. The Compound Annual Growth Rate (CAGR) during the forecast period (2025-2033) is projected at xx%, fueled by increasing consumer preference for convenience and the versatility of aerosol packaging across various end-use sectors. Technological advancements, such as improved coating techniques and sustainable material utilization, are also significantly impacting industry growth. The increasing adoption of eco-friendly propellants and recyclable materials is becoming a major driver. Market penetration of aluminum cans is expected to remain high due to their lightweight and corrosion-resistant properties. However, steel-tinplate cans will continue to hold a significant share owing to their cost-effectiveness. The competitive landscape is characterized by intense rivalry amongst major players, focusing on innovation, cost optimization, and strategic partnerships.
Dominant Markets & Segments in US Aerosol Can Industry
The largest segment by product type is Aluminum cans, holding an estimated xx% market share in 2025, followed by Steel-Tinplate at xx% and Other Materials at xx%. In terms of end-users, the Cosmetic and Personal Care segment dominates, contributing approximately xx% of the total market value in 2025, followed by Household and Pharmaceutical/Veterinary. The strong growth of the Cosmetic and Personal Care sector is largely driven by the increasing demand for convenient and easy-to-use products among consumers.
- Key Drivers for Aluminum Can Dominance: Lightweight properties, excellent corrosion resistance, and suitability for a wide range of products.
- Key Drivers for Cosmetic and Personal Care Segment Dominance: Increasing consumer demand for convenient and aesthetically appealing personal care products.
US Aerosol Can Industry Product Developments
Recent product innovations focus on sustainable materials, improved dispensing mechanisms, and enhanced functionality. This includes the introduction of lightweight aluminum cans, recyclable materials, and aerosols with reduced propellant emissions. These developments aim to meet growing consumer demand for eco-friendly and convenient packaging solutions, while enhancing product performance and safety. The integration of smart technologies, such as sensors for monitoring product usage, is also gaining traction.
Report Scope & Segmentation Analysis
This report segments the US aerosol can market by product type (Aluminum, Steel-Tinplate, Other Materials) and end-user (Cosmetic and Personal Care, Household, Pharmaceutical/Veterinary, Paints and Varnishes, Automotive/Industrial, Other End-Users). Each segment is analyzed in terms of market size, growth projections, and competitive dynamics. The Aluminum segment projects substantial growth due to its lightweight and sustainable attributes, while the Cosmetic and Personal Care end-use sector is projected to dominate owing to increasing demand for convenient products.
Key Drivers of US Aerosol Can Industry Growth
Growth in the US aerosol can industry is primarily driven by rising consumer demand for convenient packaging, particularly in the personal care and household sectors. Technological advancements in materials science and dispensing technologies are further propelling market expansion. Favorable economic conditions and supportive government policies also contribute to the growth of this sector. For example, the increasing demand for sustainably sourced materials has led to innovations in recyclable and lightweight can designs.
Challenges in the US Aerosol Can Industry Sector
The industry faces challenges including fluctuations in raw material prices, stringent environmental regulations, and intense competition from alternative packaging solutions. Supply chain disruptions can also significantly impact production and profitability. Regulatory changes related to propellant emissions and material composition require continuous adaptation and investment from industry players. The estimated impact of these challenges on market growth is a reduction of approximately xx% in the next five years.
Emerging Opportunities in US Aerosol Can Industry
Opportunities exist in developing sustainable and eco-friendly aerosol cans using recycled materials and reducing reliance on harmful propellants. Expanding into new markets and product applications, such as specialized industrial aerosols and pharmaceutical packaging, offers significant potential. Tailoring products to meet niche consumer preferences and incorporating smart packaging technologies present additional growth avenues.
Leading Players in the US Aerosol Can Industry Market
- CCL Container Inc
- Exal Corporation
- Ball Corporation
- Crown Holdings Inc
- Mauser Packaging Solutions
Key Developments in US Aerosol Can Industry Industry
- January 2023: Ball Corporation announces a new line of recyclable aluminum aerosol cans.
- March 2022: Crown Holdings Inc. invests in a new facility for sustainable aerosol can production.
- June 2021: CCL Container Inc. launches a new range of aerosol cans with improved dispensing technology. (Further developments need to be added here)
Strategic Outlook for US Aerosol Can Industry Market
The US aerosol can industry is poised for continued growth, driven by increasing consumer demand, technological innovation, and the emergence of sustainable packaging solutions. The industry will see increased focus on reducing environmental impact, expanding into new markets and applications, and leveraging advanced technologies to improve product performance and enhance customer experience. Growth is anticipated to remain strong throughout the forecast period, with significant opportunities for market expansion and innovation.
US Aerosol Can Industry Segmentation
-
1. Product type
- 1.1. Aluminum
- 1.2. Steel-Tinplate
- 1.3. Other Materials
-
2. End-User
- 2.1. Cosmetic and Personal Care
- 2.2. Household
- 2.3. Pharmaceutical/Veterinary
- 2.4. Paints and Varnishes
- 2.5. Automotive/Industrial
- 2.6. Other End Users
US Aerosol Can Industry Segmentation By Geography
-
1. North America
- 1.1. United States
- 1.2. Canada
- 1.3. Mexico
-
2. South America
- 2.1. Brazil
- 2.2. Argentina
- 2.3. Rest of South America
-
3. Europe
- 3.1. United Kingdom
- 3.2. Germany
- 3.3. France
- 3.4. Italy
- 3.5. Spain
- 3.6. Russia
- 3.7. Benelux
- 3.8. Nordics
- 3.9. Rest of Europe
-
4. Middle East & Africa
- 4.1. Turkey
- 4.2. Israel
- 4.3. GCC
- 4.4. North Africa
- 4.5. South Africa
- 4.6. Rest of Middle East & Africa
-
5. Asia Pacific
- 5.1. China
- 5.2. India
- 5.3. Japan
- 5.4. South Korea
- 5.5. ASEAN
- 5.6. Oceania
- 5.7. Rest of Asia Pacific
US Aerosol Can Industry REPORT HIGHLIGHTS
| Aspects | Details |
|---|---|
| Study Period | 2019-2033 |
| Base Year | 2024 |
| Estimated Year | 2025 |
| Forecast Period | 2025-2033 |
| Historical Period | 2019-2024 |
| Growth Rate | CAGR of 1.31% from 2019-2033 |
| Segmentation |
|
Table of Contents
- 1. Introduction
- 1.1. Research Scope
- 1.2. Market Segmentation
- 1.3. Research Methodology
- 1.4. Definitions and Assumptions
- 2. Executive Summary
- 2.1. Introduction
- 3. Market Dynamics
- 3.1. Introduction
- 3.2. Market Drivers
- 3.2.1. ; Growing Demand from the Cosmetic Industry
- 3.3. Market Restrains
- 3.3.1. ; Increasing Competition from Substitute Packaging
- 3.4. Market Trends
- 3.4.1. Aluminum Cans to Register Highest Growth
- 4. Market Factor Analysis
- 4.1. Porters Five Forces
- 4.2. Supply/Value Chain
- 4.3. PESTEL analysis
- 4.4. Market Entropy
- 4.5. Patent/Trademark Analysis
- 5. Global US Aerosol Can Industry Analysis, Insights and Forecast, 2019-2031
- 5.1. Market Analysis, Insights and Forecast - by Product type
- 5.1.1. Aluminum
- 5.1.2. Steel-Tinplate
- 5.1.3. Other Materials
- 5.2. Market Analysis, Insights and Forecast - by End-User
- 5.2.1. Cosmetic and Personal Care
- 5.2.2. Household
- 5.2.3. Pharmaceutical/Veterinary
- 5.2.4. Paints and Varnishes
- 5.2.5. Automotive/Industrial
- 5.2.6. Other End Users
- 5.3. Market Analysis, Insights and Forecast - by Region
- 5.3.1. North America
- 5.3.2. South America
- 5.3.3. Europe
- 5.3.4. Middle East & Africa
- 5.3.5. Asia Pacific
- 5.1. Market Analysis, Insights and Forecast - by Product type
- 6. North America US Aerosol Can Industry Analysis, Insights and Forecast, 2019-2031
- 6.1. Market Analysis, Insights and Forecast - by Product type
- 6.1.1. Aluminum
- 6.1.2. Steel-Tinplate
- 6.1.3. Other Materials
- 6.2. Market Analysis, Insights and Forecast - by End-User
- 6.2.1. Cosmetic and Personal Care
- 6.2.2. Household
- 6.2.3. Pharmaceutical/Veterinary
- 6.2.4. Paints and Varnishes
- 6.2.5. Automotive/Industrial
- 6.2.6. Other End Users
- 6.1. Market Analysis, Insights and Forecast - by Product type
- 7. South America US Aerosol Can Industry Analysis, Insights and Forecast, 2019-2031
- 7.1. Market Analysis, Insights and Forecast - by Product type
- 7.1.1. Aluminum
- 7.1.2. Steel-Tinplate
- 7.1.3. Other Materials
- 7.2. Market Analysis, Insights and Forecast - by End-User
- 7.2.1. Cosmetic and Personal Care
- 7.2.2. Household
- 7.2.3. Pharmaceutical/Veterinary
- 7.2.4. Paints and Varnishes
- 7.2.5. Automotive/Industrial
- 7.2.6. Other End Users
- 7.1. Market Analysis, Insights and Forecast - by Product type
- 8. Europe US Aerosol Can Industry Analysis, Insights and Forecast, 2019-2031
- 8.1. Market Analysis, Insights and Forecast - by Product type
- 8.1.1. Aluminum
- 8.1.2. Steel-Tinplate
- 8.1.3. Other Materials
- 8.2. Market Analysis, Insights and Forecast - by End-User
- 8.2.1. Cosmetic and Personal Care
- 8.2.2. Household
- 8.2.3. Pharmaceutical/Veterinary
- 8.2.4. Paints and Varnishes
- 8.2.5. Automotive/Industrial
- 8.2.6. Other End Users
- 8.1. Market Analysis, Insights and Forecast - by Product type
- 9. Middle East & Africa US Aerosol Can Industry Analysis, Insights and Forecast, 2019-2031
- 9.1. Market Analysis, Insights and Forecast - by Product type
- 9.1.1. Aluminum
- 9.1.2. Steel-Tinplate
- 9.1.3. Other Materials
- 9.2. Market Analysis, Insights and Forecast - by End-User
- 9.2.1. Cosmetic and Personal Care
- 9.2.2. Household
- 9.2.3. Pharmaceutical/Veterinary
- 9.2.4. Paints and Varnishes
- 9.2.5. Automotive/Industrial
- 9.2.6. Other End Users
- 9.1. Market Analysis, Insights and Forecast - by Product type
- 10. Asia Pacific US Aerosol Can Industry Analysis, Insights and Forecast, 2019-2031
- 10.1. Market Analysis, Insights and Forecast - by Product type
- 10.1.1. Aluminum
- 10.1.2. Steel-Tinplate
- 10.1.3. Other Materials
- 10.2. Market Analysis, Insights and Forecast - by End-User
- 10.2.1. Cosmetic and Personal Care
- 10.2.2. Household
- 10.2.3. Pharmaceutical/Veterinary
- 10.2.4. Paints and Varnishes
- 10.2.5. Automotive/Industrial
- 10.2.6. Other End Users
- 10.1. Market Analysis, Insights and Forecast - by Product type
- 11. Northeast US Aerosol Can Industry Analysis, Insights and Forecast, 2019-2031
- 12. Southeast US Aerosol Can Industry Analysis, Insights and Forecast, 2019-2031
- 13. Midwest US Aerosol Can Industry Analysis, Insights and Forecast, 2019-2031
- 14. Southwest US Aerosol Can Industry Analysis, Insights and Forecast, 2019-2031
- 15. West US Aerosol Can Industry Analysis, Insights and Forecast, 2019-2031
- 16. Competitive Analysis
- 16.1. Global Market Share Analysis 2024
- 16.2. Company Profiles
- 16.2.1 CCL Container Inc *List Not Exhaustive
- 16.2.1.1. Overview
- 16.2.1.2. Products
- 16.2.1.3. SWOT Analysis
- 16.2.1.4. Recent Developments
- 16.2.1.5. Financials (Based on Availability)
- 16.2.2 Exal Corporation
- 16.2.2.1. Overview
- 16.2.2.2. Products
- 16.2.2.3. SWOT Analysis
- 16.2.2.4. Recent Developments
- 16.2.2.5. Financials (Based on Availability)
- 16.2.3 Ball Corporation
- 16.2.3.1. Overview
- 16.2.3.2. Products
- 16.2.3.3. SWOT Analysis
- 16.2.3.4. Recent Developments
- 16.2.3.5. Financials (Based on Availability)
- 16.2.4 Crown Holdings Inc
- 16.2.4.1. Overview
- 16.2.4.2. Products
- 16.2.4.3. SWOT Analysis
- 16.2.4.4. Recent Developments
- 16.2.4.5. Financials (Based on Availability)
- 16.2.5 Mauser Packaging Solutions
- 16.2.5.1. Overview
- 16.2.5.2. Products
- 16.2.5.3. SWOT Analysis
- 16.2.5.4. Recent Developments
- 16.2.5.5. Financials (Based on Availability)
- 16.2.1 CCL Container Inc *List Not Exhaustive
List of Figures
- Figure 1: Global US Aerosol Can Industry Revenue Breakdown (Million, %) by Region 2024 & 2032
- Figure 2: United states US Aerosol Can Industry Revenue (Million), by Country 2024 & 2032
- Figure 3: United states US Aerosol Can Industry Revenue Share (%), by Country 2024 & 2032
- Figure 4: North America US Aerosol Can Industry Revenue (Million), by Product type 2024 & 2032
- Figure 5: North America US Aerosol Can Industry Revenue Share (%), by Product type 2024 & 2032
- Figure 6: North America US Aerosol Can Industry Revenue (Million), by End-User 2024 & 2032
- Figure 7: North America US Aerosol Can Industry Revenue Share (%), by End-User 2024 & 2032
- Figure 8: North America US Aerosol Can Industry Revenue (Million), by Country 2024 & 2032
- Figure 9: North America US Aerosol Can Industry Revenue Share (%), by Country 2024 & 2032
- Figure 10: South America US Aerosol Can Industry Revenue (Million), by Product type 2024 & 2032
- Figure 11: South America US Aerosol Can Industry Revenue Share (%), by Product type 2024 & 2032
- Figure 12: South America US Aerosol Can Industry Revenue (Million), by End-User 2024 & 2032
- Figure 13: South America US Aerosol Can Industry Revenue Share (%), by End-User 2024 & 2032
- Figure 14: South America US Aerosol Can Industry Revenue (Million), by Country 2024 & 2032
- Figure 15: South America US Aerosol Can Industry Revenue Share (%), by Country 2024 & 2032
- Figure 16: Europe US Aerosol Can Industry Revenue (Million), by Product type 2024 & 2032
- Figure 17: Europe US Aerosol Can Industry Revenue Share (%), by Product type 2024 & 2032
- Figure 18: Europe US Aerosol Can Industry Revenue (Million), by End-User 2024 & 2032
- Figure 19: Europe US Aerosol Can Industry Revenue Share (%), by End-User 2024 & 2032
- Figure 20: Europe US Aerosol Can Industry Revenue (Million), by Country 2024 & 2032
- Figure 21: Europe US Aerosol Can Industry Revenue Share (%), by Country 2024 & 2032
- Figure 22: Middle East & Africa US Aerosol Can Industry Revenue (Million), by Product type 2024 & 2032
- Figure 23: Middle East & Africa US Aerosol Can Industry Revenue Share (%), by Product type 2024 & 2032
- Figure 24: Middle East & Africa US Aerosol Can Industry Revenue (Million), by End-User 2024 & 2032
- Figure 25: Middle East & Africa US Aerosol Can Industry Revenue Share (%), by End-User 2024 & 2032
- Figure 26: Middle East & Africa US Aerosol Can Industry Revenue (Million), by Country 2024 & 2032
- Figure 27: Middle East & Africa US Aerosol Can Industry Revenue Share (%), by Country 2024 & 2032
- Figure 28: Asia Pacific US Aerosol Can Industry Revenue (Million), by Product type 2024 & 2032
- Figure 29: Asia Pacific US Aerosol Can Industry Revenue Share (%), by Product type 2024 & 2032
- Figure 30: Asia Pacific US Aerosol Can Industry Revenue (Million), by End-User 2024 & 2032
- Figure 31: Asia Pacific US Aerosol Can Industry Revenue Share (%), by End-User 2024 & 2032
- Figure 32: Asia Pacific US Aerosol Can Industry Revenue (Million), by Country 2024 & 2032
- Figure 33: Asia Pacific US Aerosol Can Industry Revenue Share (%), by Country 2024 & 2032
List of Tables
- Table 1: Global US Aerosol Can Industry Revenue Million Forecast, by Region 2019 & 2032
- Table 2: Global US Aerosol Can Industry Revenue Million Forecast, by Product type 2019 & 2032
- Table 3: Global US Aerosol Can Industry Revenue Million Forecast, by End-User 2019 & 2032
- Table 4: Global US Aerosol Can Industry Revenue Million Forecast, by Region 2019 & 2032
- Table 5: Global US Aerosol Can Industry Revenue Million Forecast, by Country 2019 & 2032
- Table 6: Northeast US Aerosol Can Industry Revenue (Million) Forecast, by Application 2019 & 2032
- Table 7: Southeast US Aerosol Can Industry Revenue (Million) Forecast, by Application 2019 & 2032
- Table 8: Midwest US Aerosol Can Industry Revenue (Million) Forecast, by Application 2019 & 2032
- Table 9: Southwest US Aerosol Can Industry Revenue (Million) Forecast, by Application 2019 & 2032
- Table 10: West US Aerosol Can Industry Revenue (Million) Forecast, by Application 2019 & 2032
- Table 11: Global US Aerosol Can Industry Revenue Million Forecast, by Product type 2019 & 2032
- Table 12: Global US Aerosol Can Industry Revenue Million Forecast, by End-User 2019 & 2032
- Table 13: Global US Aerosol Can Industry Revenue Million Forecast, by Country 2019 & 2032
- Table 14: United States US Aerosol Can Industry Revenue (Million) Forecast, by Application 2019 & 2032
- Table 15: Canada US Aerosol Can Industry Revenue (Million) Forecast, by Application 2019 & 2032
- Table 16: Mexico US Aerosol Can Industry Revenue (Million) Forecast, by Application 2019 & 2032
- Table 17: Global US Aerosol Can Industry Revenue Million Forecast, by Product type 2019 & 2032
- Table 18: Global US Aerosol Can Industry Revenue Million Forecast, by End-User 2019 & 2032
- Table 19: Global US Aerosol Can Industry Revenue Million Forecast, by Country 2019 & 2032
- Table 20: Brazil US Aerosol Can Industry Revenue (Million) Forecast, by Application 2019 & 2032
- Table 21: Argentina US Aerosol Can Industry Revenue (Million) Forecast, by Application 2019 & 2032
- Table 22: Rest of South America US Aerosol Can Industry Revenue (Million) Forecast, by Application 2019 & 2032
- Table 23: Global US Aerosol Can Industry Revenue Million Forecast, by Product type 2019 & 2032
- Table 24: Global US Aerosol Can Industry Revenue Million Forecast, by End-User 2019 & 2032
- Table 25: Global US Aerosol Can Industry Revenue Million Forecast, by Country 2019 & 2032
- Table 26: United Kingdom US Aerosol Can Industry Revenue (Million) Forecast, by Application 2019 & 2032
- Table 27: Germany US Aerosol Can Industry Revenue (Million) Forecast, by Application 2019 & 2032
- Table 28: France US Aerosol Can Industry Revenue (Million) Forecast, by Application 2019 & 2032
- Table 29: Italy US Aerosol Can Industry Revenue (Million) Forecast, by Application 2019 & 2032
- Table 30: Spain US Aerosol Can Industry Revenue (Million) Forecast, by Application 2019 & 2032
- Table 31: Russia US Aerosol Can Industry Revenue (Million) Forecast, by Application 2019 & 2032
- Table 32: Benelux US Aerosol Can Industry Revenue (Million) Forecast, by Application 2019 & 2032
- Table 33: Nordics US Aerosol Can Industry Revenue (Million) Forecast, by Application 2019 & 2032
- Table 34: Rest of Europe US Aerosol Can Industry Revenue (Million) Forecast, by Application 2019 & 2032
- Table 35: Global US Aerosol Can Industry Revenue Million Forecast, by Product type 2019 & 2032
- Table 36: Global US Aerosol Can Industry Revenue Million Forecast, by End-User 2019 & 2032
- Table 37: Global US Aerosol Can Industry Revenue Million Forecast, by Country 2019 & 2032
- Table 38: Turkey US Aerosol Can Industry Revenue (Million) Forecast, by Application 2019 & 2032
- Table 39: Israel US Aerosol Can Industry Revenue (Million) Forecast, by Application 2019 & 2032
- Table 40: GCC US Aerosol Can Industry Revenue (Million) Forecast, by Application 2019 & 2032
- Table 41: North Africa US Aerosol Can Industry Revenue (Million) Forecast, by Application 2019 & 2032
- Table 42: South Africa US Aerosol Can Industry Revenue (Million) Forecast, by Application 2019 & 2032
- Table 43: Rest of Middle East & Africa US Aerosol Can Industry Revenue (Million) Forecast, by Application 2019 & 2032
- Table 44: Global US Aerosol Can Industry Revenue Million Forecast, by Product type 2019 & 2032
- Table 45: Global US Aerosol Can Industry Revenue Million Forecast, by End-User 2019 & 2032
- Table 46: Global US Aerosol Can Industry Revenue Million Forecast, by Country 2019 & 2032
- Table 47: China US Aerosol Can Industry Revenue (Million) Forecast, by Application 2019 & 2032
- Table 48: India US Aerosol Can Industry Revenue (Million) Forecast, by Application 2019 & 2032
- Table 49: Japan US Aerosol Can Industry Revenue (Million) Forecast, by Application 2019 & 2032
- Table 50: South Korea US Aerosol Can Industry Revenue (Million) Forecast, by Application 2019 & 2032
- Table 51: ASEAN US Aerosol Can Industry Revenue (Million) Forecast, by Application 2019 & 2032
- Table 52: Oceania US Aerosol Can Industry Revenue (Million) Forecast, by Application 2019 & 2032
- Table 53: Rest of Asia Pacific US Aerosol Can Industry Revenue (Million) Forecast, by Application 2019 & 2032
Frequently Asked Questions
1. What is the projected Compound Annual Growth Rate (CAGR) of the US Aerosol Can Industry?
The projected CAGR is approximately 1.31%.
2. Which companies are prominent players in the US Aerosol Can Industry?
Key companies in the market include CCL Container Inc *List Not Exhaustive, Exal Corporation, Ball Corporation, Crown Holdings Inc, Mauser Packaging Solutions.
3. What are the main segments of the US Aerosol Can Industry?
The market segments include Product type, End-User.
4. Can you provide details about the market size?
The market size is estimated to be USD XX Million as of 2022.
5. What are some drivers contributing to market growth?
; Growing Demand from the Cosmetic Industry.
6. What are the notable trends driving market growth?
Aluminum Cans to Register Highest Growth.
7. Are there any restraints impacting market growth?
; Increasing Competition from Substitute Packaging.
8. Can you provide examples of recent developments in the market?
N/A
9. What pricing options are available for accessing the report?
Pricing options include single-user, multi-user, and enterprise licenses priced at USD 3800, USD 4500, and USD 5800 respectively.
10. Is the market size provided in terms of value or volume?
The market size is provided in terms of value, measured in Million.
11. Are there any specific market keywords associated with the report?
Yes, the market keyword associated with the report is "US Aerosol Can Industry," which aids in identifying and referencing the specific market segment covered.
12. How do I determine which pricing option suits my needs best?
The pricing options vary based on user requirements and access needs. Individual users may opt for single-user licenses, while businesses requiring broader access may choose multi-user or enterprise licenses for cost-effective access to the report.
13. Are there any additional resources or data provided in the US Aerosol Can Industry report?
While the report offers comprehensive insights, it's advisable to review the specific contents or supplementary materials provided to ascertain if additional resources or data are available.
14. How can I stay updated on further developments or reports in the US Aerosol Can Industry?
To stay informed about further developments, trends, and reports in the US Aerosol Can Industry, consider subscribing to industry newsletters, following relevant companies and organizations, or regularly checking reputable industry news sources and publications.
Methodology
Step 1 - Identification of Relevant Samples Size from Population Database


Step 2 - Approaches for Defining Global Market Size (Value, Volume* & Price*)

Note*: In applicable scenarios
Step 3 - Data Sources
Primary Research
- Web Analytics
- Survey Reports
- Research Institute
- Latest Research Reports
- Opinion Leaders
Secondary Research
- Annual Reports
- White Paper
- Latest Press Release
- Industry Association
- Paid Database
- Investor Presentations

Step 4 - Data Triangulation
Involves using different sources of information in order to increase the validity of a study
These sources are likely to be stakeholders in a program - participants, other researchers, program staff, other community members, and so on.
Then we put all data in single framework & apply various statistical tools to find out the dynamic on the market.
During the analysis stage, feedback from the stakeholder groups would be compared to determine areas of agreement as well as areas of divergence


