
Key Insights
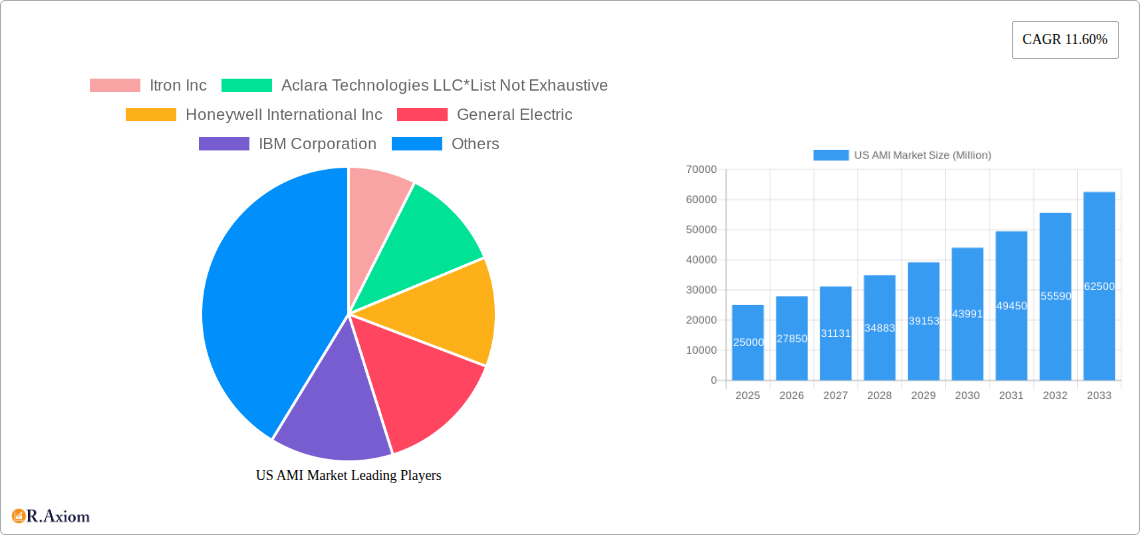
The US Advanced Metering Infrastructure (AMI) market is experiencing robust growth, driven by increasing demand for efficient energy management, grid modernization initiatives, and the expanding adoption of smart city projects. A compound annual growth rate (CAGR) of 11.60% from 2019 to 2024 suggests a significant market expansion. This growth is fueled by several factors. The proliferation of smart metering devices for electricity, water, and gas is a key driver, enabling utilities to remotely monitor consumption, detect leaks, and improve overall grid efficiency. Furthermore, the development and deployment of sophisticated Meter Data Management (MDM) and Meter Data Analytics (MDA) software solutions are empowering utilities to make data-driven decisions, optimizing operations, and enhancing customer service. The increasing penetration of smart meters in residential, commercial, and industrial sectors is further propelling market growth. While regulatory mandates and initial investment costs present some restraints, the long-term benefits of improved energy efficiency, reduced operational costs, and enhanced grid reliability far outweigh these challenges. The market is segmented by device type, solution, software, services, and end-user, with strong growth projected across all segments. Major players like Itron, Aclara, Honeywell, GE, and IBM are actively shaping the market landscape through innovation and strategic partnerships.
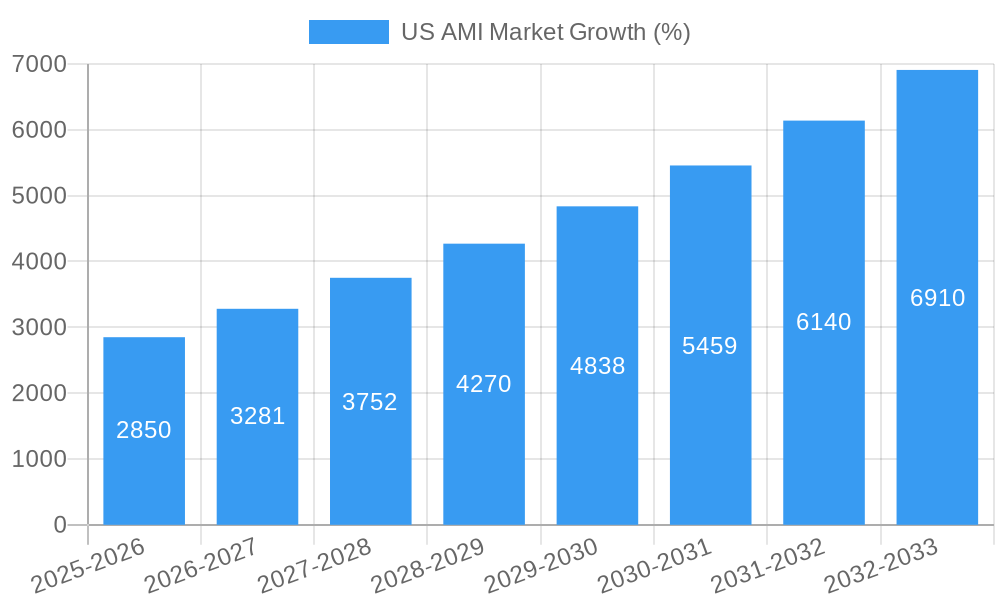
The forecast period (2025-2033) anticipates continued expansion of the US AMI market. Given the 11.60% CAGR from 2019-2024, and considering the sustained government support for grid modernization and the increasing focus on renewable energy integration, a conservative estimate suggests that this growth rate will remain relatively consistent throughout the forecast period. This projection takes into account potential market saturation in certain segments and the ongoing technological advancements within the industry. The continued adoption of smart grid technologies, alongside increasing pressure to reduce carbon emissions and enhance energy efficiency, will continue to drive demand for AMI solutions. The competitive landscape remains dynamic, with established players and emerging companies vying for market share through product innovation, strategic acquisitions, and service expansion.
US AMI Market: A Comprehensive Market Report (2019-2033)
This detailed report provides a comprehensive analysis of the US Advanced Metering Infrastructure (AMI) market, encompassing historical data (2019-2024), current estimates (2025), and future projections (2025-2033). The report offers actionable insights for industry stakeholders, investors, and businesses seeking to understand and navigate this dynamic market. The study period covers 2019-2033, with 2025 serving as both the base and estimated year.
US AMI Market Concentration & Innovation
The US AMI market exhibits a moderately concentrated landscape, with several major players vying for market share. While precise market share figures for each company fluctuate year to year, Itron Inc, Aclara Technologies LLC, Honeywell International Inc, and General Electric consistently hold significant positions. The market is characterized by intense competition, driving innovation in areas such as communication technologies (e.g., cellular, RF), data analytics capabilities, and cybersecurity measures.
The regulatory landscape, particularly at the state level, significantly influences market adoption. Incentives and mandates for smart meter deployment vary across regions, impacting overall market growth. Product substitution is limited, with the primary alternative being traditional manual meter reading, which is becoming increasingly obsolete due to the numerous advantages offered by AMI solutions. End-user trends show a strong preference for improved energy efficiency and cost management, creating strong demand for AMI systems offering enhanced data visibility and control. Mergers and acquisitions (M&A) activity within the sector has been moderate, with deal values typically ranging from xx Million to xx Million, reflecting strategic consolidations and expansion efforts by established companies. However, this number fluctuates and can rise depending on overall market confidence.
US AMI Market Industry Trends & Insights
The US AMI market is experiencing robust growth, driven by several key factors. Increasing government regulations promoting energy efficiency and grid modernization are significant catalysts. The rising adoption of smart grid technologies and the need for improved energy management in both residential and commercial sectors fuel market expansion. Technological advancements, such as the integration of advanced metering infrastructure with artificial intelligence (AI) and the Internet of Things (IoT), further enhance capabilities and broaden application areas. Consumer preferences for real-time energy consumption data and improved billing accuracy are boosting demand. The market's competitive dynamics are characterized by innovation, strategic partnerships, and ongoing efforts to improve cost-effectiveness and system reliability. The Compound Annual Growth Rate (CAGR) for the US AMI market during the forecast period (2025-2033) is projected at xx%, reflecting the sustained growth trajectory of this sector, which can be attributed to the continued rise of the population and the adoption of smart grid technologies. Market penetration in residential and commercial segments is increasing steadily.
Dominant Markets & Segments in US AMI Market
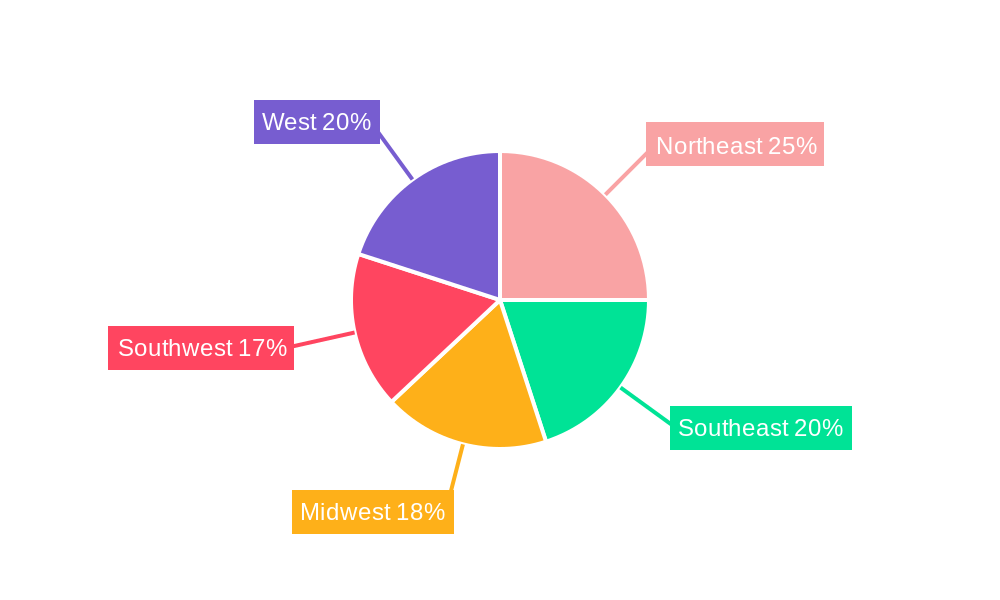
Leading Region/Segment: The report identifies the xx region as the dominant market, driven by strong government support for AMI deployments and a high concentration of energy-intensive industries. The Smart Metering Devices segment (electricity, water, and gas) constitutes the largest portion of the market, with electricity meters currently leading in terms of deployment.
Key Drivers:
- Economic Policies: Government incentives and mandates for energy efficiency improvements are primary drivers.
- Infrastructure Development: Investments in grid modernization and smart grid initiatives significantly influence AMI adoption.
- Technological Advancements: Continued innovation in communication protocols, data analytics, and cybersecurity enhances the functionality and appeal of AMI systems.
- Regulatory Frameworks: The regulatory environment significantly influences adoption rates; states with favorable regulations experience faster growth.
Dominance Analysis: The dominance of specific segments is analyzed based on factors such as installation base, market size, and projected growth rates. The report thoroughly examines the competitive landscape within each segment, identifying leading players, their market share, and their respective competitive strategies.
US AMI Market Product Developments
Recent years have witnessed significant advancements in AMI technologies, including the development of more sophisticated communication protocols, enhanced data analytics capabilities, and improved integration with other smart grid technologies. These innovations enhance the efficiency, accuracy, and reliability of AMI systems, enabling utilities to optimize their operations and reduce costs. The market increasingly favors solutions with enhanced cybersecurity features and compatibility with future-proof technologies. This trend reflects the growing emphasis on data security and the need for long-term system sustainability.
Report Scope & Segmentation Analysis
This report segments the US AMI market based on several key parameters:
Type: Smart Metering Devices (Electricity, Water, and Gas) – This segment is further divided by meter type and communication technology, with associated growth projections and market size estimates. Competitive dynamics are explored for each sub-segment.
Solution: This segment covers end-to-end solutions encompassing hardware, software, and services. Market size and growth potential are analyzed for different types of solutions.
Software: Meter Data Management (MDM), Meter Data Analytics, and Other Software Types – Each software category has its own growth forecasts, competitive landscape, and market size estimations.
Services: Professional services (program management, deployment, and consulting), and Managed services – This segment analyzes the growth of different service offerings and associated market size.
End-user: Residential, Commercial, and Industrial – Market size, growth projections, and competitive dynamics are analyzed for each customer segment.
Key Drivers of US AMI Market Growth
The US AMI market is propelled by several key factors: The increasing need for improved energy efficiency and grid modernization is a significant driver. Government regulations and incentives play a crucial role in promoting AMI adoption. Technological advancements, such as the integration of AI and IoT, continue to enhance system capabilities and expand application areas. The growing preference for real-time energy data among consumers and businesses fuels demand for sophisticated AMI systems.
Challenges in the US AMI Market Sector
The US AMI market faces several challenges: High upfront investment costs associated with AMI deployments can present a barrier for some utilities. Cybersecurity concerns and data privacy issues require ongoing attention and robust mitigation strategies. Supply chain disruptions and component shortages can impact project timelines and overall market growth. Competition among AMI vendors can lead to price pressures and the need for continuous innovation to maintain a competitive edge. Inconsistent regulatory frameworks across different states create complexities for nationwide AMI deployment. The estimated impact of these challenges on market growth is xx% over the next decade.
Emerging Opportunities in US AMI Market
Significant opportunities exist in the US AMI market: The expanding adoption of smart grid technologies creates ample opportunities for AMI providers. The integration of AMI with renewable energy resources creates new market segments and applications. Advanced data analytics capabilities enable new revenue streams through the provision of energy management services. The development of more resilient and secure AMI systems offers lucrative opportunities for innovative technology providers. The growing awareness of environmental sustainability drives further adoption of AMI for improved energy efficiency.
Leading Players in the US AMI Market Market
- Itron Inc
- Aclara Technologies LLC
- Honeywell International Inc
- General Electric
- IBM Corporation
- Oncor Electric Delivery Company LLC
- NuriFlex Inc
- Cisco Systems Inc
- Mueller Systems LLC
- Eaton Corporation
Key Developments in US AMI Market Industry
April 2022: Otter Tail Power Company selected TRC Companies as a systems integrator for its AMI program, impacting system integration and collaboration among vendors.
April 2021: Austin Utilities implemented Aclara Technologies' end-to-end AMI solution, replacing its manual meter reading system and impacting the adoption of RF network technology.
March 2021: Calaveras County Water District partnered with Mueller Systems to deploy an AMI network, significantly expanding AMI coverage in the region.
Strategic Outlook for US AMI Market Market
The US AMI market holds substantial future potential, driven by ongoing technological advancements, increasing government support for grid modernization, and growing consumer demand for advanced energy management tools. The market is expected to experience continued growth, creating opportunities for established players and new entrants alike. Strategic partnerships and innovations in data analytics and cybersecurity will be crucial factors shaping the market's evolution. The market's sustained growth is predicated on the continuing evolution of smart grid technology and the increasing integration of smart meters with other smart devices within the home and enterprise.
US AMI Market Segmentation
-
1. Type
- 1.1. Smart Me
-
1.2. Solution
- 1.2.1. Meter Communication Infrastructure (Solution)
-
1.2.2. Software
- 1.2.2.1. Meter Data Management
- 1.2.2.2. Meter Data Analytics
- 1.2.2.3. Other Software Types
- 1.3. Services
-
2. End-user
- 2.1. Residential
- 2.2. Commercial
- 2.3. Industrial
US AMI Market Segmentation By Geography
-
1. North America
- 1.1. United States
- 1.2. Canada
- 1.3. Mexico
-
2. South America
- 2.1. Brazil
- 2.2. Argentina
- 2.3. Rest of South America
-
3. Europe
- 3.1. United Kingdom
- 3.2. Germany
- 3.3. France
- 3.4. Italy
- 3.5. Spain
- 3.6. Russia
- 3.7. Benelux
- 3.8. Nordics
- 3.9. Rest of Europe
-
4. Middle East & Africa
- 4.1. Turkey
- 4.2. Israel
- 4.3. GCC
- 4.4. North Africa
- 4.5. South Africa
- 4.6. Rest of Middle East & Africa
-
5. Asia Pacific
- 5.1. China
- 5.2. India
- 5.3. Japan
- 5.4. South Korea
- 5.5. ASEAN
- 5.6. Oceania
- 5.7. Rest of Asia Pacific
US AMI Market REPORT HIGHLIGHTS
| Aspects | Details |
|---|---|
| Study Period | 2019-2033 |
| Base Year | 2024 |
| Estimated Year | 2025 |
| Forecast Period | 2025-2033 |
| Historical Period | 2019-2024 |
| Growth Rate | CAGR of 11.60% from 2019-2033 |
| Segmentation |
|
Table of Contents
- 1. Introduction
- 1.1. Research Scope
- 1.2. Market Segmentation
- 1.3. Research Methodology
- 1.4. Definitions and Assumptions
- 2. Executive Summary
- 2.1. Introduction
- 3. Market Dynamics
- 3.1. Introduction
- 3.2. Market Drivers
- 3.2.1. Shift Toward Energy Efficient Alternatives; Favorable Governmental Initiatives Driving Adoption Initiatives
- 3.3. Market Restrains
- 3.3.1. Data Pricacy Concerns
- 3.4. Market Trends
- 3.4.1. Smart Metering Devices will Command a Significant Market Share
- 4. Market Factor Analysis
- 4.1. Porters Five Forces
- 4.2. Supply/Value Chain
- 4.3. PESTEL analysis
- 4.4. Market Entropy
- 4.5. Patent/Trademark Analysis
- 5. Global US AMI Market Analysis, Insights and Forecast, 2019-2031
- 5.1. Market Analysis, Insights and Forecast - by Type
- 5.1.1. Smart Me
- 5.1.2. Solution
- 5.1.2.1. Meter Communication Infrastructure (Solution)
- 5.1.2.2. Software
- 5.1.2.2.1. Meter Data Management
- 5.1.2.2.2. Meter Data Analytics
- 5.1.2.2.3. Other Software Types
- 5.1.3. Services
- 5.2. Market Analysis, Insights and Forecast - by End-user
- 5.2.1. Residential
- 5.2.2. Commercial
- 5.2.3. Industrial
- 5.3. Market Analysis, Insights and Forecast - by Region
- 5.3.1. North America
- 5.3.2. South America
- 5.3.3. Europe
- 5.3.4. Middle East & Africa
- 5.3.5. Asia Pacific
- 5.1. Market Analysis, Insights and Forecast - by Type
- 6. North America US AMI Market Analysis, Insights and Forecast, 2019-2031
- 6.1. Market Analysis, Insights and Forecast - by Type
- 6.1.1. Smart Me
- 6.1.2. Solution
- 6.1.2.1. Meter Communication Infrastructure (Solution)
- 6.1.2.2. Software
- 6.1.2.2.1. Meter Data Management
- 6.1.2.2.2. Meter Data Analytics
- 6.1.2.2.3. Other Software Types
- 6.1.3. Services
- 6.2. Market Analysis, Insights and Forecast - by End-user
- 6.2.1. Residential
- 6.2.2. Commercial
- 6.2.3. Industrial
- 6.1. Market Analysis, Insights and Forecast - by Type
- 7. South America US AMI Market Analysis, Insights and Forecast, 2019-2031
- 7.1. Market Analysis, Insights and Forecast - by Type
- 7.1.1. Smart Me
- 7.1.2. Solution
- 7.1.2.1. Meter Communication Infrastructure (Solution)
- 7.1.2.2. Software
- 7.1.2.2.1. Meter Data Management
- 7.1.2.2.2. Meter Data Analytics
- 7.1.2.2.3. Other Software Types
- 7.1.3. Services
- 7.2. Market Analysis, Insights and Forecast - by End-user
- 7.2.1. Residential
- 7.2.2. Commercial
- 7.2.3. Industrial
- 7.1. Market Analysis, Insights and Forecast - by Type
- 8. Europe US AMI Market Analysis, Insights and Forecast, 2019-2031
- 8.1. Market Analysis, Insights and Forecast - by Type
- 8.1.1. Smart Me
- 8.1.2. Solution
- 8.1.2.1. Meter Communication Infrastructure (Solution)
- 8.1.2.2. Software
- 8.1.2.2.1. Meter Data Management
- 8.1.2.2.2. Meter Data Analytics
- 8.1.2.2.3. Other Software Types
- 8.1.3. Services
- 8.2. Market Analysis, Insights and Forecast - by End-user
- 8.2.1. Residential
- 8.2.2. Commercial
- 8.2.3. Industrial
- 8.1. Market Analysis, Insights and Forecast - by Type
- 9. Middle East & Africa US AMI Market Analysis, Insights and Forecast, 2019-2031
- 9.1. Market Analysis, Insights and Forecast - by Type
- 9.1.1. Smart Me
- 9.1.2. Solution
- 9.1.2.1. Meter Communication Infrastructure (Solution)
- 9.1.2.2. Software
- 9.1.2.2.1. Meter Data Management
- 9.1.2.2.2. Meter Data Analytics
- 9.1.2.2.3. Other Software Types
- 9.1.3. Services
- 9.2. Market Analysis, Insights and Forecast - by End-user
- 9.2.1. Residential
- 9.2.2. Commercial
- 9.2.3. Industrial
- 9.1. Market Analysis, Insights and Forecast - by Type
- 10. Asia Pacific US AMI Market Analysis, Insights and Forecast, 2019-2031
- 10.1. Market Analysis, Insights and Forecast - by Type
- 10.1.1. Smart Me
- 10.1.2. Solution
- 10.1.2.1. Meter Communication Infrastructure (Solution)
- 10.1.2.2. Software
- 10.1.2.2.1. Meter Data Management
- 10.1.2.2.2. Meter Data Analytics
- 10.1.2.2.3. Other Software Types
- 10.1.3. Services
- 10.2. Market Analysis, Insights and Forecast - by End-user
- 10.2.1. Residential
- 10.2.2. Commercial
- 10.2.3. Industrial
- 10.1. Market Analysis, Insights and Forecast - by Type
- 11. Northeast US AMI Market Analysis, Insights and Forecast, 2019-2031
- 12. Southeast US AMI Market Analysis, Insights and Forecast, 2019-2031
- 13. Midwest US AMI Market Analysis, Insights and Forecast, 2019-2031
- 14. Southwest US AMI Market Analysis, Insights and Forecast, 2019-2031
- 15. West US AMI Market Analysis, Insights and Forecast, 2019-2031
- 16. Competitive Analysis
- 16.1. Global Market Share Analysis 2024
- 16.2. Company Profiles
- 16.2.1 Itron Inc
- 16.2.1.1. Overview
- 16.2.1.2. Products
- 16.2.1.3. SWOT Analysis
- 16.2.1.4. Recent Developments
- 16.2.1.5. Financials (Based on Availability)
- 16.2.2 Aclara Technologies LLC*List Not Exhaustive
- 16.2.2.1. Overview
- 16.2.2.2. Products
- 16.2.2.3. SWOT Analysis
- 16.2.2.4. Recent Developments
- 16.2.2.5. Financials (Based on Availability)
- 16.2.3 Honeywell International Inc
- 16.2.3.1. Overview
- 16.2.3.2. Products
- 16.2.3.3. SWOT Analysis
- 16.2.3.4. Recent Developments
- 16.2.3.5. Financials (Based on Availability)
- 16.2.4 General Electric
- 16.2.4.1. Overview
- 16.2.4.2. Products
- 16.2.4.3. SWOT Analysis
- 16.2.4.4. Recent Developments
- 16.2.4.5. Financials (Based on Availability)
- 16.2.5 IBM Corporation
- 16.2.5.1. Overview
- 16.2.5.2. Products
- 16.2.5.3. SWOT Analysis
- 16.2.5.4. Recent Developments
- 16.2.5.5. Financials (Based on Availability)
- 16.2.6 Oncor Electric Delivery Company LLC
- 16.2.6.1. Overview
- 16.2.6.2. Products
- 16.2.6.3. SWOT Analysis
- 16.2.6.4. Recent Developments
- 16.2.6.5. Financials (Based on Availability)
- 16.2.7 NuriFlex Inc
- 16.2.7.1. Overview
- 16.2.7.2. Products
- 16.2.7.3. SWOT Analysis
- 16.2.7.4. Recent Developments
- 16.2.7.5. Financials (Based on Availability)
- 16.2.8 Cisco Systems Inc
- 16.2.8.1. Overview
- 16.2.8.2. Products
- 16.2.8.3. SWOT Analysis
- 16.2.8.4. Recent Developments
- 16.2.8.5. Financials (Based on Availability)
- 16.2.9 Mueller Systems LLC
- 16.2.9.1. Overview
- 16.2.9.2. Products
- 16.2.9.3. SWOT Analysis
- 16.2.9.4. Recent Developments
- 16.2.9.5. Financials (Based on Availability)
- 16.2.10 Eaton Corporation
- 16.2.10.1. Overview
- 16.2.10.2. Products
- 16.2.10.3. SWOT Analysis
- 16.2.10.4. Recent Developments
- 16.2.10.5. Financials (Based on Availability)
- 16.2.1 Itron Inc
List of Figures
- Figure 1: Global US AMI Market Revenue Breakdown (Million, %) by Region 2024 & 2032
- Figure 2: United states US AMI Market Revenue (Million), by Country 2024 & 2032
- Figure 3: United states US AMI Market Revenue Share (%), by Country 2024 & 2032
- Figure 4: North America US AMI Market Revenue (Million), by Type 2024 & 2032
- Figure 5: North America US AMI Market Revenue Share (%), by Type 2024 & 2032
- Figure 6: North America US AMI Market Revenue (Million), by End-user 2024 & 2032
- Figure 7: North America US AMI Market Revenue Share (%), by End-user 2024 & 2032
- Figure 8: North America US AMI Market Revenue (Million), by Country 2024 & 2032
- Figure 9: North America US AMI Market Revenue Share (%), by Country 2024 & 2032
- Figure 10: South America US AMI Market Revenue (Million), by Type 2024 & 2032
- Figure 11: South America US AMI Market Revenue Share (%), by Type 2024 & 2032
- Figure 12: South America US AMI Market Revenue (Million), by End-user 2024 & 2032
- Figure 13: South America US AMI Market Revenue Share (%), by End-user 2024 & 2032
- Figure 14: South America US AMI Market Revenue (Million), by Country 2024 & 2032
- Figure 15: South America US AMI Market Revenue Share (%), by Country 2024 & 2032
- Figure 16: Europe US AMI Market Revenue (Million), by Type 2024 & 2032
- Figure 17: Europe US AMI Market Revenue Share (%), by Type 2024 & 2032
- Figure 18: Europe US AMI Market Revenue (Million), by End-user 2024 & 2032
- Figure 19: Europe US AMI Market Revenue Share (%), by End-user 2024 & 2032
- Figure 20: Europe US AMI Market Revenue (Million), by Country 2024 & 2032
- Figure 21: Europe US AMI Market Revenue Share (%), by Country 2024 & 2032
- Figure 22: Middle East & Africa US AMI Market Revenue (Million), by Type 2024 & 2032
- Figure 23: Middle East & Africa US AMI Market Revenue Share (%), by Type 2024 & 2032
- Figure 24: Middle East & Africa US AMI Market Revenue (Million), by End-user 2024 & 2032
- Figure 25: Middle East & Africa US AMI Market Revenue Share (%), by End-user 2024 & 2032
- Figure 26: Middle East & Africa US AMI Market Revenue (Million), by Country 2024 & 2032
- Figure 27: Middle East & Africa US AMI Market Revenue Share (%), by Country 2024 & 2032
- Figure 28: Asia Pacific US AMI Market Revenue (Million), by Type 2024 & 2032
- Figure 29: Asia Pacific US AMI Market Revenue Share (%), by Type 2024 & 2032
- Figure 30: Asia Pacific US AMI Market Revenue (Million), by End-user 2024 & 2032
- Figure 31: Asia Pacific US AMI Market Revenue Share (%), by End-user 2024 & 2032
- Figure 32: Asia Pacific US AMI Market Revenue (Million), by Country 2024 & 2032
- Figure 33: Asia Pacific US AMI Market Revenue Share (%), by Country 2024 & 2032
List of Tables
- Table 1: Global US AMI Market Revenue Million Forecast, by Region 2019 & 2032
- Table 2: Global US AMI Market Revenue Million Forecast, by Type 2019 & 2032
- Table 3: Global US AMI Market Revenue Million Forecast, by End-user 2019 & 2032
- Table 4: Global US AMI Market Revenue Million Forecast, by Region 2019 & 2032
- Table 5: Global US AMI Market Revenue Million Forecast, by Country 2019 & 2032
- Table 6: Northeast US AMI Market Revenue (Million) Forecast, by Application 2019 & 2032
- Table 7: Southeast US AMI Market Revenue (Million) Forecast, by Application 2019 & 2032
- Table 8: Midwest US AMI Market Revenue (Million) Forecast, by Application 2019 & 2032
- Table 9: Southwest US AMI Market Revenue (Million) Forecast, by Application 2019 & 2032
- Table 10: West US AMI Market Revenue (Million) Forecast, by Application 2019 & 2032
- Table 11: Global US AMI Market Revenue Million Forecast, by Type 2019 & 2032
- Table 12: Global US AMI Market Revenue Million Forecast, by End-user 2019 & 2032
- Table 13: Global US AMI Market Revenue Million Forecast, by Country 2019 & 2032
- Table 14: United States US AMI Market Revenue (Million) Forecast, by Application 2019 & 2032
- Table 15: Canada US AMI Market Revenue (Million) Forecast, by Application 2019 & 2032
- Table 16: Mexico US AMI Market Revenue (Million) Forecast, by Application 2019 & 2032
- Table 17: Global US AMI Market Revenue Million Forecast, by Type 2019 & 2032
- Table 18: Global US AMI Market Revenue Million Forecast, by End-user 2019 & 2032
- Table 19: Global US AMI Market Revenue Million Forecast, by Country 2019 & 2032
- Table 20: Brazil US AMI Market Revenue (Million) Forecast, by Application 2019 & 2032
- Table 21: Argentina US AMI Market Revenue (Million) Forecast, by Application 2019 & 2032
- Table 22: Rest of South America US AMI Market Revenue (Million) Forecast, by Application 2019 & 2032
- Table 23: Global US AMI Market Revenue Million Forecast, by Type 2019 & 2032
- Table 24: Global US AMI Market Revenue Million Forecast, by End-user 2019 & 2032
- Table 25: Global US AMI Market Revenue Million Forecast, by Country 2019 & 2032
- Table 26: United Kingdom US AMI Market Revenue (Million) Forecast, by Application 2019 & 2032
- Table 27: Germany US AMI Market Revenue (Million) Forecast, by Application 2019 & 2032
- Table 28: France US AMI Market Revenue (Million) Forecast, by Application 2019 & 2032
- Table 29: Italy US AMI Market Revenue (Million) Forecast, by Application 2019 & 2032
- Table 30: Spain US AMI Market Revenue (Million) Forecast, by Application 2019 & 2032
- Table 31: Russia US AMI Market Revenue (Million) Forecast, by Application 2019 & 2032
- Table 32: Benelux US AMI Market Revenue (Million) Forecast, by Application 2019 & 2032
- Table 33: Nordics US AMI Market Revenue (Million) Forecast, by Application 2019 & 2032
- Table 34: Rest of Europe US AMI Market Revenue (Million) Forecast, by Application 2019 & 2032
- Table 35: Global US AMI Market Revenue Million Forecast, by Type 2019 & 2032
- Table 36: Global US AMI Market Revenue Million Forecast, by End-user 2019 & 2032
- Table 37: Global US AMI Market Revenue Million Forecast, by Country 2019 & 2032
- Table 38: Turkey US AMI Market Revenue (Million) Forecast, by Application 2019 & 2032
- Table 39: Israel US AMI Market Revenue (Million) Forecast, by Application 2019 & 2032
- Table 40: GCC US AMI Market Revenue (Million) Forecast, by Application 2019 & 2032
- Table 41: North Africa US AMI Market Revenue (Million) Forecast, by Application 2019 & 2032
- Table 42: South Africa US AMI Market Revenue (Million) Forecast, by Application 2019 & 2032
- Table 43: Rest of Middle East & Africa US AMI Market Revenue (Million) Forecast, by Application 2019 & 2032
- Table 44: Global US AMI Market Revenue Million Forecast, by Type 2019 & 2032
- Table 45: Global US AMI Market Revenue Million Forecast, by End-user 2019 & 2032
- Table 46: Global US AMI Market Revenue Million Forecast, by Country 2019 & 2032
- Table 47: China US AMI Market Revenue (Million) Forecast, by Application 2019 & 2032
- Table 48: India US AMI Market Revenue (Million) Forecast, by Application 2019 & 2032
- Table 49: Japan US AMI Market Revenue (Million) Forecast, by Application 2019 & 2032
- Table 50: South Korea US AMI Market Revenue (Million) Forecast, by Application 2019 & 2032
- Table 51: ASEAN US AMI Market Revenue (Million) Forecast, by Application 2019 & 2032
- Table 52: Oceania US AMI Market Revenue (Million) Forecast, by Application 2019 & 2032
- Table 53: Rest of Asia Pacific US AMI Market Revenue (Million) Forecast, by Application 2019 & 2032
Frequently Asked Questions
1. What is the projected Compound Annual Growth Rate (CAGR) of the US AMI Market?
The projected CAGR is approximately 11.60%.
2. Which companies are prominent players in the US AMI Market?
Key companies in the market include Itron Inc, Aclara Technologies LLC*List Not Exhaustive, Honeywell International Inc, General Electric, IBM Corporation, Oncor Electric Delivery Company LLC, NuriFlex Inc, Cisco Systems Inc, Mueller Systems LLC, Eaton Corporation.
3. What are the main segments of the US AMI Market?
The market segments include Type, End-user.
4. Can you provide details about the market size?
The market size is estimated to be USD XX Million as of 2022.
5. What are some drivers contributing to market growth?
Shift Toward Energy Efficient Alternatives; Favorable Governmental Initiatives Driving Adoption Initiatives.
6. What are the notable trends driving market growth?
Smart Metering Devices will Command a Significant Market Share.
7. Are there any restraints impacting market growth?
Data Pricacy Concerns.
8. Can you provide examples of recent developments in the market?
April 2022 - Otter Tail Power Company chose TRC Companies (TRC) to serve as a systems integrator for their advanced metering infrastructure (AMI) program. The project serves a large area in northwestern Minnesota, eastern North Dakota, and northeastern South Dakota. TRC will assist program management with system integration while collaborating with software and hardware providers across Otter Tail Power's AMI, meter data management (MDM), and customer information systems.
9. What pricing options are available for accessing the report?
Pricing options include single-user, multi-user, and enterprise licenses priced at USD 3800, USD 4500, and USD 5800 respectively.
10. Is the market size provided in terms of value or volume?
The market size is provided in terms of value, measured in Million.
11. Are there any specific market keywords associated with the report?
Yes, the market keyword associated with the report is "US AMI Market," which aids in identifying and referencing the specific market segment covered.
12. How do I determine which pricing option suits my needs best?
The pricing options vary based on user requirements and access needs. Individual users may opt for single-user licenses, while businesses requiring broader access may choose multi-user or enterprise licenses for cost-effective access to the report.
13. Are there any additional resources or data provided in the US AMI Market report?
While the report offers comprehensive insights, it's advisable to review the specific contents or supplementary materials provided to ascertain if additional resources or data are available.
14. How can I stay updated on further developments or reports in the US AMI Market?
To stay informed about further developments, trends, and reports in the US AMI Market, consider subscribing to industry newsletters, following relevant companies and organizations, or regularly checking reputable industry news sources and publications.
Methodology
Step 1 - Identification of Relevant Samples Size from Population Database


Step 2 - Approaches for Defining Global Market Size (Value, Volume* & Price*)

Note*: In applicable scenarios
Step 3 - Data Sources
Primary Research
- Web Analytics
- Survey Reports
- Research Institute
- Latest Research Reports
- Opinion Leaders
Secondary Research
- Annual Reports
- White Paper
- Latest Press Release
- Industry Association
- Paid Database
- Investor Presentations

Step 4 - Data Triangulation
Involves using different sources of information in order to increase the validity of a study
These sources are likely to be stakeholders in a program - participants, other researchers, program staff, other community members, and so on.
Then we put all data in single framework & apply various statistical tools to find out the dynamic on the market.
During the analysis stage, feedback from the stakeholder groups would be compared to determine areas of agreement as well as areas of divergence


