
Key Insights
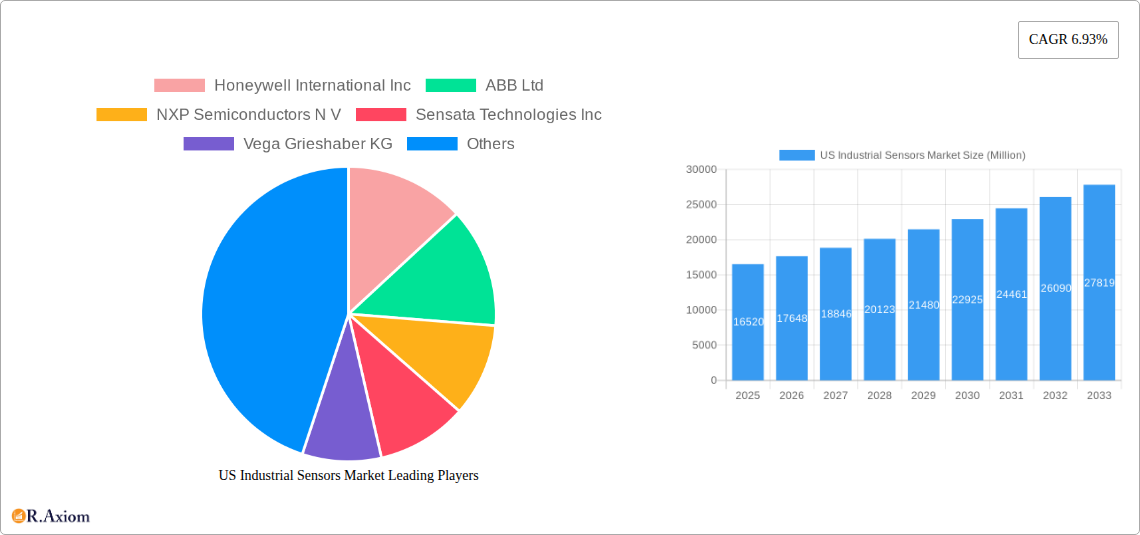
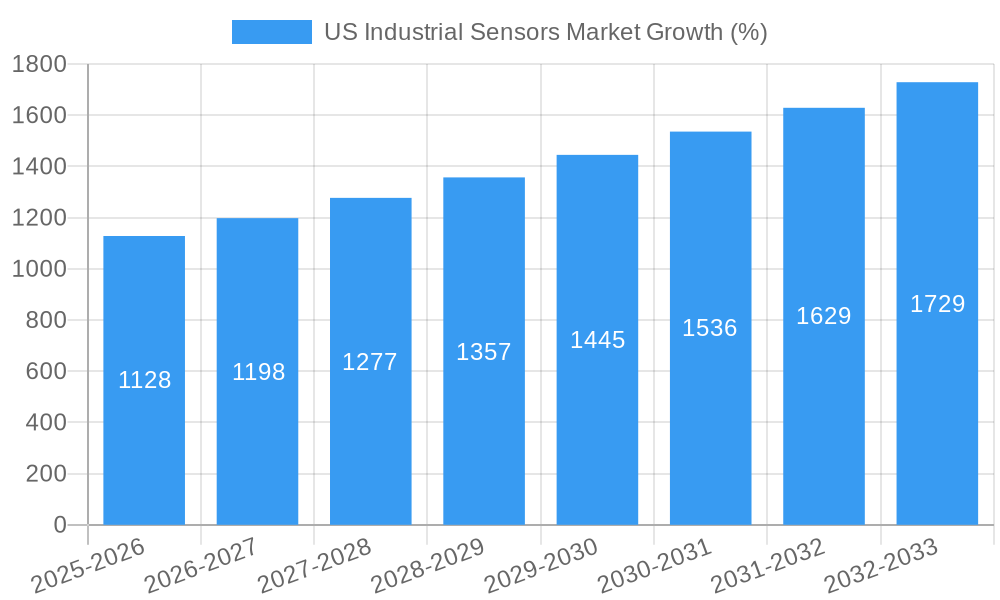
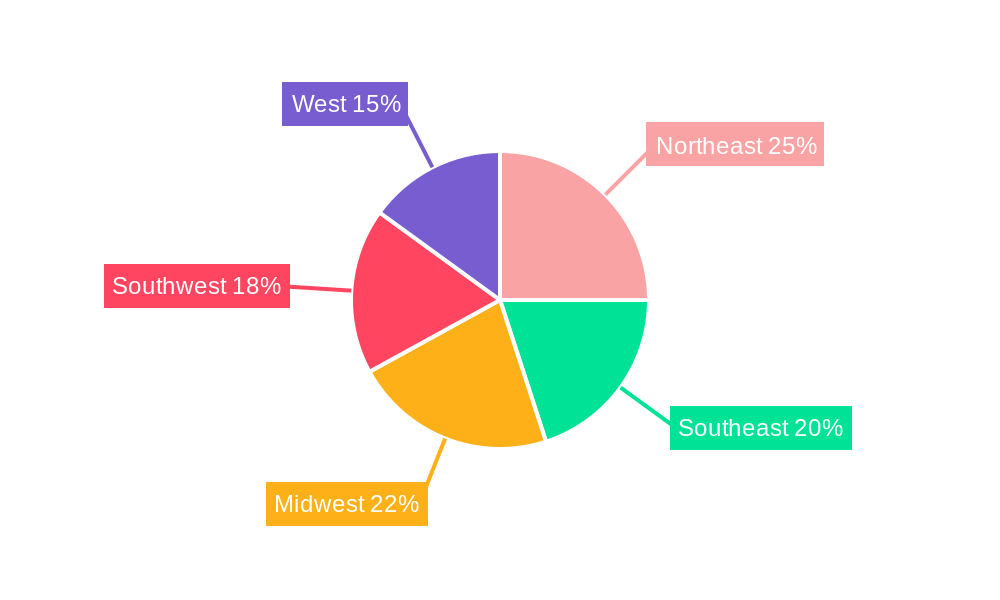
The US industrial sensors market, valued at $16.52 billion in 2025, is projected to experience robust growth, driven by the increasing automation and digitalization across various industrial sectors. The compound annual growth rate (CAGR) of 6.93% from 2025 to 2033 indicates a significant expansion in market size. Key growth drivers include the rising adoption of Industry 4.0 technologies, the need for enhanced process optimization and predictive maintenance, and the growing demand for smart manufacturing solutions. The market is segmented by connectivity (wired and wireless), sensor type (flow, temperature, level, pressure, gas, and others), and end-user industry (likely encompassing manufacturing, automotive, energy, and others). The prevalence of wired solutions is expected to gradually decrease as wireless technologies offer greater flexibility and reduced installation complexity. Within sensor types, the demand for advanced sensors capable of providing real-time data analysis, such as those used for predictive maintenance, is likely to see the highest growth. Geographic segmentation shows strong market presence across all US regions (Northeast, Southeast, Midwest, Southwest, and West), with potential variations in growth rates based on industrial concentration and infrastructure development within each region. Competitive intensity is high, with major players like Honeywell, ABB, and Siemens actively participating in technological advancements and market expansion. Challenges may include the initial investment costs associated with sensor integration and the need for skilled workforce to manage and interpret the resulting data.
The forecast period (2025-2033) promises continuous growth, fueled by ongoing technological advancements in sensor technologies, miniaturization, increased sensor accuracy and improved data analytics capabilities. This will allow for greater integration into existing systems and enable the development of more sophisticated industrial automation solutions. The competitive landscape will likely see strategic partnerships and acquisitions, as companies strive to enhance their product portfolio and expand their market reach. Government initiatives promoting industrial automation and digitalization will further stimulate market growth. The long-term outlook for the US industrial sensors market remains positive, with significant opportunities for both established players and new entrants who can effectively address the evolving needs of the industrial sector.
US Industrial Sensors Market: A Comprehensive Report (2019-2033)
This in-depth report provides a comprehensive analysis of the US Industrial Sensors Market, offering invaluable insights for stakeholders across the value chain. The study period spans from 2019 to 2033, with 2025 serving as the base and estimated year. The report meticulously examines market trends, segment performance, competitive dynamics, and future growth potential. Key players like Honeywell International Inc, ABB Ltd, and others are profiled, highlighting their strategies and market positions. The report utilizes rigorous data analysis to provide accurate market sizing, growth projections, and actionable recommendations. This analysis will equip businesses with the necessary intelligence to make informed strategic decisions and capitalize on emerging opportunities within this dynamic market.
US Industrial Sensors Market Market Concentration & Innovation
The US industrial sensors market exhibits a moderately consolidated structure, with a few major players holding significant market share. Honeywell International Inc., ABB Ltd., and Emerson Electric Co. are among the leading companies, collectively commanding approximately xx% of the market in 2024. However, a number of smaller, specialized players also contribute significantly, particularly in niche sensor technologies. Market concentration is influenced by factors such as economies of scale in manufacturing, established distribution networks, and strong brand recognition.
Innovation is a crucial driver in this sector, fueled by the rising demand for advanced sensor technologies across various industrial applications. Key innovations include the integration of artificial intelligence (AI), improved sensor accuracy and miniaturization, wireless connectivity enhancements, and the development of new sensor types tailored to specific industrial needs.
Regulatory frameworks, such as those related to safety, environmental compliance, and data privacy, significantly impact market dynamics. These regulations necessitate the development and adoption of compliant sensor solutions, which influences the innovation landscape and market entry strategies for companies. The presence of substitute technologies, like alternative measurement techniques, poses a competitive challenge, but also pushes for continuous innovation in sensor performance and cost-effectiveness. Furthermore, end-user trends, such as automation and digitalization across industries, are significant drivers of innovation, as these trends require advanced sensor solutions for data acquisition and process optimization.
Mergers and acquisitions (M&A) activity is another notable aspect of market consolidation and innovation. Recent M&A deals, while not publicly disclosed to the extent of providing exact values, have primarily focused on acquiring specialized sensor technologies or expanding geographic reach. These deals often serve as catalysts for technological integration and market expansion.
US Industrial Sensors Market Industry Trends & Insights
The US industrial sensors market is experiencing robust growth, driven by the increasing adoption of automation and digitization across various industries. The market is projected to exhibit a CAGR of xx% during the forecast period (2025-2033). This growth is fueled by several factors, including the rising need for improved process efficiency, enhanced product quality, and proactive maintenance in industrial settings.
Technological advancements, such as the emergence of IoT (Internet of Things) and Industry 4.0, are significantly impacting the market. The integration of sensors with cloud computing and big data analytics facilitates real-time data monitoring and analysis, leading to optimized operational processes and predictive maintenance strategies.
Consumer preferences towards improved safety, reliability, and energy efficiency in industrial applications further fuel demand for high-performance sensors. Competitive dynamics are marked by continuous product development, strategic partnerships, and the entry of new players, especially those specializing in innovative sensor technologies. Market penetration of smart sensors continues to increase, with a predicted penetration rate of xx% by 2033 across key industrial sectors.
Dominant Markets & Segments in US Industrial Sensors Market
Leading Region: The [Midwest/South/West - Insert Predicted Dominant Region] region dominates the US industrial sensors market due to its high concentration of manufacturing and industrial activities. Key drivers include robust industrial infrastructure, supportive government policies, and a large pool of skilled labor.
Dominant Segment (By Connectivity): Wired solutions currently hold the largest market share owing to their reliability and established infrastructure, but wireless solutions are experiencing rapid growth due to their flexibility and cost-effectiveness in specific applications.
Dominant Segment (By Type): Pressure sensors currently dominate the market due to their wide-ranging applications across various industries.
Dominant Segment (By End-user Industry): The [Automotive/Oil and Gas/Manufacturing - Insert Predicted Dominant End-User] sector shows the highest demand for industrial sensors due to its high degree of automation and need for precise process control. This is propelled by ongoing investment in automation and digitization, and robust growth within this sector.
US Industrial Sensors Market Product Developments
Recent product innovations focus on miniaturization, enhanced accuracy, improved reliability, and seamless integration with existing industrial systems. New sensor technologies are being developed to meet the demands of specific applications, such as harsh environments or specialized industrial processes. The incorporation of AI and machine learning capabilities into sensors enables advanced data analysis and predictive maintenance. These advancements provide competitive advantages by improving operational efficiency, enhancing safety, and reducing maintenance costs.
Report Scope & Segmentation Analysis
This report segments the US Industrial Sensors Market by connectivity (wired and wireless solutions), sensor type (flow sensors, temperature sensors, level sensors, pressure sensors, gas sensors, and other sensors), and end-user industry (various industrial sectors). Each segment's market size, growth projections, and competitive landscape are thoroughly analyzed. Wired solutions currently hold a larger market share than wireless solutions, but the latter is expected to demonstrate higher growth in the forecast period. Pressure sensors, due to their wide applicability, constitute the largest segment within sensor types, followed by temperature and level sensors.
Key Drivers of US Industrial Sensors Market Growth
The US industrial sensors market is experiencing significant growth fueled by technological advancements, economic factors, and regulatory pressures. The rise of Industry 4.0 and the Internet of Things (IoT) is driving demand for advanced sensor technologies for automation, data acquisition, and process optimization. Furthermore, economic expansion across key industrial sectors is increasing investment in automation and infrastructure development, positively impacting sensor demand. Regulatory mandates concerning safety, emissions, and industrial efficiency are also driving the adoption of advanced sensing solutions.
Challenges in the US Industrial Sensors Market Sector
The US industrial sensors market faces challenges such as the high initial investment costs for implementing advanced sensor systems. Supply chain disruptions and the volatility of raw material prices can also impact production costs and profitability. Furthermore, intense competition from both established players and new entrants necessitates continuous innovation and cost optimization strategies.
Emerging Opportunities in US Industrial Sensors Market
Emerging opportunities include the expansion into new industrial sectors, such as renewable energy and smart cities, where sensors play a crucial role in monitoring and controlling various systems. The development and adoption of next-generation sensor technologies, such as MEMS and nano-sensors, offer potential for improved performance and reduced costs. Growing consumer demand for enhanced safety and efficiency in industrial applications opens up new avenues for innovative sensor solutions.
Leading Players in the US Industrial Sensors Market Market
- Honeywell International Inc
- ABB Ltd
- NXP Semiconductors N V
- Sensata Technologies Inc
- Vega Grieshaber KG
- Emerson Electric Co
- Siemens AG
- Meggitt Sensing Systems
- Omron Corporation
- Omega Engineering Inc
- Sick AG
- TE Connectivity Ltd
- Infineon Technologies A
- Ams-osram AG
- Texas Instruments Incorporated
- Rockwell Automation Inc
- Yokogawa Electric Corporation
- The Krohne Group
- Analog Devices Inc
- Endress + Hauser AG
- Bosch Sensortec GMBH (Bosch Internationals)
- Stmicroelectronics Inc
Key Developments in US Industrial Sensors Market Industry
September 2023: KROHNE, Inc. showcased its water and wastewater products, including the OPTISONIC 6300 clamp-on ultrasonic flowmeter, at WEFTEC 2023. This highlights the company's focus on expanding its presence in the water management sector.
January 2023: KROHNE, Inc. exhibited products for the food and beverage industry at the Food Processing Expo 2023, showcasing its versatility across different sectors.
January 2023: Bosch Sensortec introduced new sensors at CES 2023, including an AI-enabled sensor and a next-generation magnetometer. The BMP585 barometric pressure sensor's introduction signifies progress in wearable technology and harsh-environment applications.
Strategic Outlook for US Industrial Sensors Market Market
The US industrial sensors market is poised for continued expansion, driven by ongoing technological advancements and increasing demand across various industrial sectors. The integration of AI, IoT, and big data analytics will further enhance sensor capabilities, leading to improved operational efficiency, predictive maintenance, and safety. Emerging applications in areas such as renewable energy, smart cities, and autonomous vehicles are anticipated to create significant growth opportunities in the coming years.
US Industrial Sensors Market Segmentation
-
1. Connectivity
- 1.1. Wired Solutions
- 1.2. Wireless Solutions
-
2. Type
-
2.1. Flow Sensors
- 2.1.1. Market Overview
- 2.1.2. End-user Industry
- 2.2. Temperature Sensors
- 2.3. Level Sensors
- 2.4. Pressure Sensors
- 2.5. Gas Sensors
- 2.6. Other Sensors
-
2.1. Flow Sensors
US Industrial Sensors Market Segmentation By Geography
-
1. North America
- 1.1. United States
- 1.2. Canada
- 1.3. Mexico
-
2. South America
- 2.1. Brazil
- 2.2. Argentina
- 2.3. Rest of South America
-
3. Europe
- 3.1. United Kingdom
- 3.2. Germany
- 3.3. France
- 3.4. Italy
- 3.5. Spain
- 3.6. Russia
- 3.7. Benelux
- 3.8. Nordics
- 3.9. Rest of Europe
-
4. Middle East & Africa
- 4.1. Turkey
- 4.2. Israel
- 4.3. GCC
- 4.4. North Africa
- 4.5. South Africa
- 4.6. Rest of Middle East & Africa
-
5. Asia Pacific
- 5.1. China
- 5.2. India
- 5.3. Japan
- 5.4. South Korea
- 5.5. ASEAN
- 5.6. Oceania
- 5.7. Rest of Asia Pacific
US Industrial Sensors Market REPORT HIGHLIGHTS
| Aspects | Details |
|---|---|
| Study Period | 2019-2033 |
| Base Year | 2024 |
| Estimated Year | 2025 |
| Forecast Period | 2025-2033 |
| Historical Period | 2019-2024 |
| Growth Rate | CAGR of 6.93% from 2019-2033 |
| Segmentation |
|
Table of Contents
- 1. Introduction
- 1.1. Research Scope
- 1.2. Market Segmentation
- 1.3. Research Methodology
- 1.4. Definitions and Assumptions
- 2. Executive Summary
- 2.1. Introduction
- 3. Market Dynamics
- 3.1. Introduction
- 3.2. Market Drivers
- 3.2.1. Growing Adoption of IoT Leading to Demand for Sensing Components; Growing Emphasis on the Use of Predictive Maintenance and Remote Monitoring
- 3.3. Market Restrains
- 3.3.1. High Cost and Operational Concern
- 3.4. Market Trends
- 3.4.1. Growing Adoption of IoT Leading to Demand for Sensing Components Drives the Market
- 4. Market Factor Analysis
- 4.1. Porters Five Forces
- 4.2. Supply/Value Chain
- 4.3. PESTEL analysis
- 4.4. Market Entropy
- 4.5. Patent/Trademark Analysis
- 5. Global US Industrial Sensors Market Analysis, Insights and Forecast, 2019-2031
- 5.1. Market Analysis, Insights and Forecast - by Connectivity
- 5.1.1. Wired Solutions
- 5.1.2. Wireless Solutions
- 5.2. Market Analysis, Insights and Forecast - by Type
- 5.2.1. Flow Sensors
- 5.2.1.1. Market Overview
- 5.2.1.2. End-user Industry
- 5.2.2. Temperature Sensors
- 5.2.3. Level Sensors
- 5.2.4. Pressure Sensors
- 5.2.5. Gas Sensors
- 5.2.6. Other Sensors
- 5.2.1. Flow Sensors
- 5.3. Market Analysis, Insights and Forecast - by Region
- 5.3.1. North America
- 5.3.2. South America
- 5.3.3. Europe
- 5.3.4. Middle East & Africa
- 5.3.5. Asia Pacific
- 5.1. Market Analysis, Insights and Forecast - by Connectivity
- 6. North America US Industrial Sensors Market Analysis, Insights and Forecast, 2019-2031
- 6.1. Market Analysis, Insights and Forecast - by Connectivity
- 6.1.1. Wired Solutions
- 6.1.2. Wireless Solutions
- 6.2. Market Analysis, Insights and Forecast - by Type
- 6.2.1. Flow Sensors
- 6.2.1.1. Market Overview
- 6.2.1.2. End-user Industry
- 6.2.2. Temperature Sensors
- 6.2.3. Level Sensors
- 6.2.4. Pressure Sensors
- 6.2.5. Gas Sensors
- 6.2.6. Other Sensors
- 6.2.1. Flow Sensors
- 6.1. Market Analysis, Insights and Forecast - by Connectivity
- 7. South America US Industrial Sensors Market Analysis, Insights and Forecast, 2019-2031
- 7.1. Market Analysis, Insights and Forecast - by Connectivity
- 7.1.1. Wired Solutions
- 7.1.2. Wireless Solutions
- 7.2. Market Analysis, Insights and Forecast - by Type
- 7.2.1. Flow Sensors
- 7.2.1.1. Market Overview
- 7.2.1.2. End-user Industry
- 7.2.2. Temperature Sensors
- 7.2.3. Level Sensors
- 7.2.4. Pressure Sensors
- 7.2.5. Gas Sensors
- 7.2.6. Other Sensors
- 7.2.1. Flow Sensors
- 7.1. Market Analysis, Insights and Forecast - by Connectivity
- 8. Europe US Industrial Sensors Market Analysis, Insights and Forecast, 2019-2031
- 8.1. Market Analysis, Insights and Forecast - by Connectivity
- 8.1.1. Wired Solutions
- 8.1.2. Wireless Solutions
- 8.2. Market Analysis, Insights and Forecast - by Type
- 8.2.1. Flow Sensors
- 8.2.1.1. Market Overview
- 8.2.1.2. End-user Industry
- 8.2.2. Temperature Sensors
- 8.2.3. Level Sensors
- 8.2.4. Pressure Sensors
- 8.2.5. Gas Sensors
- 8.2.6. Other Sensors
- 8.2.1. Flow Sensors
- 8.1. Market Analysis, Insights and Forecast - by Connectivity
- 9. Middle East & Africa US Industrial Sensors Market Analysis, Insights and Forecast, 2019-2031
- 9.1. Market Analysis, Insights and Forecast - by Connectivity
- 9.1.1. Wired Solutions
- 9.1.2. Wireless Solutions
- 9.2. Market Analysis, Insights and Forecast - by Type
- 9.2.1. Flow Sensors
- 9.2.1.1. Market Overview
- 9.2.1.2. End-user Industry
- 9.2.2. Temperature Sensors
- 9.2.3. Level Sensors
- 9.2.4. Pressure Sensors
- 9.2.5. Gas Sensors
- 9.2.6. Other Sensors
- 9.2.1. Flow Sensors
- 9.1. Market Analysis, Insights and Forecast - by Connectivity
- 10. Asia Pacific US Industrial Sensors Market Analysis, Insights and Forecast, 2019-2031
- 10.1. Market Analysis, Insights and Forecast - by Connectivity
- 10.1.1. Wired Solutions
- 10.1.2. Wireless Solutions
- 10.2. Market Analysis, Insights and Forecast - by Type
- 10.2.1. Flow Sensors
- 10.2.1.1. Market Overview
- 10.2.1.2. End-user Industry
- 10.2.2. Temperature Sensors
- 10.2.3. Level Sensors
- 10.2.4. Pressure Sensors
- 10.2.5. Gas Sensors
- 10.2.6. Other Sensors
- 10.2.1. Flow Sensors
- 10.1. Market Analysis, Insights and Forecast - by Connectivity
- 11. Northeast US Industrial Sensors Market Analysis, Insights and Forecast, 2019-2031
- 12. Southeast US Industrial Sensors Market Analysis, Insights and Forecast, 2019-2031
- 13. Midwest US Industrial Sensors Market Analysis, Insights and Forecast, 2019-2031
- 14. Southwest US Industrial Sensors Market Analysis, Insights and Forecast, 2019-2031
- 15. West US Industrial Sensors Market Analysis, Insights and Forecast, 2019-2031
- 16. Competitive Analysis
- 16.1. Global Market Share Analysis 2024
- 16.2. Company Profiles
- 16.2.1 Honeywell International Inc
- 16.2.1.1. Overview
- 16.2.1.2. Products
- 16.2.1.3. SWOT Analysis
- 16.2.1.4. Recent Developments
- 16.2.1.5. Financials (Based on Availability)
- 16.2.2 ABB Ltd
- 16.2.2.1. Overview
- 16.2.2.2. Products
- 16.2.2.3. SWOT Analysis
- 16.2.2.4. Recent Developments
- 16.2.2.5. Financials (Based on Availability)
- 16.2.3 NXP Semiconductors N V
- 16.2.3.1. Overview
- 16.2.3.2. Products
- 16.2.3.3. SWOT Analysis
- 16.2.3.4. Recent Developments
- 16.2.3.5. Financials (Based on Availability)
- 16.2.4 Sensata Technologies Inc
- 16.2.4.1. Overview
- 16.2.4.2. Products
- 16.2.4.3. SWOT Analysis
- 16.2.4.4. Recent Developments
- 16.2.4.5. Financials (Based on Availability)
- 16.2.5 Vega Grieshaber KG
- 16.2.5.1. Overview
- 16.2.5.2. Products
- 16.2.5.3. SWOT Analysis
- 16.2.5.4. Recent Developments
- 16.2.5.5. Financials (Based on Availability)
- 16.2.6 Emerson Electric Co
- 16.2.6.1. Overview
- 16.2.6.2. Products
- 16.2.6.3. SWOT Analysis
- 16.2.6.4. Recent Developments
- 16.2.6.5. Financials (Based on Availability)
- 16.2.7 Siemens AG
- 16.2.7.1. Overview
- 16.2.7.2. Products
- 16.2.7.3. SWOT Analysis
- 16.2.7.4. Recent Developments
- 16.2.7.5. Financials (Based on Availability)
- 16.2.8 Meggitt Sensing Systems
- 16.2.8.1. Overview
- 16.2.8.2. Products
- 16.2.8.3. SWOT Analysis
- 16.2.8.4. Recent Developments
- 16.2.8.5. Financials (Based on Availability)
- 16.2.9 Omron Corporation
- 16.2.9.1. Overview
- 16.2.9.2. Products
- 16.2.9.3. SWOT Analysis
- 16.2.9.4. Recent Developments
- 16.2.9.5. Financials (Based on Availability)
- 16.2.10 Omega Engineering Inc
- 16.2.10.1. Overview
- 16.2.10.2. Products
- 16.2.10.3. SWOT Analysis
- 16.2.10.4. Recent Developments
- 16.2.10.5. Financials (Based on Availability)
- 16.2.11 Sick AG
- 16.2.11.1. Overview
- 16.2.11.2. Products
- 16.2.11.3. SWOT Analysis
- 16.2.11.4. Recent Developments
- 16.2.11.5. Financials (Based on Availability)
- 16.2.12 TE Connectivity Ltd
- 16.2.12.1. Overview
- 16.2.12.2. Products
- 16.2.12.3. SWOT Analysis
- 16.2.12.4. Recent Developments
- 16.2.12.5. Financials (Based on Availability)
- 16.2.13 Infineon Technologies A
- 16.2.13.1. Overview
- 16.2.13.2. Products
- 16.2.13.3. SWOT Analysis
- 16.2.13.4. Recent Developments
- 16.2.13.5. Financials (Based on Availability)
- 16.2.14 Ams-osram AG
- 16.2.14.1. Overview
- 16.2.14.2. Products
- 16.2.14.3. SWOT Analysis
- 16.2.14.4. Recent Developments
- 16.2.14.5. Financials (Based on Availability)
- 16.2.15 Texas Instruments Incorporated
- 16.2.15.1. Overview
- 16.2.15.2. Products
- 16.2.15.3. SWOT Analysis
- 16.2.15.4. Recent Developments
- 16.2.15.5. Financials (Based on Availability)
- 16.2.16 Rockwell Automation Inc
- 16.2.16.1. Overview
- 16.2.16.2. Products
- 16.2.16.3. SWOT Analysis
- 16.2.16.4. Recent Developments
- 16.2.16.5. Financials (Based on Availability)
- 16.2.17 Yokogawa Electric Corporation
- 16.2.17.1. Overview
- 16.2.17.2. Products
- 16.2.17.3. SWOT Analysis
- 16.2.17.4. Recent Developments
- 16.2.17.5. Financials (Based on Availability)
- 16.2.18 The Krohne Group
- 16.2.18.1. Overview
- 16.2.18.2. Products
- 16.2.18.3. SWOT Analysis
- 16.2.18.4. Recent Developments
- 16.2.18.5. Financials (Based on Availability)
- 16.2.19 Analog Devices Inc
- 16.2.19.1. Overview
- 16.2.19.2. Products
- 16.2.19.3. SWOT Analysis
- 16.2.19.4. Recent Developments
- 16.2.19.5. Financials (Based on Availability)
- 16.2.20 Endress + Hauser AG
- 16.2.20.1. Overview
- 16.2.20.2. Products
- 16.2.20.3. SWOT Analysis
- 16.2.20.4. Recent Developments
- 16.2.20.5. Financials (Based on Availability)
- 16.2.21 Bosch Sensortec GMBH (Bosch Internationals)
- 16.2.21.1. Overview
- 16.2.21.2. Products
- 16.2.21.3. SWOT Analysis
- 16.2.21.4. Recent Developments
- 16.2.21.5. Financials (Based on Availability)
- 16.2.22 Stmicroelectronics Inc
- 16.2.22.1. Overview
- 16.2.22.2. Products
- 16.2.22.3. SWOT Analysis
- 16.2.22.4. Recent Developments
- 16.2.22.5. Financials (Based on Availability)
- 16.2.1 Honeywell International Inc
List of Figures
- Figure 1: Global US Industrial Sensors Market Revenue Breakdown (Million, %) by Region 2024 & 2032
- Figure 2: United states US Industrial Sensors Market Revenue (Million), by Country 2024 & 2032
- Figure 3: United states US Industrial Sensors Market Revenue Share (%), by Country 2024 & 2032
- Figure 4: North America US Industrial Sensors Market Revenue (Million), by Connectivity 2024 & 2032
- Figure 5: North America US Industrial Sensors Market Revenue Share (%), by Connectivity 2024 & 2032
- Figure 6: North America US Industrial Sensors Market Revenue (Million), by Type 2024 & 2032
- Figure 7: North America US Industrial Sensors Market Revenue Share (%), by Type 2024 & 2032
- Figure 8: North America US Industrial Sensors Market Revenue (Million), by Country 2024 & 2032
- Figure 9: North America US Industrial Sensors Market Revenue Share (%), by Country 2024 & 2032
- Figure 10: South America US Industrial Sensors Market Revenue (Million), by Connectivity 2024 & 2032
- Figure 11: South America US Industrial Sensors Market Revenue Share (%), by Connectivity 2024 & 2032
- Figure 12: South America US Industrial Sensors Market Revenue (Million), by Type 2024 & 2032
- Figure 13: South America US Industrial Sensors Market Revenue Share (%), by Type 2024 & 2032
- Figure 14: South America US Industrial Sensors Market Revenue (Million), by Country 2024 & 2032
- Figure 15: South America US Industrial Sensors Market Revenue Share (%), by Country 2024 & 2032
- Figure 16: Europe US Industrial Sensors Market Revenue (Million), by Connectivity 2024 & 2032
- Figure 17: Europe US Industrial Sensors Market Revenue Share (%), by Connectivity 2024 & 2032
- Figure 18: Europe US Industrial Sensors Market Revenue (Million), by Type 2024 & 2032
- Figure 19: Europe US Industrial Sensors Market Revenue Share (%), by Type 2024 & 2032
- Figure 20: Europe US Industrial Sensors Market Revenue (Million), by Country 2024 & 2032
- Figure 21: Europe US Industrial Sensors Market Revenue Share (%), by Country 2024 & 2032
- Figure 22: Middle East & Africa US Industrial Sensors Market Revenue (Million), by Connectivity 2024 & 2032
- Figure 23: Middle East & Africa US Industrial Sensors Market Revenue Share (%), by Connectivity 2024 & 2032
- Figure 24: Middle East & Africa US Industrial Sensors Market Revenue (Million), by Type 2024 & 2032
- Figure 25: Middle East & Africa US Industrial Sensors Market Revenue Share (%), by Type 2024 & 2032
- Figure 26: Middle East & Africa US Industrial Sensors Market Revenue (Million), by Country 2024 & 2032
- Figure 27: Middle East & Africa US Industrial Sensors Market Revenue Share (%), by Country 2024 & 2032
- Figure 28: Asia Pacific US Industrial Sensors Market Revenue (Million), by Connectivity 2024 & 2032
- Figure 29: Asia Pacific US Industrial Sensors Market Revenue Share (%), by Connectivity 2024 & 2032
- Figure 30: Asia Pacific US Industrial Sensors Market Revenue (Million), by Type 2024 & 2032
- Figure 31: Asia Pacific US Industrial Sensors Market Revenue Share (%), by Type 2024 & 2032
- Figure 32: Asia Pacific US Industrial Sensors Market Revenue (Million), by Country 2024 & 2032
- Figure 33: Asia Pacific US Industrial Sensors Market Revenue Share (%), by Country 2024 & 2032
List of Tables
- Table 1: Global US Industrial Sensors Market Revenue Million Forecast, by Region 2019 & 2032
- Table 2: Global US Industrial Sensors Market Revenue Million Forecast, by Connectivity 2019 & 2032
- Table 3: Global US Industrial Sensors Market Revenue Million Forecast, by Type 2019 & 2032
- Table 4: Global US Industrial Sensors Market Revenue Million Forecast, by Region 2019 & 2032
- Table 5: Global US Industrial Sensors Market Revenue Million Forecast, by Country 2019 & 2032
- Table 6: Northeast US Industrial Sensors Market Revenue (Million) Forecast, by Application 2019 & 2032
- Table 7: Southeast US Industrial Sensors Market Revenue (Million) Forecast, by Application 2019 & 2032
- Table 8: Midwest US Industrial Sensors Market Revenue (Million) Forecast, by Application 2019 & 2032
- Table 9: Southwest US Industrial Sensors Market Revenue (Million) Forecast, by Application 2019 & 2032
- Table 10: West US Industrial Sensors Market Revenue (Million) Forecast, by Application 2019 & 2032
- Table 11: Global US Industrial Sensors Market Revenue Million Forecast, by Connectivity 2019 & 2032
- Table 12: Global US Industrial Sensors Market Revenue Million Forecast, by Type 2019 & 2032
- Table 13: Global US Industrial Sensors Market Revenue Million Forecast, by Country 2019 & 2032
- Table 14: United States US Industrial Sensors Market Revenue (Million) Forecast, by Application 2019 & 2032
- Table 15: Canada US Industrial Sensors Market Revenue (Million) Forecast, by Application 2019 & 2032
- Table 16: Mexico US Industrial Sensors Market Revenue (Million) Forecast, by Application 2019 & 2032
- Table 17: Global US Industrial Sensors Market Revenue Million Forecast, by Connectivity 2019 & 2032
- Table 18: Global US Industrial Sensors Market Revenue Million Forecast, by Type 2019 & 2032
- Table 19: Global US Industrial Sensors Market Revenue Million Forecast, by Country 2019 & 2032
- Table 20: Brazil US Industrial Sensors Market Revenue (Million) Forecast, by Application 2019 & 2032
- Table 21: Argentina US Industrial Sensors Market Revenue (Million) Forecast, by Application 2019 & 2032
- Table 22: Rest of South America US Industrial Sensors Market Revenue (Million) Forecast, by Application 2019 & 2032
- Table 23: Global US Industrial Sensors Market Revenue Million Forecast, by Connectivity 2019 & 2032
- Table 24: Global US Industrial Sensors Market Revenue Million Forecast, by Type 2019 & 2032
- Table 25: Global US Industrial Sensors Market Revenue Million Forecast, by Country 2019 & 2032
- Table 26: United Kingdom US Industrial Sensors Market Revenue (Million) Forecast, by Application 2019 & 2032
- Table 27: Germany US Industrial Sensors Market Revenue (Million) Forecast, by Application 2019 & 2032
- Table 28: France US Industrial Sensors Market Revenue (Million) Forecast, by Application 2019 & 2032
- Table 29: Italy US Industrial Sensors Market Revenue (Million) Forecast, by Application 2019 & 2032
- Table 30: Spain US Industrial Sensors Market Revenue (Million) Forecast, by Application 2019 & 2032
- Table 31: Russia US Industrial Sensors Market Revenue (Million) Forecast, by Application 2019 & 2032
- Table 32: Benelux US Industrial Sensors Market Revenue (Million) Forecast, by Application 2019 & 2032
- Table 33: Nordics US Industrial Sensors Market Revenue (Million) Forecast, by Application 2019 & 2032
- Table 34: Rest of Europe US Industrial Sensors Market Revenue (Million) Forecast, by Application 2019 & 2032
- Table 35: Global US Industrial Sensors Market Revenue Million Forecast, by Connectivity 2019 & 2032
- Table 36: Global US Industrial Sensors Market Revenue Million Forecast, by Type 2019 & 2032
- Table 37: Global US Industrial Sensors Market Revenue Million Forecast, by Country 2019 & 2032
- Table 38: Turkey US Industrial Sensors Market Revenue (Million) Forecast, by Application 2019 & 2032
- Table 39: Israel US Industrial Sensors Market Revenue (Million) Forecast, by Application 2019 & 2032
- Table 40: GCC US Industrial Sensors Market Revenue (Million) Forecast, by Application 2019 & 2032
- Table 41: North Africa US Industrial Sensors Market Revenue (Million) Forecast, by Application 2019 & 2032
- Table 42: South Africa US Industrial Sensors Market Revenue (Million) Forecast, by Application 2019 & 2032
- Table 43: Rest of Middle East & Africa US Industrial Sensors Market Revenue (Million) Forecast, by Application 2019 & 2032
- Table 44: Global US Industrial Sensors Market Revenue Million Forecast, by Connectivity 2019 & 2032
- Table 45: Global US Industrial Sensors Market Revenue Million Forecast, by Type 2019 & 2032
- Table 46: Global US Industrial Sensors Market Revenue Million Forecast, by Country 2019 & 2032
- Table 47: China US Industrial Sensors Market Revenue (Million) Forecast, by Application 2019 & 2032
- Table 48: India US Industrial Sensors Market Revenue (Million) Forecast, by Application 2019 & 2032
- Table 49: Japan US Industrial Sensors Market Revenue (Million) Forecast, by Application 2019 & 2032
- Table 50: South Korea US Industrial Sensors Market Revenue (Million) Forecast, by Application 2019 & 2032
- Table 51: ASEAN US Industrial Sensors Market Revenue (Million) Forecast, by Application 2019 & 2032
- Table 52: Oceania US Industrial Sensors Market Revenue (Million) Forecast, by Application 2019 & 2032
- Table 53: Rest of Asia Pacific US Industrial Sensors Market Revenue (Million) Forecast, by Application 2019 & 2032
Frequently Asked Questions
1. What is the projected Compound Annual Growth Rate (CAGR) of the US Industrial Sensors Market?
The projected CAGR is approximately 6.93%.
2. Which companies are prominent players in the US Industrial Sensors Market?
Key companies in the market include Honeywell International Inc, ABB Ltd, NXP Semiconductors N V, Sensata Technologies Inc, Vega Grieshaber KG, Emerson Electric Co, Siemens AG, Meggitt Sensing Systems, Omron Corporation, Omega Engineering Inc, Sick AG, TE Connectivity Ltd, Infineon Technologies A, Ams-osram AG, Texas Instruments Incorporated, Rockwell Automation Inc, Yokogawa Electric Corporation, The Krohne Group, Analog Devices Inc, Endress + Hauser AG, Bosch Sensortec GMBH (Bosch Internationals), Stmicroelectronics Inc.
3. What are the main segments of the US Industrial Sensors Market?
The market segments include Connectivity , Type .
4. Can you provide details about the market size?
The market size is estimated to be USD 16.52 Million as of 2022.
5. What are some drivers contributing to market growth?
Growing Adoption of IoT Leading to Demand for Sensing Components; Growing Emphasis on the Use of Predictive Maintenance and Remote Monitoring.
6. What are the notable trends driving market growth?
Growing Adoption of IoT Leading to Demand for Sensing Components Drives the Market.
7. Are there any restraints impacting market growth?
High Cost and Operational Concern.
8. Can you provide examples of recent developments in the market?
September 2023 - KROHNE, Inc. announced to showcase a wide range of its industry-leading water and wastewater products, including the latest version of the OPTISONIC 6300 clamp-on ultrasonic flowmeter at WEFTEC 2023. Likewise, in January 2023, the company announced to exhibit products for food and beverage production at the Food Processing Expo 2023, which includes the OPTISONIC 6300P ultrasonic clamp-on flowmeter, the WATERFLUX 3070 electromagnetic water meter, and the OPTIFLUX 2000 electromagnetic flow sensor.
9. What pricing options are available for accessing the report?
Pricing options include single-user, multi-user, and enterprise licenses priced at USD 3800, USD 4500, and USD 5800 respectively.
10. Is the market size provided in terms of value or volume?
The market size is provided in terms of value, measured in Million.
11. Are there any specific market keywords associated with the report?
Yes, the market keyword associated with the report is "US Industrial Sensors Market," which aids in identifying and referencing the specific market segment covered.
12. How do I determine which pricing option suits my needs best?
The pricing options vary based on user requirements and access needs. Individual users may opt for single-user licenses, while businesses requiring broader access may choose multi-user or enterprise licenses for cost-effective access to the report.
13. Are there any additional resources or data provided in the US Industrial Sensors Market report?
While the report offers comprehensive insights, it's advisable to review the specific contents or supplementary materials provided to ascertain if additional resources or data are available.
14. How can I stay updated on further developments or reports in the US Industrial Sensors Market?
To stay informed about further developments, trends, and reports in the US Industrial Sensors Market, consider subscribing to industry newsletters, following relevant companies and organizations, or regularly checking reputable industry news sources and publications.
Methodology
Step 1 - Identification of Relevant Samples Size from Population Database


Step 2 - Approaches for Defining Global Market Size (Value, Volume* & Price*)

Note*: In applicable scenarios
Step 3 - Data Sources
Primary Research
- Web Analytics
- Survey Reports
- Research Institute
- Latest Research Reports
- Opinion Leaders
Secondary Research
- Annual Reports
- White Paper
- Latest Press Release
- Industry Association
- Paid Database
- Investor Presentations

Step 4 - Data Triangulation
Involves using different sources of information in order to increase the validity of a study
These sources are likely to be stakeholders in a program - participants, other researchers, program staff, other community members, and so on.
Then we put all data in single framework & apply various statistical tools to find out the dynamic on the market.
During the analysis stage, feedback from the stakeholder groups would be compared to determine areas of agreement as well as areas of divergence


