
Key Insights
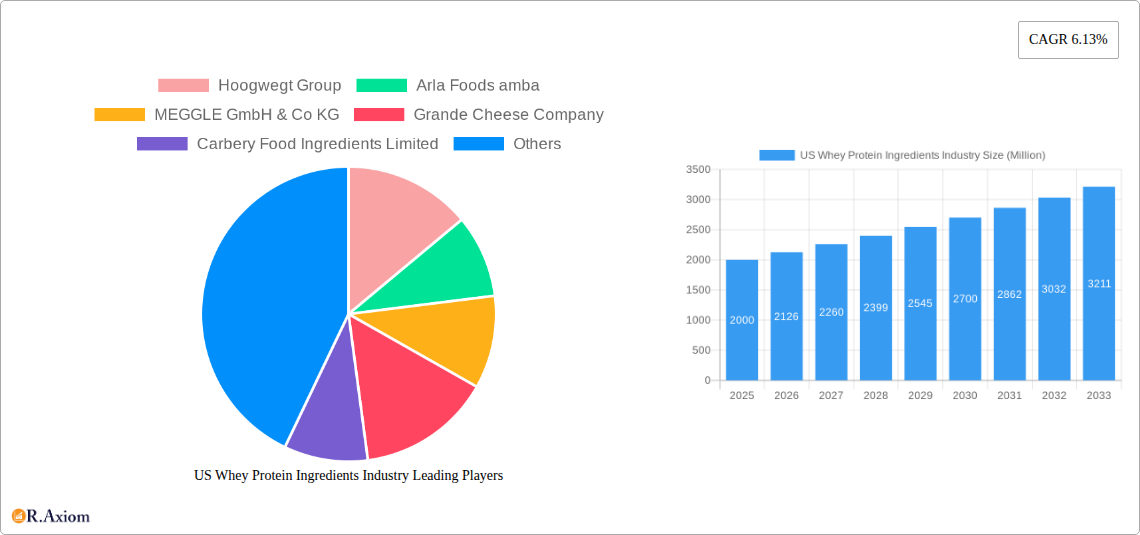
The US whey protein ingredients market, exhibiting a robust CAGR of 6.13%, presents a compelling investment opportunity. Driven by the surging popularity of protein-enhanced diets amongst health-conscious consumers and the expanding sports nutrition sector, the market is experiencing significant growth. The increasing demand for convenient and high-quality protein sources fuels the adoption of whey protein ingredients across diverse applications, including food and beverages, animal feed, and, notably, the rapidly expanding sports/performance nutrition segment. Concentrates, hydrolyzed, and isolates represent the primary forms of whey protein, each catering to specific functional and cost requirements within these various end-use markets. While precise market sizing for the US specifically is unavailable, a reasonable estimation, considering the global market trends and the significant US consumer base for health and wellness products, would place the 2025 market value at approximately $2 billion. This estimate factors in the robust growth experienced globally and the high per capita consumption of protein-rich foods within the US. Growth is further propelled by technological advancements in whey protein processing, leading to improved functionality and cost-effectiveness. However, potential restraints include fluctuating milk prices (a key raw material), stringent regulations concerning food safety and labeling, and the rising popularity of plant-based protein alternatives. Major players like Glanbia PLC, Fonterra, and Arla Foods are actively shaping the market through product innovation, strategic partnerships, and geographical expansion.
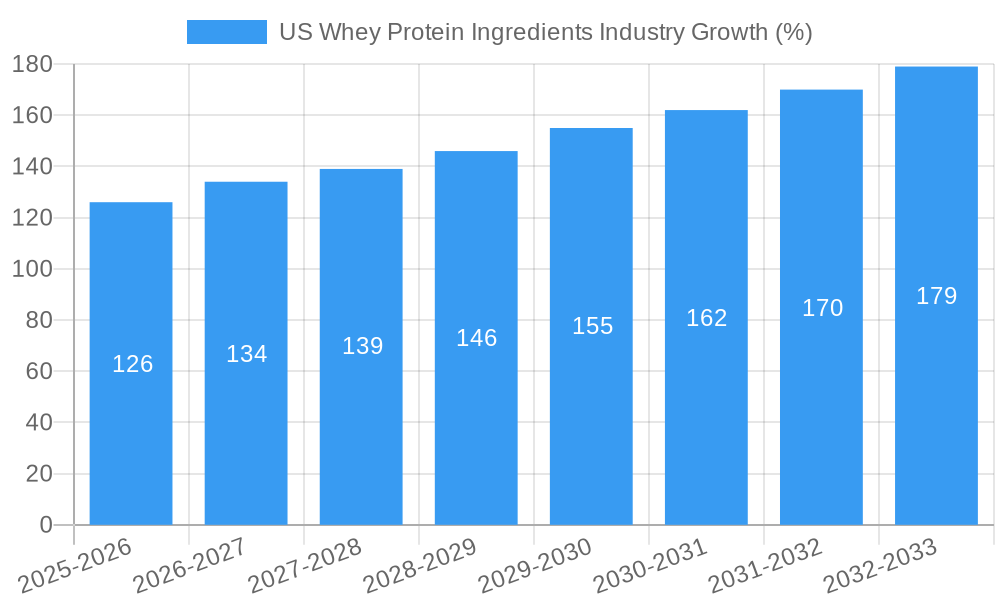
The forecast period of 2025-2033 anticipates consistent market expansion. The projected growth trajectory considers continued consumer demand for high-protein diets, the expansion of the sports nutrition market fueled by increased fitness awareness and participation, and continued product innovation within the industry. Challenges remain however, especially the price volatility of raw materials and the emergence of competitive plant-based protein alternatives. Companies will need to focus on sustainability initiatives, transparent sourcing, and the development of innovative products to maintain a strong market presence. Successful players will be those who can balance cost-effectiveness with high-quality product offerings that meet the evolving demands of a health-conscious and increasingly discerning consumer base. The competitive landscape is characterized by both established multinational corporations and regional players, vying for market share through differentiation, brand building, and strategic partnerships.
US Whey Protein Ingredients Industry: A Comprehensive Market Report (2019-2033)
This detailed report provides a comprehensive analysis of the US whey protein ingredients industry, covering market size, segmentation, key players, growth drivers, challenges, and future opportunities. The study period spans from 2019 to 2033, with 2025 serving as the base and estimated year. This report is essential for industry stakeholders, investors, and businesses seeking to understand and navigate this dynamic market.
US Whey Protein Ingredients Industry Market Concentration & Innovation
The US whey protein ingredients market exhibits a moderately concentrated landscape, with several large players holding significant market share. While precise market share figures for each company are unavailable, key players like Fonterra, Glanbia PLC, and Dairy Farmers of America control a substantial portion of the market. The industry is characterized by both organic growth and strategic mergers and acquisitions (M&A) activity. Recent M&A deals, while specific values are unavailable (xx Million), indicate a trend towards consolidation and vertical integration within the supply chain. Innovation is driven by consumer demand for high-quality, functional proteins, leading to the development of new whey protein forms, such as isolates and hydrolysates, catering to various applications. Regulatory frameworks, including FDA guidelines on food safety and labeling, significantly impact product development and market entry. Substitute products, like soy protein and pea protein, pose a competitive challenge, although whey protein maintains a leading position due to its superior nutritional profile and established market presence. End-user trends favor functional ingredients, specifically in the sports nutrition and food and beverage segments.
- Market Concentration: Moderately concentrated with a few dominant players.
- Innovation Drivers: Consumer demand for functional proteins, technological advancements.
- Regulatory Framework: FDA guidelines on food safety and labeling.
- Product Substitutes: Soy protein, pea protein.
- M&A Activity: Ongoing consolidation and vertical integration (xx Million in deal values estimated).
- End-User Trends: Growing demand in sports nutrition, food & beverages, and animal feed.
US Whey Protein Ingredients Industry Industry Trends & Insights
The US whey protein ingredients market is experiencing robust growth, driven by factors such as the increasing health consciousness among consumers, the rising popularity of fitness and sports nutrition, and the expanding food and beverage industry. The Compound Annual Growth Rate (CAGR) for the forecast period (2025-2033) is estimated at xx%. Technological advancements in whey protein processing and purification techniques are leading to the production of higher-quality, more functional ingredients. Consumer preferences are shifting towards clean-label products with minimal processing and natural ingredients. Competitive dynamics are intense, with companies focusing on product innovation, brand building, and strategic partnerships to gain market share. Market penetration within new consumer segments (e.g., elderly individuals looking for healthier protein sources) is increasing significantly.
Dominant Markets & Segments in US Whey Protein Ingredients Industry
The largest segment within the US whey protein ingredients market is currently the Food and Beverages end-use sector, driven by its broad application in dairy products, bakery items, and ready-to-drink (RTD) beverages. The Sport/Performance Nutrition segment is also experiencing rapid growth due to the expanding fitness and sports nutrition market. Within whey protein forms, Whey Protein Isolates commands a significant share due to their higher protein concentration and purity.
- Key Drivers for Food and Beverage Dominance:
- Large and established market with diverse applications.
- Growing demand for protein-enriched products.
- Increasing consumption of convenient and ready-to-eat food items.
- Key Drivers for Sport/Performance Nutrition Dominance:
- Growing health consciousness and fitness culture.
- Rising popularity of protein supplements and functional foods.
- Increasing consumer spending on sports nutrition products.
US Whey Protein Ingredients Industry Product Developments
Recent years have witnessed significant product innovations, particularly in the development of whey protein hydrolysates, which offer enhanced digestibility and absorption. Companies are also focusing on developing clean-label, organic, and sustainable whey protein ingredients to meet evolving consumer preferences. These developments enhance the functionality and appeal of whey protein ingredients across diverse applications, creating a competitive advantage in the market. Technological advances in processing and purification enhance the quality and consistency of whey protein products, improving the overall consumer experience.
Report Scope & Segmentation Analysis
This report segments the US whey protein ingredients market based on form (concentrates, isolates, hydrolysates) and end-use (animal feed, food and beverages, sport/performance nutrition). Each segment’s market size, growth projections, and competitive dynamics are analyzed. The growth projection for isolates is significantly higher compared to concentrates and hydrolysates, projected at xx% CAGR from 2025 to 2033, due to a greater demand for purer protein sources, particularly within sports nutrition. The food and beverage segment holds the largest market share but shows a slower growth rate, while the animal feed segment showcases a steady increase in demand. Competitive dynamics vary across segments, with different players specializing in specific forms or end-use applications.
Key Drivers of US Whey Protein Ingredients Industry Growth
Several factors contribute to the growth of the US whey protein ingredients market. The increasing health consciousness among consumers and the growing popularity of fitness and sports nutrition drive demand for protein-rich products. Technological advancements in whey protein processing and purification are leading to higher-quality, functional ingredients. Government regulations supporting healthy eating habits indirectly fuel industry growth. Finally, the expanding food and beverage industry creates opportunities for whey protein inclusion in a wider range of products.
Challenges in the US Whey Protein Ingredients Industry Sector
The US whey protein ingredients industry faces challenges such as fluctuations in milk production and pricing, leading to supply chain disruptions and impacting overall profitability. Stringent regulatory requirements concerning food safety and labeling increase compliance costs for manufacturers. Intense competition from substitute proteins and the rise of plant-based alternatives put downward pressure on prices. These factors limit industry profitability and growth, though consumer demand remains positive overall.
Emerging Opportunities in US Whey Protein Ingredients Industry
Emerging opportunities lie in the development of novel whey protein-based products tailored to specific dietary needs, such as those addressing lactose intolerance or allergies. The growing interest in sustainable and environmentally friendly practices opens avenues for companies focusing on sustainable whey protein production and sourcing. Expansion into new markets like Asia and South America presents lucrative growth potential.
Leading Players in the US Whey Protein Ingredients Industry Market
- Hoogwegt Group
- Arla Foods amba
- MEGGLE GmbH & Co KG
- Grande Cheese Company
- Carbery Food Ingredients Limited
- Koninklijke FrieslandCampina NV
- Glanbia PLC
- Talley's Group Limited
- Dairy Farmers of America
- Agropur Dairy Cooperative
- Fonterra Co-operative Group Limited
- Tatua Co-operative Dairy Company Ltd
- Hilmar Cheese Company Inc
- Morinaga Milk Industry Co Ltd
- Groupe Lactalis
Key Developments in US Whey Protein Ingredients Industry Industry
- November 2021: FrieslandCampina Ingredients showcased its fortified protein water concept at Food Ingredients Europe 2021. This highlights the expanding application of whey protein isolates in the beverage industry.
- June 2022: Fonterra's joint venture launched Pro-Optima™, a functional whey protein concentrate, indicating strategic collaborations to enhance product offerings.
- August 2022: Optimum Nutrition's launch of its Gold Standard Protein Shake RTD shows innovation within the ready-to-drink segment, meeting consumer convenience demands.
Strategic Outlook for US Whey Protein Ingredients Industry Market
The US whey protein ingredients market is poised for sustained growth, driven by increasing consumer demand for high-quality protein sources and the expanding applications in food, beverage, and sports nutrition sectors. Continued innovation in product formulation, coupled with strategic partnerships and investments in sustainable production, will be key factors in shaping the future of this dynamic market. Companies that can adapt to evolving consumer preferences and address challenges effectively are likely to capture a larger market share.
US Whey Protein Ingredients Industry Segmentation
-
1. Form
- 1.1. Concentrates
- 1.2. Hydrolyzed
- 1.3. Isolates
-
2. End User
- 2.1. Animal Feed
-
2.2. Food and Beverages
-
2.2.1. By Sub End User
- 2.2.1.1. Bakery
- 2.2.1.2. Breakfast Cereals
- 2.2.1.3. Condiments/Sauces
- 2.2.1.4. Dairy and Dairy Alternative Products
- 2.2.1.5. RTE/RTC Food Products
- 2.2.1.6. Snacks
-
2.2.1. By Sub End User
- 2.3. Personal Care and Cosmetics
-
2.4. Supplements
- 2.4.1. Baby Food and Infant Formula
- 2.4.2. Elderly Nutrition and Medical Nutrition
- 2.4.3. Sport/Performance Nutrition
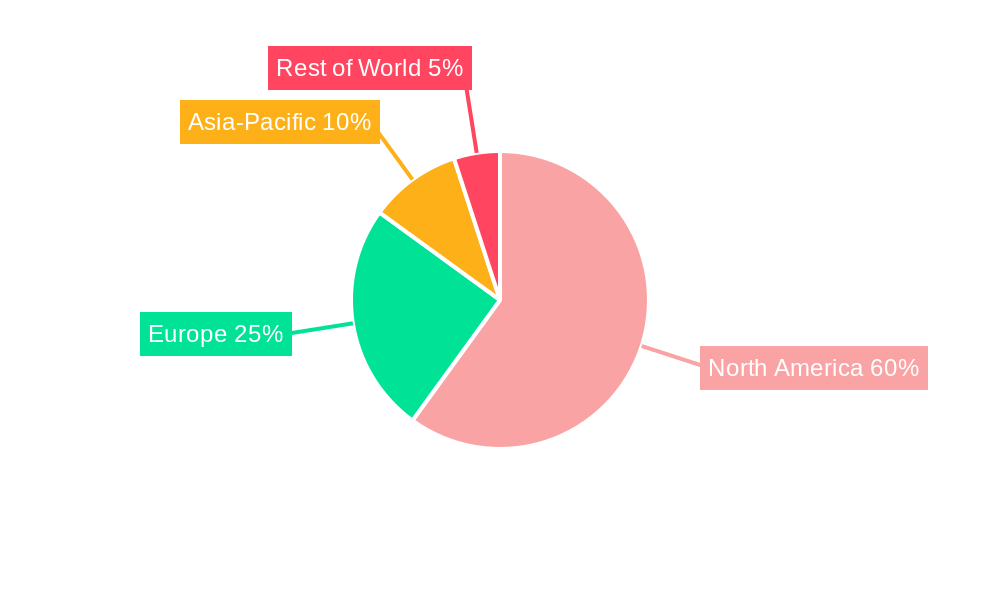
US Whey Protein Ingredients Industry Segmentation By Geography
-
1. North America
- 1.1. United States
- 1.2. Canada
- 1.3. Mexico
-
2. South America
- 2.1. Brazil
- 2.2. Argentina
- 2.3. Rest of South America
-
3. Europe
- 3.1. United Kingdom
- 3.2. Germany
- 3.3. France
- 3.4. Italy
- 3.5. Spain
- 3.6. Russia
- 3.7. Benelux
- 3.8. Nordics
- 3.9. Rest of Europe
-
4. Middle East & Africa
- 4.1. Turkey
- 4.2. Israel
- 4.3. GCC
- 4.4. North Africa
- 4.5. South Africa
- 4.6. Rest of Middle East & Africa
-
5. Asia Pacific
- 5.1. China
- 5.2. India
- 5.3. Japan
- 5.4. South Korea
- 5.5. ASEAN
- 5.6. Oceania
- 5.7. Rest of Asia Pacific
US Whey Protein Ingredients Industry REPORT HIGHLIGHTS
| Aspects | Details |
|---|---|
| Study Period | 2019-2033 |
| Base Year | 2024 |
| Estimated Year | 2025 |
| Forecast Period | 2025-2033 |
| Historical Period | 2019-2024 |
| Growth Rate | CAGR of 6.13% from 2019-2033 |
| Segmentation |
|
Table of Contents
- 1. Introduction
- 1.1. Research Scope
- 1.2. Market Segmentation
- 1.3. Research Methodology
- 1.4. Definitions and Assumptions
- 2. Executive Summary
- 2.1. Introduction
- 3. Market Dynamics
- 3.1. Introduction
- 3.2. Market Drivers
- 3.2.1. Rising Health and Wellness Trends Drives the Market; Rising Demand for functional Food Drives the Market
- 3.3. Market Restrains
- 3.3.1. High Competition from Other Protein Sources
- 3.4. Market Trends
- 3.4.1. OTHER KEY INDUSTRY TRENDS COVERED IN THE REPORT
- 4. Market Factor Analysis
- 4.1. Porters Five Forces
- 4.2. Supply/Value Chain
- 4.3. PESTEL analysis
- 4.4. Market Entropy
- 4.5. Patent/Trademark Analysis
- 5. Global US Whey Protein Ingredients Industry Analysis, Insights and Forecast, 2019-2031
- 5.1. Market Analysis, Insights and Forecast - by Form
- 5.1.1. Concentrates
- 5.1.2. Hydrolyzed
- 5.1.3. Isolates
- 5.2. Market Analysis, Insights and Forecast - by End User
- 5.2.1. Animal Feed
- 5.2.2. Food and Beverages
- 5.2.2.1. By Sub End User
- 5.2.2.1.1. Bakery
- 5.2.2.1.2. Breakfast Cereals
- 5.2.2.1.3. Condiments/Sauces
- 5.2.2.1.4. Dairy and Dairy Alternative Products
- 5.2.2.1.5. RTE/RTC Food Products
- 5.2.2.1.6. Snacks
- 5.2.2.1. By Sub End User
- 5.2.3. Personal Care and Cosmetics
- 5.2.4. Supplements
- 5.2.4.1. Baby Food and Infant Formula
- 5.2.4.2. Elderly Nutrition and Medical Nutrition
- 5.2.4.3. Sport/Performance Nutrition
- 5.3. Market Analysis, Insights and Forecast - by Region
- 5.3.1. North America
- 5.3.2. South America
- 5.3.3. Europe
- 5.3.4. Middle East & Africa
- 5.3.5. Asia Pacific
- 5.1. Market Analysis, Insights and Forecast - by Form
- 6. North America US Whey Protein Ingredients Industry Analysis, Insights and Forecast, 2019-2031
- 6.1. Market Analysis, Insights and Forecast - by Form
- 6.1.1. Concentrates
- 6.1.2. Hydrolyzed
- 6.1.3. Isolates
- 6.2. Market Analysis, Insights and Forecast - by End User
- 6.2.1. Animal Feed
- 6.2.2. Food and Beverages
- 6.2.2.1. By Sub End User
- 6.2.2.1.1. Bakery
- 6.2.2.1.2. Breakfast Cereals
- 6.2.2.1.3. Condiments/Sauces
- 6.2.2.1.4. Dairy and Dairy Alternative Products
- 6.2.2.1.5. RTE/RTC Food Products
- 6.2.2.1.6. Snacks
- 6.2.2.1. By Sub End User
- 6.2.3. Personal Care and Cosmetics
- 6.2.4. Supplements
- 6.2.4.1. Baby Food and Infant Formula
- 6.2.4.2. Elderly Nutrition and Medical Nutrition
- 6.2.4.3. Sport/Performance Nutrition
- 6.1. Market Analysis, Insights and Forecast - by Form
- 7. South America US Whey Protein Ingredients Industry Analysis, Insights and Forecast, 2019-2031
- 7.1. Market Analysis, Insights and Forecast - by Form
- 7.1.1. Concentrates
- 7.1.2. Hydrolyzed
- 7.1.3. Isolates
- 7.2. Market Analysis, Insights and Forecast - by End User
- 7.2.1. Animal Feed
- 7.2.2. Food and Beverages
- 7.2.2.1. By Sub End User
- 7.2.2.1.1. Bakery
- 7.2.2.1.2. Breakfast Cereals
- 7.2.2.1.3. Condiments/Sauces
- 7.2.2.1.4. Dairy and Dairy Alternative Products
- 7.2.2.1.5. RTE/RTC Food Products
- 7.2.2.1.6. Snacks
- 7.2.2.1. By Sub End User
- 7.2.3. Personal Care and Cosmetics
- 7.2.4. Supplements
- 7.2.4.1. Baby Food and Infant Formula
- 7.2.4.2. Elderly Nutrition and Medical Nutrition
- 7.2.4.3. Sport/Performance Nutrition
- 7.1. Market Analysis, Insights and Forecast - by Form
- 8. Europe US Whey Protein Ingredients Industry Analysis, Insights and Forecast, 2019-2031
- 8.1. Market Analysis, Insights and Forecast - by Form
- 8.1.1. Concentrates
- 8.1.2. Hydrolyzed
- 8.1.3. Isolates
- 8.2. Market Analysis, Insights and Forecast - by End User
- 8.2.1. Animal Feed
- 8.2.2. Food and Beverages
- 8.2.2.1. By Sub End User
- 8.2.2.1.1. Bakery
- 8.2.2.1.2. Breakfast Cereals
- 8.2.2.1.3. Condiments/Sauces
- 8.2.2.1.4. Dairy and Dairy Alternative Products
- 8.2.2.1.5. RTE/RTC Food Products
- 8.2.2.1.6. Snacks
- 8.2.2.1. By Sub End User
- 8.2.3. Personal Care and Cosmetics
- 8.2.4. Supplements
- 8.2.4.1. Baby Food and Infant Formula
- 8.2.4.2. Elderly Nutrition and Medical Nutrition
- 8.2.4.3. Sport/Performance Nutrition
- 8.1. Market Analysis, Insights and Forecast - by Form
- 9. Middle East & Africa US Whey Protein Ingredients Industry Analysis, Insights and Forecast, 2019-2031
- 9.1. Market Analysis, Insights and Forecast - by Form
- 9.1.1. Concentrates
- 9.1.2. Hydrolyzed
- 9.1.3. Isolates
- 9.2. Market Analysis, Insights and Forecast - by End User
- 9.2.1. Animal Feed
- 9.2.2. Food and Beverages
- 9.2.2.1. By Sub End User
- 9.2.2.1.1. Bakery
- 9.2.2.1.2. Breakfast Cereals
- 9.2.2.1.3. Condiments/Sauces
- 9.2.2.1.4. Dairy and Dairy Alternative Products
- 9.2.2.1.5. RTE/RTC Food Products
- 9.2.2.1.6. Snacks
- 9.2.2.1. By Sub End User
- 9.2.3. Personal Care and Cosmetics
- 9.2.4. Supplements
- 9.2.4.1. Baby Food and Infant Formula
- 9.2.4.2. Elderly Nutrition and Medical Nutrition
- 9.2.4.3. Sport/Performance Nutrition
- 9.1. Market Analysis, Insights and Forecast - by Form
- 10. Asia Pacific US Whey Protein Ingredients Industry Analysis, Insights and Forecast, 2019-2031
- 10.1. Market Analysis, Insights and Forecast - by Form
- 10.1.1. Concentrates
- 10.1.2. Hydrolyzed
- 10.1.3. Isolates
- 10.2. Market Analysis, Insights and Forecast - by End User
- 10.2.1. Animal Feed
- 10.2.2. Food and Beverages
- 10.2.2.1. By Sub End User
- 10.2.2.1.1. Bakery
- 10.2.2.1.2. Breakfast Cereals
- 10.2.2.1.3. Condiments/Sauces
- 10.2.2.1.4. Dairy and Dairy Alternative Products
- 10.2.2.1.5. RTE/RTC Food Products
- 10.2.2.1.6. Snacks
- 10.2.2.1. By Sub End User
- 10.2.3. Personal Care and Cosmetics
- 10.2.4. Supplements
- 10.2.4.1. Baby Food and Infant Formula
- 10.2.4.2. Elderly Nutrition and Medical Nutrition
- 10.2.4.3. Sport/Performance Nutrition
- 10.1. Market Analysis, Insights and Forecast - by Form
- 11. United States US Whey Protein Ingredients Industry Analysis, Insights and Forecast, 2019-2031
- 12. Canada US Whey Protein Ingredients Industry Analysis, Insights and Forecast, 2019-2031
- 13. Mexico US Whey Protein Ingredients Industry Analysis, Insights and Forecast, 2019-2031
- 14. Competitive Analysis
- 14.1. Global Market Share Analysis 2024
- 14.2. Company Profiles
- 14.2.1 Hoogwegt Group
- 14.2.1.1. Overview
- 14.2.1.2. Products
- 14.2.1.3. SWOT Analysis
- 14.2.1.4. Recent Developments
- 14.2.1.5. Financials (Based on Availability)
- 14.2.2 Arla Foods amba
- 14.2.2.1. Overview
- 14.2.2.2. Products
- 14.2.2.3. SWOT Analysis
- 14.2.2.4. Recent Developments
- 14.2.2.5. Financials (Based on Availability)
- 14.2.3 MEGGLE GmbH & Co KG
- 14.2.3.1. Overview
- 14.2.3.2. Products
- 14.2.3.3. SWOT Analysis
- 14.2.3.4. Recent Developments
- 14.2.3.5. Financials (Based on Availability)
- 14.2.4 Grande Cheese Company
- 14.2.4.1. Overview
- 14.2.4.2. Products
- 14.2.4.3. SWOT Analysis
- 14.2.4.4. Recent Developments
- 14.2.4.5. Financials (Based on Availability)
- 14.2.5 Carbery Food Ingredients Limited
- 14.2.5.1. Overview
- 14.2.5.2. Products
- 14.2.5.3. SWOT Analysis
- 14.2.5.4. Recent Developments
- 14.2.5.5. Financials (Based on Availability)
- 14.2.6 Koninklijke FrieslandCampina NV
- 14.2.6.1. Overview
- 14.2.6.2. Products
- 14.2.6.3. SWOT Analysis
- 14.2.6.4. Recent Developments
- 14.2.6.5. Financials (Based on Availability)
- 14.2.7 Glanbia PLC
- 14.2.7.1. Overview
- 14.2.7.2. Products
- 14.2.7.3. SWOT Analysis
- 14.2.7.4. Recent Developments
- 14.2.7.5. Financials (Based on Availability)
- 14.2.8 Talley's Group Limited
- 14.2.8.1. Overview
- 14.2.8.2. Products
- 14.2.8.3. SWOT Analysis
- 14.2.8.4. Recent Developments
- 14.2.8.5. Financials (Based on Availability)
- 14.2.9 Dairy Farmers of America
- 14.2.9.1. Overview
- 14.2.9.2. Products
- 14.2.9.3. SWOT Analysis
- 14.2.9.4. Recent Developments
- 14.2.9.5. Financials (Based on Availability)
- 14.2.10 Agropur Dairy Cooperative
- 14.2.10.1. Overview
- 14.2.10.2. Products
- 14.2.10.3. SWOT Analysis
- 14.2.10.4. Recent Developments
- 14.2.10.5. Financials (Based on Availability)
- 14.2.11 Fonterra Co-operative Group Limited
- 14.2.11.1. Overview
- 14.2.11.2. Products
- 14.2.11.3. SWOT Analysis
- 14.2.11.4. Recent Developments
- 14.2.11.5. Financials (Based on Availability)
- 14.2.12 Tatua Co-operative Dairy Company Lt
- 14.2.12.1. Overview
- 14.2.12.2. Products
- 14.2.12.3. SWOT Analysis
- 14.2.12.4. Recent Developments
- 14.2.12.5. Financials (Based on Availability)
- 14.2.13 Hilmar Cheese Company Inc
- 14.2.13.1. Overview
- 14.2.13.2. Products
- 14.2.13.3. SWOT Analysis
- 14.2.13.4. Recent Developments
- 14.2.13.5. Financials (Based on Availability)
- 14.2.14 Morinaga Milk Industry Co Ltd
- 14.2.14.1. Overview
- 14.2.14.2. Products
- 14.2.14.3. SWOT Analysis
- 14.2.14.4. Recent Developments
- 14.2.14.5. Financials (Based on Availability)
- 14.2.15 Groupe Lactalis
- 14.2.15.1. Overview
- 14.2.15.2. Products
- 14.2.15.3. SWOT Analysis
- 14.2.15.4. Recent Developments
- 14.2.15.5. Financials (Based on Availability)
- 14.2.1 Hoogwegt Group
List of Figures
- Figure 1: Global US Whey Protein Ingredients Industry Revenue Breakdown (Million, %) by Region 2024 & 2032
- Figure 2: North America US Whey Protein Ingredients Industry Revenue (Million), by Country 2024 & 2032
- Figure 3: North America US Whey Protein Ingredients Industry Revenue Share (%), by Country 2024 & 2032
- Figure 4: North America US Whey Protein Ingredients Industry Revenue (Million), by Form 2024 & 2032
- Figure 5: North America US Whey Protein Ingredients Industry Revenue Share (%), by Form 2024 & 2032
- Figure 6: North America US Whey Protein Ingredients Industry Revenue (Million), by End User 2024 & 2032
- Figure 7: North America US Whey Protein Ingredients Industry Revenue Share (%), by End User 2024 & 2032
- Figure 8: North America US Whey Protein Ingredients Industry Revenue (Million), by Country 2024 & 2032
- Figure 9: North America US Whey Protein Ingredients Industry Revenue Share (%), by Country 2024 & 2032
- Figure 10: South America US Whey Protein Ingredients Industry Revenue (Million), by Form 2024 & 2032
- Figure 11: South America US Whey Protein Ingredients Industry Revenue Share (%), by Form 2024 & 2032
- Figure 12: South America US Whey Protein Ingredients Industry Revenue (Million), by End User 2024 & 2032
- Figure 13: South America US Whey Protein Ingredients Industry Revenue Share (%), by End User 2024 & 2032
- Figure 14: South America US Whey Protein Ingredients Industry Revenue (Million), by Country 2024 & 2032
- Figure 15: South America US Whey Protein Ingredients Industry Revenue Share (%), by Country 2024 & 2032
- Figure 16: Europe US Whey Protein Ingredients Industry Revenue (Million), by Form 2024 & 2032
- Figure 17: Europe US Whey Protein Ingredients Industry Revenue Share (%), by Form 2024 & 2032
- Figure 18: Europe US Whey Protein Ingredients Industry Revenue (Million), by End User 2024 & 2032
- Figure 19: Europe US Whey Protein Ingredients Industry Revenue Share (%), by End User 2024 & 2032
- Figure 20: Europe US Whey Protein Ingredients Industry Revenue (Million), by Country 2024 & 2032
- Figure 21: Europe US Whey Protein Ingredients Industry Revenue Share (%), by Country 2024 & 2032
- Figure 22: Middle East & Africa US Whey Protein Ingredients Industry Revenue (Million), by Form 2024 & 2032
- Figure 23: Middle East & Africa US Whey Protein Ingredients Industry Revenue Share (%), by Form 2024 & 2032
- Figure 24: Middle East & Africa US Whey Protein Ingredients Industry Revenue (Million), by End User 2024 & 2032
- Figure 25: Middle East & Africa US Whey Protein Ingredients Industry Revenue Share (%), by End User 2024 & 2032
- Figure 26: Middle East & Africa US Whey Protein Ingredients Industry Revenue (Million), by Country 2024 & 2032
- Figure 27: Middle East & Africa US Whey Protein Ingredients Industry Revenue Share (%), by Country 2024 & 2032
- Figure 28: Asia Pacific US Whey Protein Ingredients Industry Revenue (Million), by Form 2024 & 2032
- Figure 29: Asia Pacific US Whey Protein Ingredients Industry Revenue Share (%), by Form 2024 & 2032
- Figure 30: Asia Pacific US Whey Protein Ingredients Industry Revenue (Million), by End User 2024 & 2032
- Figure 31: Asia Pacific US Whey Protein Ingredients Industry Revenue Share (%), by End User 2024 & 2032
- Figure 32: Asia Pacific US Whey Protein Ingredients Industry Revenue (Million), by Country 2024 & 2032
- Figure 33: Asia Pacific US Whey Protein Ingredients Industry Revenue Share (%), by Country 2024 & 2032
List of Tables
- Table 1: Global US Whey Protein Ingredients Industry Revenue Million Forecast, by Region 2019 & 2032
- Table 2: Global US Whey Protein Ingredients Industry Revenue Million Forecast, by Form 2019 & 2032
- Table 3: Global US Whey Protein Ingredients Industry Revenue Million Forecast, by End User 2019 & 2032
- Table 4: Global US Whey Protein Ingredients Industry Revenue Million Forecast, by Region 2019 & 2032
- Table 5: Global US Whey Protein Ingredients Industry Revenue Million Forecast, by Country 2019 & 2032
- Table 6: United States US Whey Protein Ingredients Industry Revenue (Million) Forecast, by Application 2019 & 2032
- Table 7: Canada US Whey Protein Ingredients Industry Revenue (Million) Forecast, by Application 2019 & 2032
- Table 8: Mexico US Whey Protein Ingredients Industry Revenue (Million) Forecast, by Application 2019 & 2032
- Table 9: Global US Whey Protein Ingredients Industry Revenue Million Forecast, by Form 2019 & 2032
- Table 10: Global US Whey Protein Ingredients Industry Revenue Million Forecast, by End User 2019 & 2032
- Table 11: Global US Whey Protein Ingredients Industry Revenue Million Forecast, by Country 2019 & 2032
- Table 12: United States US Whey Protein Ingredients Industry Revenue (Million) Forecast, by Application 2019 & 2032
- Table 13: Canada US Whey Protein Ingredients Industry Revenue (Million) Forecast, by Application 2019 & 2032
- Table 14: Mexico US Whey Protein Ingredients Industry Revenue (Million) Forecast, by Application 2019 & 2032
- Table 15: Global US Whey Protein Ingredients Industry Revenue Million Forecast, by Form 2019 & 2032
- Table 16: Global US Whey Protein Ingredients Industry Revenue Million Forecast, by End User 2019 & 2032
- Table 17: Global US Whey Protein Ingredients Industry Revenue Million Forecast, by Country 2019 & 2032
- Table 18: Brazil US Whey Protein Ingredients Industry Revenue (Million) Forecast, by Application 2019 & 2032
- Table 19: Argentina US Whey Protein Ingredients Industry Revenue (Million) Forecast, by Application 2019 & 2032
- Table 20: Rest of South America US Whey Protein Ingredients Industry Revenue (Million) Forecast, by Application 2019 & 2032
- Table 21: Global US Whey Protein Ingredients Industry Revenue Million Forecast, by Form 2019 & 2032
- Table 22: Global US Whey Protein Ingredients Industry Revenue Million Forecast, by End User 2019 & 2032
- Table 23: Global US Whey Protein Ingredients Industry Revenue Million Forecast, by Country 2019 & 2032
- Table 24: United Kingdom US Whey Protein Ingredients Industry Revenue (Million) Forecast, by Application 2019 & 2032
- Table 25: Germany US Whey Protein Ingredients Industry Revenue (Million) Forecast, by Application 2019 & 2032
- Table 26: France US Whey Protein Ingredients Industry Revenue (Million) Forecast, by Application 2019 & 2032
- Table 27: Italy US Whey Protein Ingredients Industry Revenue (Million) Forecast, by Application 2019 & 2032
- Table 28: Spain US Whey Protein Ingredients Industry Revenue (Million) Forecast, by Application 2019 & 2032
- Table 29: Russia US Whey Protein Ingredients Industry Revenue (Million) Forecast, by Application 2019 & 2032
- Table 30: Benelux US Whey Protein Ingredients Industry Revenue (Million) Forecast, by Application 2019 & 2032
- Table 31: Nordics US Whey Protein Ingredients Industry Revenue (Million) Forecast, by Application 2019 & 2032
- Table 32: Rest of Europe US Whey Protein Ingredients Industry Revenue (Million) Forecast, by Application 2019 & 2032
- Table 33: Global US Whey Protein Ingredients Industry Revenue Million Forecast, by Form 2019 & 2032
- Table 34: Global US Whey Protein Ingredients Industry Revenue Million Forecast, by End User 2019 & 2032
- Table 35: Global US Whey Protein Ingredients Industry Revenue Million Forecast, by Country 2019 & 2032
- Table 36: Turkey US Whey Protein Ingredients Industry Revenue (Million) Forecast, by Application 2019 & 2032
- Table 37: Israel US Whey Protein Ingredients Industry Revenue (Million) Forecast, by Application 2019 & 2032
- Table 38: GCC US Whey Protein Ingredients Industry Revenue (Million) Forecast, by Application 2019 & 2032
- Table 39: North Africa US Whey Protein Ingredients Industry Revenue (Million) Forecast, by Application 2019 & 2032
- Table 40: South Africa US Whey Protein Ingredients Industry Revenue (Million) Forecast, by Application 2019 & 2032
- Table 41: Rest of Middle East & Africa US Whey Protein Ingredients Industry Revenue (Million) Forecast, by Application 2019 & 2032
- Table 42: Global US Whey Protein Ingredients Industry Revenue Million Forecast, by Form 2019 & 2032
- Table 43: Global US Whey Protein Ingredients Industry Revenue Million Forecast, by End User 2019 & 2032
- Table 44: Global US Whey Protein Ingredients Industry Revenue Million Forecast, by Country 2019 & 2032
- Table 45: China US Whey Protein Ingredients Industry Revenue (Million) Forecast, by Application 2019 & 2032
- Table 46: India US Whey Protein Ingredients Industry Revenue (Million) Forecast, by Application 2019 & 2032
- Table 47: Japan US Whey Protein Ingredients Industry Revenue (Million) Forecast, by Application 2019 & 2032
- Table 48: South Korea US Whey Protein Ingredients Industry Revenue (Million) Forecast, by Application 2019 & 2032
- Table 49: ASEAN US Whey Protein Ingredients Industry Revenue (Million) Forecast, by Application 2019 & 2032
- Table 50: Oceania US Whey Protein Ingredients Industry Revenue (Million) Forecast, by Application 2019 & 2032
- Table 51: Rest of Asia Pacific US Whey Protein Ingredients Industry Revenue (Million) Forecast, by Application 2019 & 2032
Frequently Asked Questions
1. What is the projected Compound Annual Growth Rate (CAGR) of the US Whey Protein Ingredients Industry?
The projected CAGR is approximately 6.13%.
2. Which companies are prominent players in the US Whey Protein Ingredients Industry?
Key companies in the market include Hoogwegt Group, Arla Foods amba, MEGGLE GmbH & Co KG, Grande Cheese Company, Carbery Food Ingredients Limited, Koninklijke FrieslandCampina NV, Glanbia PLC, Talley's Group Limited, Dairy Farmers of America, Agropur Dairy Cooperative, Fonterra Co-operative Group Limited, Tatua Co-operative Dairy Company Lt, Hilmar Cheese Company Inc, Morinaga Milk Industry Co Ltd, Groupe Lactalis.
3. What are the main segments of the US Whey Protein Ingredients Industry?
The market segments include Form, End User.
4. Can you provide details about the market size?
The market size is estimated to be USD XX Million as of 2022.
5. What are some drivers contributing to market growth?
Rising Health and Wellness Trends Drives the Market; Rising Demand for functional Food Drives the Market.
6. What are the notable trends driving market growth?
OTHER KEY INDUSTRY TRENDS COVERED IN THE REPORT.
7. Are there any restraints impacting market growth?
High Competition from Other Protein Sources.
8. Can you provide examples of recent developments in the market?
August 2022: Optimum Nutrition announced the launch of its new Gold Standard Protein Shake. The RTD is available in chocolate and vanilla flavors and is formulated with 24 grams of protein per serving.June 2022: Fonterra JV entered a joint venture with Tillamook County Creamery Association (TCCA) and a three-mile canyon farm in the United States to launch Pro-Optima TM, a grade A functional whey protein concentrate (fWPC).November 2021: At the Food ingredient Europe 2021, FrieslandCampina Ingredients exhibited 45D, its fortified protein water concept containing Nutri Whey Isolate Clear, in the New Product Zone.
9. What pricing options are available for accessing the report?
Pricing options include single-user, multi-user, and enterprise licenses priced at USD 3800, USD 4500, and USD 5800 respectively.
10. Is the market size provided in terms of value or volume?
The market size is provided in terms of value, measured in Million.
11. Are there any specific market keywords associated with the report?
Yes, the market keyword associated with the report is "US Whey Protein Ingredients Industry," which aids in identifying and referencing the specific market segment covered.
12. How do I determine which pricing option suits my needs best?
The pricing options vary based on user requirements and access needs. Individual users may opt for single-user licenses, while businesses requiring broader access may choose multi-user or enterprise licenses for cost-effective access to the report.
13. Are there any additional resources or data provided in the US Whey Protein Ingredients Industry report?
While the report offers comprehensive insights, it's advisable to review the specific contents or supplementary materials provided to ascertain if additional resources or data are available.
14. How can I stay updated on further developments or reports in the US Whey Protein Ingredients Industry?
To stay informed about further developments, trends, and reports in the US Whey Protein Ingredients Industry, consider subscribing to industry newsletters, following relevant companies and organizations, or regularly checking reputable industry news sources and publications.
Methodology
Step 1 - Identification of Relevant Samples Size from Population Database


Step 2 - Approaches for Defining Global Market Size (Value, Volume* & Price*)

Note*: In applicable scenarios
Step 3 - Data Sources
Primary Research
- Web Analytics
- Survey Reports
- Research Institute
- Latest Research Reports
- Opinion Leaders
Secondary Research
- Annual Reports
- White Paper
- Latest Press Release
- Industry Association
- Paid Database
- Investor Presentations

Step 4 - Data Triangulation
Involves using different sources of information in order to increase the validity of a study
These sources are likely to be stakeholders in a program - participants, other researchers, program staff, other community members, and so on.
Then we put all data in single framework & apply various statistical tools to find out the dynamic on the market.
During the analysis stage, feedback from the stakeholder groups would be compared to determine areas of agreement as well as areas of divergence


