
Key Insights
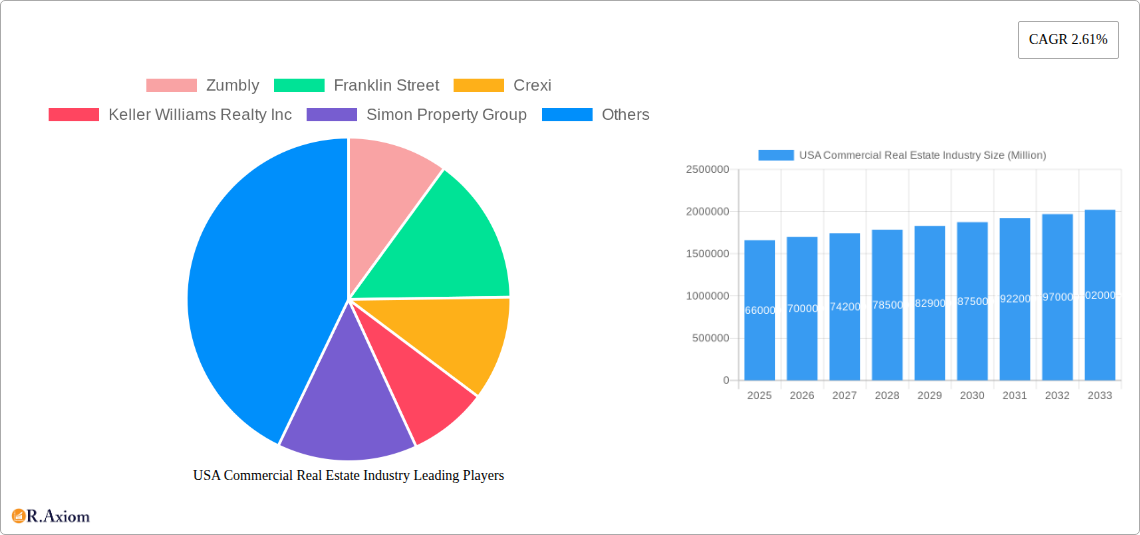
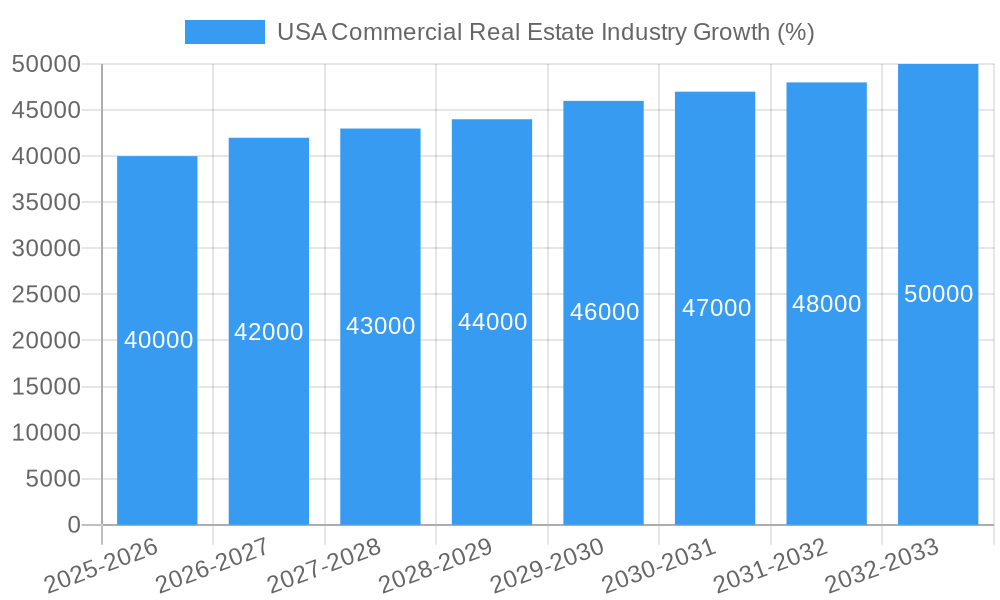
The US commercial real estate (CRE) market, valued at $1.66 trillion in 2025, is projected to experience steady growth, with a compound annual growth rate (CAGR) of 2.61% from 2025 to 2033. This growth is driven by several key factors. Strong economic fundamentals, including a robust job market and increasing urbanization, particularly in major metropolitan areas like New York, Los Angeles, and Chicago, are fueling demand for office, retail, and industrial spaces. The rise of e-commerce continues to drive demand for logistics and warehouse facilities, while the burgeoning hospitality sector and ongoing multi-family residential construction contribute significantly to market expansion. However, challenges remain. Rising interest rates, inflation, and potential economic slowdowns could temper growth in the coming years. Furthermore, shifts in remote work patterns might impact the demand for traditional office spaces, necessitating adjustments in investment strategies within the sector. Segmentation analysis reveals strong performance across various property types, with office space, although facing evolving demand patterns, remaining a significant portion of the market. The geographic distribution shows concentration in major metropolitan areas, reflecting population density and economic activity. This necessitates a nuanced approach by investors, requiring close monitoring of both macroeconomic indicators and micro-market trends.
The competitive landscape is characterized by a mix of large national players like Simon Property Group and Keller Williams Realty Inc., alongside smaller, regional firms specializing in specific market niches, like John Propp Commercial Group or Progressive Real Estate Partners. Technology is playing an increasingly crucial role, with platforms like Crexi and HqO facilitating transactions and property management. The future of the US CRE market will likely be shaped by technological advancements, evolving consumer preferences, and the ongoing adaptation to macroeconomic conditions. Investors seeking success will need to adopt flexible strategies, capable of navigating these dynamic forces and leveraging technological innovations to maintain competitiveness. The forecast period of 2025-2033 presents a compelling but complex investment landscape.
USA Commercial Real Estate Industry: A Comprehensive Market Report (2019-2033)
This in-depth report provides a comprehensive analysis of the USA Commercial Real Estate industry, covering market trends, key players, and future growth projections from 2019 to 2033. The report leverages a robust methodology incorporating historical data (2019-2024), a base year of 2025, and forecasts extending to 2033. It offers invaluable insights for investors, industry professionals, and strategic decision-makers seeking to navigate this dynamic sector. The total market size in 2025 is estimated at $xx Million.
USA Commercial Real Estate Industry Market Concentration & Innovation
This section analyzes the competitive landscape, innovation drivers, and regulatory aspects of the US commercial real estate market. Market concentration is assessed across various segments, revealing the dominance of major players and the presence of niche players. We examine the impact of technological advancements, such as proptech solutions and data analytics, on market dynamics. Furthermore, the report details the influence of regulatory frameworks, including zoning laws and environmental regulations, on investment decisions and development patterns. The analysis also considers the impact of substitute products and shifting end-user preferences on market segmentation. Finally, the report reviews recent mergers and acquisitions (M&A) activities, including deal values and their implications for market consolidation.
- Market Share: The top 5 players account for approximately xx% of the total market share in 2025, with a projected increase to xx% by 2033.
- M&A Activity: Total M&A deal value in 2024 reached $xx Million, signifying significant consolidation within the industry. Projected deal value for 2025-2033 is estimated at $xx Million.
- Innovation Drivers: Proptech adoption, data analytics, and sustainable building practices are key innovation drivers.
- Regulatory Framework: Zoning regulations and environmental considerations significantly impact development projects.
USA Commercial Real Estate Industry Industry Trends & Insights
This section delves into the key trends shaping the US commercial real estate market. We explore the market's growth trajectory, analyzing the compound annual growth rate (CAGR) from 2019 to 2024 and projecting the CAGR from 2025 to 2033. The report examines the influence of technological disruptions, including the rise of remote work and its impact on office demand, and explores evolving consumer preferences affecting retail and hospitality spaces. The competitive dynamics are also explored, analyzing strategies employed by major players to secure market share and adapt to changing market conditions. This analysis will incorporate detailed insights on market penetration of various technologies and business models across segments. The market is experiencing significant changes driven by factors like changing demographics, economic fluctuations, and technological advancements, resulting in a dynamic landscape for investors and developers. The CAGR for the period 2025-2033 is projected to be xx%. Market penetration of proptech solutions is anticipated to reach xx% by 2033.
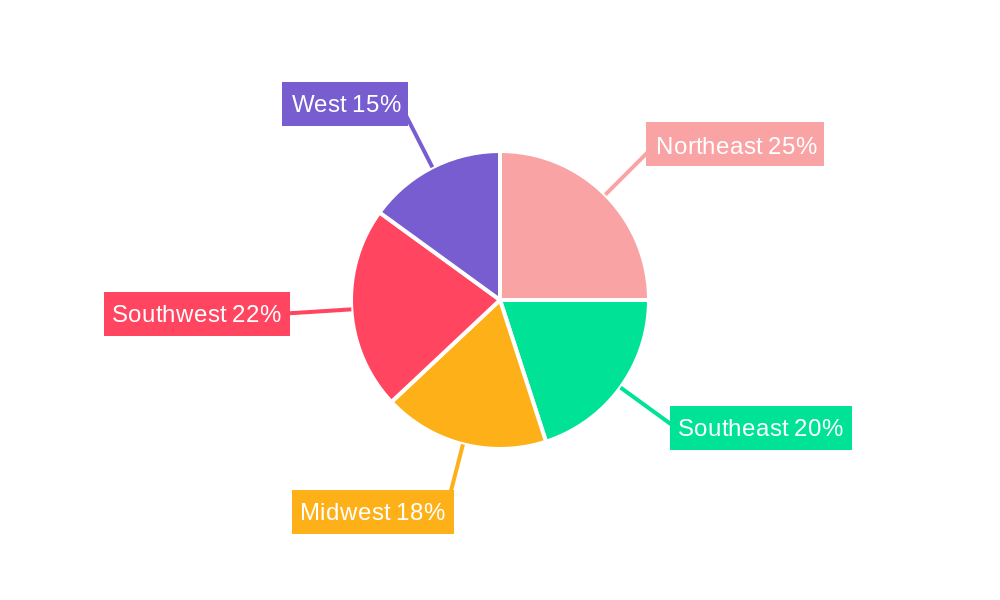
Dominant Markets & Segments in USA Commercial Real Estate Industry
This section identifies the leading segments and geographic regions within the US commercial real estate market. The report assesses the dominance of each segment (Offices, Retail, Industrial, Logistics, Multi-family, Hospitality) and key city (New York, Chicago, Los Angeles, San Francisco, Boston, Denver, Houston, Phoenix, Atlanta, Salt Lake City). The analysis will highlight key drivers for each segment's growth, such as economic policies, infrastructure development, and demographic shifts.
- Key Drivers (By Segment & City):
- New York (Offices): Strong financial sector, high demand for premium office space.
- Los Angeles (Entertainment): Growth in media and entertainment industries.
- Houston (Industrial): Energy sector dominance driving industrial real estate demand.
- Phoenix (Multi-family): Population growth and in-migration fueling multi-family development.
Detailed dominance analysis for each segment and city will be provided, highlighting economic indicators, infrastructure projects, population growth, and government policies that impact each segment's growth and potential.
USA Commercial Real Estate Industry Product Developments
This section summarizes the latest innovations in commercial real estate products and services, including the adoption of smart building technologies, sustainable construction practices, and the use of data analytics to optimize property management. These innovations are assessed in terms of their competitive advantages and market fit, highlighting technological trends that are reshaping the industry. The focus will be on how these innovations address the needs and preferences of both developers and tenants. The increasing integration of technology and the focus on sustainability are driving product development in this space.
Report Scope & Segmentation Analysis
This report covers the entire US commercial real estate market, segmented by property type (Offices, Retail, Industrial, Logistics, Multi-family, Hospitality) and key cities (New York, Chicago, Los Angeles, San Francisco, Boston, Denver, Houston, Phoenix, Atlanta, Salt Lake City). Each segment's growth projection, market size, and competitive landscape will be analyzed individually. The report provides detailed insights into the market dynamics within each segment, highlighting growth opportunities and competitive pressures.
Key Drivers of USA Commercial Real Estate Industry Growth
The growth of the US commercial real estate market is driven by several factors, including strong economic performance, population growth in key cities, technological advancements enhancing efficiency and sustainability in the industry, and supportive government policies promoting real estate investment. Increased investment in infrastructure, particularly transportation networks, further contributes to market expansion.
Challenges in the USA Commercial Real Estate Industry Sector
The US commercial real estate sector faces several challenges, including rising interest rates impacting financing costs, supply chain disruptions affecting construction timelines and materials costs, and increased competition among developers. Regulatory hurdles and environmental concerns also add complexity to development projects. The impact of these challenges on profitability and investment decisions will be thoroughly examined.
Emerging Opportunities in USA Commercial Real Estate Industry
Emerging opportunities exist in areas such as sustainable building practices (leading to tax incentives and reduced operational costs), the growing adoption of PropTech solutions streamlining operations and enhancing tenant experiences, and the development of specialized real estate assets catering to the demands of the evolving economy (e.g., data centers, life science facilities). These opportunities represent significant growth potential for market participants.
Leading Players in the USA Commercial Real Estate Industry Market
- Zumbly
- Franklin Street
- Crexi
- Keller Williams Realty Inc
- Simon Property Group
- Hightower
- Mohr Partners
- Lamudi
- Coldwell Banker
- ERA Real Estate
- RE/MAX
- John Propp Commercial Group
- HqO
- Century
- Progressive Real Estate Partners
- Shannon-Waltchack
Key Developments in USA Commercial Real Estate Industry Industry
- January 2023: Increased interest rates led to a slowdown in commercial real estate transactions.
- March 2024: Significant investment in PropTech companies focused on data analytics.
- June 2024: Launch of a new sustainable building certification program.
- (Further developments will be included in the final report)
Strategic Outlook for USA Commercial Real Estate Industry Market
The US commercial real estate market is poised for continued growth, albeit with adjustments to adapt to changing economic conditions and technological advancements. Opportunities exist in sectors focused on sustainability, technology integration, and providing flexible, adaptable workspaces. Market participants who can innovate and adapt to shifting consumer preferences will be best positioned for success in the coming years. The market is expected to remain dynamic with opportunities for growth despite global uncertainties.
USA Commercial Real Estate Industry Segmentation
-
1. Type
- 1.1. Offices
- 1.2. Retail
- 1.3. Industrial
- 1.4. Logistics
- 1.5. Multi-family
- 1.6. Hospitality
-
2. Key City
- 2.1. New York
- 2.2. Chicago
- 2.3. Los Angeles
- 2.4. San Francisco
- 2.5. Boston
- 2.6. Denver
- 2.7. Houston
- 2.8. Phoenix
- 2.9. Atlanta
- 2.10. Salt Lake City
USA Commercial Real Estate Industry Segmentation By Geography
-
1. North America
- 1.1. United States
- 1.2. Canada
- 1.3. Mexico
-
2. South America
- 2.1. Brazil
- 2.2. Argentina
- 2.3. Rest of South America
-
3. Europe
- 3.1. United Kingdom
- 3.2. Germany
- 3.3. France
- 3.4. Italy
- 3.5. Spain
- 3.6. Russia
- 3.7. Benelux
- 3.8. Nordics
- 3.9. Rest of Europe
-
4. Middle East & Africa
- 4.1. Turkey
- 4.2. Israel
- 4.3. GCC
- 4.4. North Africa
- 4.5. South Africa
- 4.6. Rest of Middle East & Africa
-
5. Asia Pacific
- 5.1. China
- 5.2. India
- 5.3. Japan
- 5.4. South Korea
- 5.5. ASEAN
- 5.6. Oceania
- 5.7. Rest of Asia Pacific
USA Commercial Real Estate Industry REPORT HIGHLIGHTS
| Aspects | Details |
|---|---|
| Study Period | 2019-2033 |
| Base Year | 2024 |
| Estimated Year | 2025 |
| Forecast Period | 2025-2033 |
| Historical Period | 2019-2024 |
| Growth Rate | CAGR of 2.61% from 2019-2033 |
| Segmentation |
|
Table of Contents
- 1. Introduction
- 1.1. Research Scope
- 1.2. Market Segmentation
- 1.3. Research Methodology
- 1.4. Definitions and Assumptions
- 2. Executive Summary
- 2.1. Introduction
- 3. Market Dynamics
- 3.1. Introduction
- 3.2. Market Drivers
- 3.2.1. Increasing number of startups
- 3.3. Market Restrains
- 3.3.1. Low Awareness and Privacy Issues
- 3.4. Market Trends
- 3.4.1. Industrial Sector Expected to Record High Demand
- 4. Market Factor Analysis
- 4.1. Porters Five Forces
- 4.2. Supply/Value Chain
- 4.3. PESTEL analysis
- 4.4. Market Entropy
- 4.5. Patent/Trademark Analysis
- 5. Global USA Commercial Real Estate Industry Analysis, Insights and Forecast, 2019-2031
- 5.1. Market Analysis, Insights and Forecast - by Type
- 5.1.1. Offices
- 5.1.2. Retail
- 5.1.3. Industrial
- 5.1.4. Logistics
- 5.1.5. Multi-family
- 5.1.6. Hospitality
- 5.2. Market Analysis, Insights and Forecast - by Key City
- 5.2.1. New York
- 5.2.2. Chicago
- 5.2.3. Los Angeles
- 5.2.4. San Francisco
- 5.2.5. Boston
- 5.2.6. Denver
- 5.2.7. Houston
- 5.2.8. Phoenix
- 5.2.9. Atlanta
- 5.2.10. Salt Lake City
- 5.3. Market Analysis, Insights and Forecast - by Region
- 5.3.1. North America
- 5.3.2. South America
- 5.3.3. Europe
- 5.3.4. Middle East & Africa
- 5.3.5. Asia Pacific
- 5.1. Market Analysis, Insights and Forecast - by Type
- 6. North America USA Commercial Real Estate Industry Analysis, Insights and Forecast, 2019-2031
- 6.1. Market Analysis, Insights and Forecast - by Type
- 6.1.1. Offices
- 6.1.2. Retail
- 6.1.3. Industrial
- 6.1.4. Logistics
- 6.1.5. Multi-family
- 6.1.6. Hospitality
- 6.2. Market Analysis, Insights and Forecast - by Key City
- 6.2.1. New York
- 6.2.2. Chicago
- 6.2.3. Los Angeles
- 6.2.4. San Francisco
- 6.2.5. Boston
- 6.2.6. Denver
- 6.2.7. Houston
- 6.2.8. Phoenix
- 6.2.9. Atlanta
- 6.2.10. Salt Lake City
- 6.1. Market Analysis, Insights and Forecast - by Type
- 7. South America USA Commercial Real Estate Industry Analysis, Insights and Forecast, 2019-2031
- 7.1. Market Analysis, Insights and Forecast - by Type
- 7.1.1. Offices
- 7.1.2. Retail
- 7.1.3. Industrial
- 7.1.4. Logistics
- 7.1.5. Multi-family
- 7.1.6. Hospitality
- 7.2. Market Analysis, Insights and Forecast - by Key City
- 7.2.1. New York
- 7.2.2. Chicago
- 7.2.3. Los Angeles
- 7.2.4. San Francisco
- 7.2.5. Boston
- 7.2.6. Denver
- 7.2.7. Houston
- 7.2.8. Phoenix
- 7.2.9. Atlanta
- 7.2.10. Salt Lake City
- 7.1. Market Analysis, Insights and Forecast - by Type
- 8. Europe USA Commercial Real Estate Industry Analysis, Insights and Forecast, 2019-2031
- 8.1. Market Analysis, Insights and Forecast - by Type
- 8.1.1. Offices
- 8.1.2. Retail
- 8.1.3. Industrial
- 8.1.4. Logistics
- 8.1.5. Multi-family
- 8.1.6. Hospitality
- 8.2. Market Analysis, Insights and Forecast - by Key City
- 8.2.1. New York
- 8.2.2. Chicago
- 8.2.3. Los Angeles
- 8.2.4. San Francisco
- 8.2.5. Boston
- 8.2.6. Denver
- 8.2.7. Houston
- 8.2.8. Phoenix
- 8.2.9. Atlanta
- 8.2.10. Salt Lake City
- 8.1. Market Analysis, Insights and Forecast - by Type
- 9. Middle East & Africa USA Commercial Real Estate Industry Analysis, Insights and Forecast, 2019-2031
- 9.1. Market Analysis, Insights and Forecast - by Type
- 9.1.1. Offices
- 9.1.2. Retail
- 9.1.3. Industrial
- 9.1.4. Logistics
- 9.1.5. Multi-family
- 9.1.6. Hospitality
- 9.2. Market Analysis, Insights and Forecast - by Key City
- 9.2.1. New York
- 9.2.2. Chicago
- 9.2.3. Los Angeles
- 9.2.4. San Francisco
- 9.2.5. Boston
- 9.2.6. Denver
- 9.2.7. Houston
- 9.2.8. Phoenix
- 9.2.9. Atlanta
- 9.2.10. Salt Lake City
- 9.1. Market Analysis, Insights and Forecast - by Type
- 10. Asia Pacific USA Commercial Real Estate Industry Analysis, Insights and Forecast, 2019-2031
- 10.1. Market Analysis, Insights and Forecast - by Type
- 10.1.1. Offices
- 10.1.2. Retail
- 10.1.3. Industrial
- 10.1.4. Logistics
- 10.1.5. Multi-family
- 10.1.6. Hospitality
- 10.2. Market Analysis, Insights and Forecast - by Key City
- 10.2.1. New York
- 10.2.2. Chicago
- 10.2.3. Los Angeles
- 10.2.4. San Francisco
- 10.2.5. Boston
- 10.2.6. Denver
- 10.2.7. Houston
- 10.2.8. Phoenix
- 10.2.9. Atlanta
- 10.2.10. Salt Lake City
- 10.1. Market Analysis, Insights and Forecast - by Type
- 11. Northeast USA Commercial Real Estate Industry Analysis, Insights and Forecast, 2019-2031
- 12. Southeast USA Commercial Real Estate Industry Analysis, Insights and Forecast, 2019-2031
- 13. Midwest USA Commercial Real Estate Industry Analysis, Insights and Forecast, 2019-2031
- 14. Southwest USA Commercial Real Estate Industry Analysis, Insights and Forecast, 2019-2031
- 15. West USA Commercial Real Estate Industry Analysis, Insights and Forecast, 2019-2031
- 16. Competitive Analysis
- 16.1. Global Market Share Analysis 2024
- 16.2. Company Profiles
- 16.2.1 Zumbly
- 16.2.1.1. Overview
- 16.2.1.2. Products
- 16.2.1.3. SWOT Analysis
- 16.2.1.4. Recent Developments
- 16.2.1.5. Financials (Based on Availability)
- 16.2.2 Franklin Street
- 16.2.2.1. Overview
- 16.2.2.2. Products
- 16.2.2.3. SWOT Analysis
- 16.2.2.4. Recent Developments
- 16.2.2.5. Financials (Based on Availability)
- 16.2.3 Crexi
- 16.2.3.1. Overview
- 16.2.3.2. Products
- 16.2.3.3. SWOT Analysis
- 16.2.3.4. Recent Developments
- 16.2.3.5. Financials (Based on Availability)
- 16.2.4 Keller Williams Realty Inc
- 16.2.4.1. Overview
- 16.2.4.2. Products
- 16.2.4.3. SWOT Analysis
- 16.2.4.4. Recent Developments
- 16.2.4.5. Financials (Based on Availability)
- 16.2.5 Simon Property Group
- 16.2.5.1. Overview
- 16.2.5.2. Products
- 16.2.5.3. SWOT Analysis
- 16.2.5.4. Recent Developments
- 16.2.5.5. Financials (Based on Availability)
- 16.2.6 Hightower
- 16.2.6.1. Overview
- 16.2.6.2. Products
- 16.2.6.3. SWOT Analysis
- 16.2.6.4. Recent Developments
- 16.2.6.5. Financials (Based on Availability)
- 16.2.7 Mohr Partners
- 16.2.7.1. Overview
- 16.2.7.2. Products
- 16.2.7.3. SWOT Analysis
- 16.2.7.4. Recent Developments
- 16.2.7.5. Financials (Based on Availability)
- 16.2.8 Lamudi
- 16.2.8.1. Overview
- 16.2.8.2. Products
- 16.2.8.3. SWOT Analysis
- 16.2.8.4. Recent Developments
- 16.2.8.5. Financials (Based on Availability)
- 16.2.9 Coldwell Banker
- 16.2.9.1. Overview
- 16.2.9.2. Products
- 16.2.9.3. SWOT Analysis
- 16.2.9.4. Recent Developments
- 16.2.9.5. Financials (Based on Availability)
- 16.2.10 ERA Real Estate
- 16.2.10.1. Overview
- 16.2.10.2. Products
- 16.2.10.3. SWOT Analysis
- 16.2.10.4. Recent Developments
- 16.2.10.5. Financials (Based on Availability)
- 16.2.11 RE/MAX
- 16.2.11.1. Overview
- 16.2.11.2. Products
- 16.2.11.3. SWOT Analysis
- 16.2.11.4. Recent Developments
- 16.2.11.5. Financials (Based on Availability)
- 16.2.12 John Propp Commercial Group
- 16.2.12.1. Overview
- 16.2.12.2. Products
- 16.2.12.3. SWOT Analysis
- 16.2.12.4. Recent Developments
- 16.2.12.5. Financials (Based on Availability)
- 16.2.13 HqO**List Not Exhaustive
- 16.2.13.1. Overview
- 16.2.13.2. Products
- 16.2.13.3. SWOT Analysis
- 16.2.13.4. Recent Developments
- 16.2.13.5. Financials (Based on Availability)
- 16.2.14 Century
- 16.2.14.1. Overview
- 16.2.14.2. Products
- 16.2.14.3. SWOT Analysis
- 16.2.14.4. Recent Developments
- 16.2.14.5. Financials (Based on Availability)
- 16.2.15 Progressive Real Estate Partners
- 16.2.15.1. Overview
- 16.2.15.2. Products
- 16.2.15.3. SWOT Analysis
- 16.2.15.4. Recent Developments
- 16.2.15.5. Financials (Based on Availability)
- 16.2.16 Shannon-Waltchack
- 16.2.16.1. Overview
- 16.2.16.2. Products
- 16.2.16.3. SWOT Analysis
- 16.2.16.4. Recent Developments
- 16.2.16.5. Financials (Based on Availability)
- 16.2.1 Zumbly
List of Figures
- Figure 1: Global USA Commercial Real Estate Industry Revenue Breakdown (Million, %) by Region 2024 & 2032
- Figure 2: United states USA Commercial Real Estate Industry Revenue (Million), by Country 2024 & 2032
- Figure 3: United states USA Commercial Real Estate Industry Revenue Share (%), by Country 2024 & 2032
- Figure 4: North America USA Commercial Real Estate Industry Revenue (Million), by Type 2024 & 2032
- Figure 5: North America USA Commercial Real Estate Industry Revenue Share (%), by Type 2024 & 2032
- Figure 6: North America USA Commercial Real Estate Industry Revenue (Million), by Key City 2024 & 2032
- Figure 7: North America USA Commercial Real Estate Industry Revenue Share (%), by Key City 2024 & 2032
- Figure 8: North America USA Commercial Real Estate Industry Revenue (Million), by Country 2024 & 2032
- Figure 9: North America USA Commercial Real Estate Industry Revenue Share (%), by Country 2024 & 2032
- Figure 10: South America USA Commercial Real Estate Industry Revenue (Million), by Type 2024 & 2032
- Figure 11: South America USA Commercial Real Estate Industry Revenue Share (%), by Type 2024 & 2032
- Figure 12: South America USA Commercial Real Estate Industry Revenue (Million), by Key City 2024 & 2032
- Figure 13: South America USA Commercial Real Estate Industry Revenue Share (%), by Key City 2024 & 2032
- Figure 14: South America USA Commercial Real Estate Industry Revenue (Million), by Country 2024 & 2032
- Figure 15: South America USA Commercial Real Estate Industry Revenue Share (%), by Country 2024 & 2032
- Figure 16: Europe USA Commercial Real Estate Industry Revenue (Million), by Type 2024 & 2032
- Figure 17: Europe USA Commercial Real Estate Industry Revenue Share (%), by Type 2024 & 2032
- Figure 18: Europe USA Commercial Real Estate Industry Revenue (Million), by Key City 2024 & 2032
- Figure 19: Europe USA Commercial Real Estate Industry Revenue Share (%), by Key City 2024 & 2032
- Figure 20: Europe USA Commercial Real Estate Industry Revenue (Million), by Country 2024 & 2032
- Figure 21: Europe USA Commercial Real Estate Industry Revenue Share (%), by Country 2024 & 2032
- Figure 22: Middle East & Africa USA Commercial Real Estate Industry Revenue (Million), by Type 2024 & 2032
- Figure 23: Middle East & Africa USA Commercial Real Estate Industry Revenue Share (%), by Type 2024 & 2032
- Figure 24: Middle East & Africa USA Commercial Real Estate Industry Revenue (Million), by Key City 2024 & 2032
- Figure 25: Middle East & Africa USA Commercial Real Estate Industry Revenue Share (%), by Key City 2024 & 2032
- Figure 26: Middle East & Africa USA Commercial Real Estate Industry Revenue (Million), by Country 2024 & 2032
- Figure 27: Middle East & Africa USA Commercial Real Estate Industry Revenue Share (%), by Country 2024 & 2032
- Figure 28: Asia Pacific USA Commercial Real Estate Industry Revenue (Million), by Type 2024 & 2032
- Figure 29: Asia Pacific USA Commercial Real Estate Industry Revenue Share (%), by Type 2024 & 2032
- Figure 30: Asia Pacific USA Commercial Real Estate Industry Revenue (Million), by Key City 2024 & 2032
- Figure 31: Asia Pacific USA Commercial Real Estate Industry Revenue Share (%), by Key City 2024 & 2032
- Figure 32: Asia Pacific USA Commercial Real Estate Industry Revenue (Million), by Country 2024 & 2032
- Figure 33: Asia Pacific USA Commercial Real Estate Industry Revenue Share (%), by Country 2024 & 2032
List of Tables
- Table 1: Global USA Commercial Real Estate Industry Revenue Million Forecast, by Region 2019 & 2032
- Table 2: Global USA Commercial Real Estate Industry Revenue Million Forecast, by Type 2019 & 2032
- Table 3: Global USA Commercial Real Estate Industry Revenue Million Forecast, by Key City 2019 & 2032
- Table 4: Global USA Commercial Real Estate Industry Revenue Million Forecast, by Region 2019 & 2032
- Table 5: Global USA Commercial Real Estate Industry Revenue Million Forecast, by Country 2019 & 2032
- Table 6: Northeast USA Commercial Real Estate Industry Revenue (Million) Forecast, by Application 2019 & 2032
- Table 7: Southeast USA Commercial Real Estate Industry Revenue (Million) Forecast, by Application 2019 & 2032
- Table 8: Midwest USA Commercial Real Estate Industry Revenue (Million) Forecast, by Application 2019 & 2032
- Table 9: Southwest USA Commercial Real Estate Industry Revenue (Million) Forecast, by Application 2019 & 2032
- Table 10: West USA Commercial Real Estate Industry Revenue (Million) Forecast, by Application 2019 & 2032
- Table 11: Global USA Commercial Real Estate Industry Revenue Million Forecast, by Type 2019 & 2032
- Table 12: Global USA Commercial Real Estate Industry Revenue Million Forecast, by Key City 2019 & 2032
- Table 13: Global USA Commercial Real Estate Industry Revenue Million Forecast, by Country 2019 & 2032
- Table 14: United States USA Commercial Real Estate Industry Revenue (Million) Forecast, by Application 2019 & 2032
- Table 15: Canada USA Commercial Real Estate Industry Revenue (Million) Forecast, by Application 2019 & 2032
- Table 16: Mexico USA Commercial Real Estate Industry Revenue (Million) Forecast, by Application 2019 & 2032
- Table 17: Global USA Commercial Real Estate Industry Revenue Million Forecast, by Type 2019 & 2032
- Table 18: Global USA Commercial Real Estate Industry Revenue Million Forecast, by Key City 2019 & 2032
- Table 19: Global USA Commercial Real Estate Industry Revenue Million Forecast, by Country 2019 & 2032
- Table 20: Brazil USA Commercial Real Estate Industry Revenue (Million) Forecast, by Application 2019 & 2032
- Table 21: Argentina USA Commercial Real Estate Industry Revenue (Million) Forecast, by Application 2019 & 2032
- Table 22: Rest of South America USA Commercial Real Estate Industry Revenue (Million) Forecast, by Application 2019 & 2032
- Table 23: Global USA Commercial Real Estate Industry Revenue Million Forecast, by Type 2019 & 2032
- Table 24: Global USA Commercial Real Estate Industry Revenue Million Forecast, by Key City 2019 & 2032
- Table 25: Global USA Commercial Real Estate Industry Revenue Million Forecast, by Country 2019 & 2032
- Table 26: United Kingdom USA Commercial Real Estate Industry Revenue (Million) Forecast, by Application 2019 & 2032
- Table 27: Germany USA Commercial Real Estate Industry Revenue (Million) Forecast, by Application 2019 & 2032
- Table 28: France USA Commercial Real Estate Industry Revenue (Million) Forecast, by Application 2019 & 2032
- Table 29: Italy USA Commercial Real Estate Industry Revenue (Million) Forecast, by Application 2019 & 2032
- Table 30: Spain USA Commercial Real Estate Industry Revenue (Million) Forecast, by Application 2019 & 2032
- Table 31: Russia USA Commercial Real Estate Industry Revenue (Million) Forecast, by Application 2019 & 2032
- Table 32: Benelux USA Commercial Real Estate Industry Revenue (Million) Forecast, by Application 2019 & 2032
- Table 33: Nordics USA Commercial Real Estate Industry Revenue (Million) Forecast, by Application 2019 & 2032
- Table 34: Rest of Europe USA Commercial Real Estate Industry Revenue (Million) Forecast, by Application 2019 & 2032
- Table 35: Global USA Commercial Real Estate Industry Revenue Million Forecast, by Type 2019 & 2032
- Table 36: Global USA Commercial Real Estate Industry Revenue Million Forecast, by Key City 2019 & 2032
- Table 37: Global USA Commercial Real Estate Industry Revenue Million Forecast, by Country 2019 & 2032
- Table 38: Turkey USA Commercial Real Estate Industry Revenue (Million) Forecast, by Application 2019 & 2032
- Table 39: Israel USA Commercial Real Estate Industry Revenue (Million) Forecast, by Application 2019 & 2032
- Table 40: GCC USA Commercial Real Estate Industry Revenue (Million) Forecast, by Application 2019 & 2032
- Table 41: North Africa USA Commercial Real Estate Industry Revenue (Million) Forecast, by Application 2019 & 2032
- Table 42: South Africa USA Commercial Real Estate Industry Revenue (Million) Forecast, by Application 2019 & 2032
- Table 43: Rest of Middle East & Africa USA Commercial Real Estate Industry Revenue (Million) Forecast, by Application 2019 & 2032
- Table 44: Global USA Commercial Real Estate Industry Revenue Million Forecast, by Type 2019 & 2032
- Table 45: Global USA Commercial Real Estate Industry Revenue Million Forecast, by Key City 2019 & 2032
- Table 46: Global USA Commercial Real Estate Industry Revenue Million Forecast, by Country 2019 & 2032
- Table 47: China USA Commercial Real Estate Industry Revenue (Million) Forecast, by Application 2019 & 2032
- Table 48: India USA Commercial Real Estate Industry Revenue (Million) Forecast, by Application 2019 & 2032
- Table 49: Japan USA Commercial Real Estate Industry Revenue (Million) Forecast, by Application 2019 & 2032
- Table 50: South Korea USA Commercial Real Estate Industry Revenue (Million) Forecast, by Application 2019 & 2032
- Table 51: ASEAN USA Commercial Real Estate Industry Revenue (Million) Forecast, by Application 2019 & 2032
- Table 52: Oceania USA Commercial Real Estate Industry Revenue (Million) Forecast, by Application 2019 & 2032
- Table 53: Rest of Asia Pacific USA Commercial Real Estate Industry Revenue (Million) Forecast, by Application 2019 & 2032
Frequently Asked Questions
1. What is the projected Compound Annual Growth Rate (CAGR) of the USA Commercial Real Estate Industry?
The projected CAGR is approximately 2.61%.
2. Which companies are prominent players in the USA Commercial Real Estate Industry?
Key companies in the market include Zumbly, Franklin Street, Crexi, Keller Williams Realty Inc, Simon Property Group, Hightower, Mohr Partners, Lamudi, Coldwell Banker, ERA Real Estate, RE/MAX, John Propp Commercial Group, HqO**List Not Exhaustive, Century, Progressive Real Estate Partners, Shannon-Waltchack.
3. What are the main segments of the USA Commercial Real Estate Industry?
The market segments include Type, Key City.
4. Can you provide details about the market size?
The market size is estimated to be USD 1.66 Million as of 2022.
5. What are some drivers contributing to market growth?
Increasing number of startups.
6. What are the notable trends driving market growth?
Industrial Sector Expected to Record High Demand.
7. Are there any restraints impacting market growth?
Low Awareness and Privacy Issues.
8. Can you provide examples of recent developments in the market?
N/A
9. What pricing options are available for accessing the report?
Pricing options include single-user, multi-user, and enterprise licenses priced at USD 3800, USD 4500, and USD 5800 respectively.
10. Is the market size provided in terms of value or volume?
The market size is provided in terms of value, measured in Million.
11. Are there any specific market keywords associated with the report?
Yes, the market keyword associated with the report is "USA Commercial Real Estate Industry," which aids in identifying and referencing the specific market segment covered.
12. How do I determine which pricing option suits my needs best?
The pricing options vary based on user requirements and access needs. Individual users may opt for single-user licenses, while businesses requiring broader access may choose multi-user or enterprise licenses for cost-effective access to the report.
13. Are there any additional resources or data provided in the USA Commercial Real Estate Industry report?
While the report offers comprehensive insights, it's advisable to review the specific contents or supplementary materials provided to ascertain if additional resources or data are available.
14. How can I stay updated on further developments or reports in the USA Commercial Real Estate Industry?
To stay informed about further developments, trends, and reports in the USA Commercial Real Estate Industry, consider subscribing to industry newsletters, following relevant companies and organizations, or regularly checking reputable industry news sources and publications.
Methodology
Step 1 - Identification of Relevant Samples Size from Population Database


Step 2 - Approaches for Defining Global Market Size (Value, Volume* & Price*)

Note*: In applicable scenarios
Step 3 - Data Sources
Primary Research
- Web Analytics
- Survey Reports
- Research Institute
- Latest Research Reports
- Opinion Leaders
Secondary Research
- Annual Reports
- White Paper
- Latest Press Release
- Industry Association
- Paid Database
- Investor Presentations

Step 4 - Data Triangulation
Involves using different sources of information in order to increase the validity of a study
These sources are likely to be stakeholders in a program - participants, other researchers, program staff, other community members, and so on.
Then we put all data in single framework & apply various statistical tools to find out the dynamic on the market.
During the analysis stage, feedback from the stakeholder groups would be compared to determine areas of agreement as well as areas of divergence


