
Key Insights
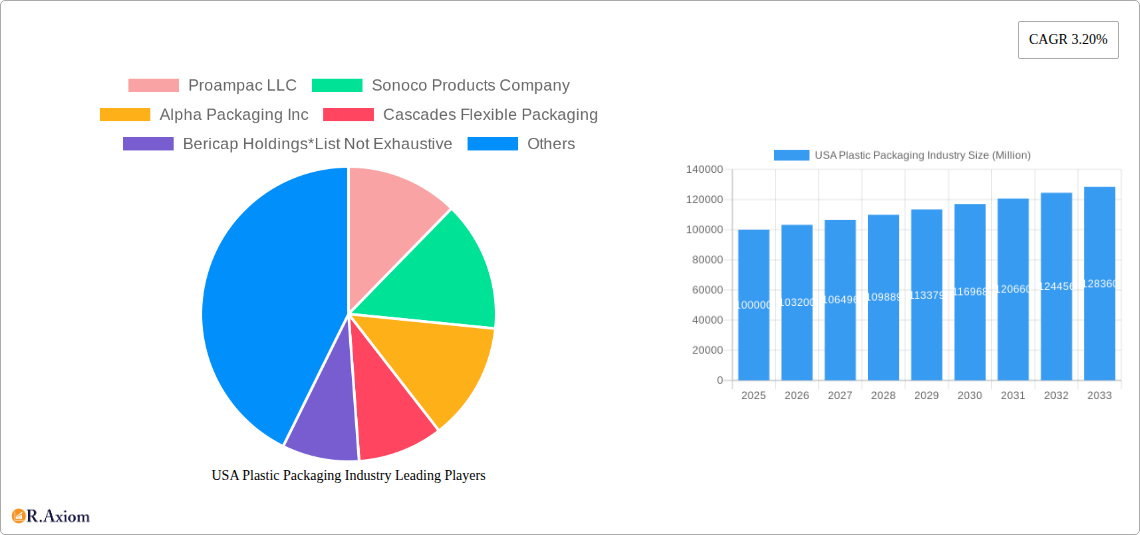
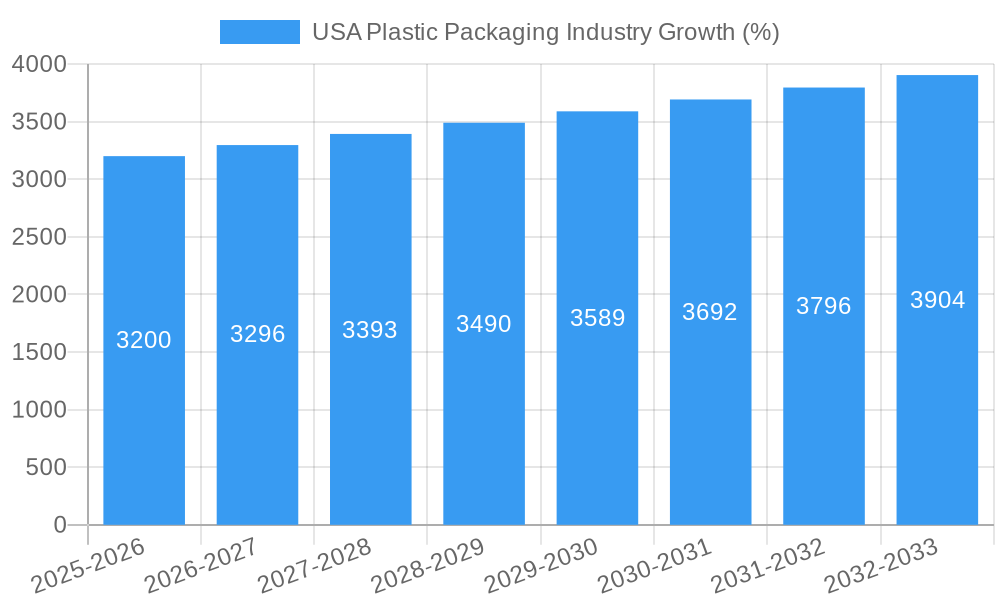
The US plastic packaging industry, a significant segment of the broader packaging market, is experiencing steady growth, driven by the increasing demand for packaged goods across various sectors. The market, estimated at $XX million in 2025, is projected to maintain a Compound Annual Growth Rate (CAGR) of 3.20% from 2025 to 2033. This growth is fueled by several key factors. The burgeoning food and beverage industry, particularly within the convenience food sector, necessitates substantial plastic packaging for preservation, transport, and consumer appeal. Similarly, the pharmaceutical and cosmetics sectors rely heavily on plastic packaging for product protection, hygiene, and branding. Furthermore, ongoing innovations in material science, leading to the development of lighter, more durable, and recyclable plastics like polyethylene (PE) and polypropylene (PP), are contributing to market expansion. The rise of e-commerce is also boosting demand, as more products require protective packaging for shipment. However, growing environmental concerns regarding plastic waste and increasing regulatory scrutiny regarding its disposal are presenting challenges and potential restraints to this growth. To mitigate these, the industry is focusing on developing biodegradable and compostable alternatives, alongside promoting recycling initiatives to foster sustainability. The market is segmented by packaging type (rigid vs. flexible), end-user industry (food, beverage, pharmaceutical, etc.), and material type (PE, PP, PVC, PET, etc.), with each segment exhibiting varying growth trajectories reflecting consumer preferences and industry-specific needs. Major players like Amcor PLC, Berry Global Inc., and Sonoco Products Company are actively engaged in expanding their product portfolios and enhancing their supply chains to capitalize on market opportunities.
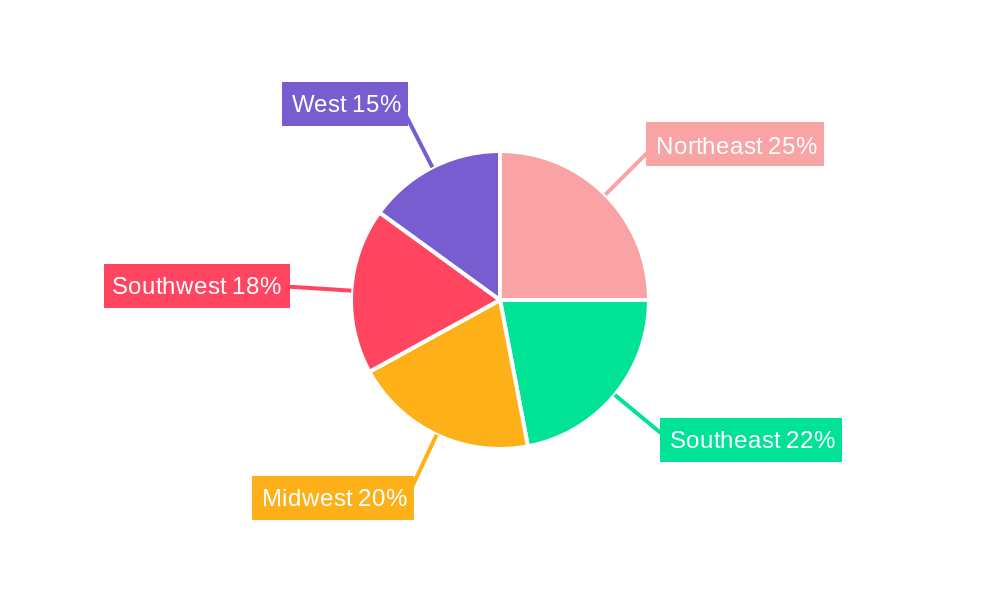
The regional distribution within the US market reveals significant activity across all regions, with Northeast, Southeast, Midwest, Southwest, and West showing considerable demand reflecting population density, industrial concentration, and consumption patterns. While precise regional market shares are not available, it is anticipated that regions with higher population density and robust manufacturing sectors, such as the Northeast and West, will likely hold a larger share. The competitive landscape is characterized by both large multinational corporations and specialized regional players. These companies are constantly striving to improve the efficiency, sustainability, and cost-effectiveness of their plastic packaging solutions while meeting diverse consumer and regulatory demands. The forecast period of 2025-2033 will likely witness a continued expansion of the US plastic packaging market, albeit with a growing emphasis on environmentally responsible practices and sustainable packaging options.
USA Plastic Packaging Industry: A Comprehensive Market Report (2019-2033)
This comprehensive report provides an in-depth analysis of the USA plastic packaging industry, covering market size, segmentation, growth drivers, challenges, and future outlook. The study period spans from 2019 to 2033, with 2025 serving as the base and estimated year. The report incorporates detailed insights into market dynamics, competitive landscape, and emerging trends, providing actionable intelligence for industry stakeholders.
USA Plastic Packaging Industry Market Concentration & Innovation
The USA plastic packaging market is moderately concentrated, with several major players holding significant market share. ProAmpac LLC, Sonoco Products Company, Alpha Packaging Inc., and Amcor PLC are among the leading companies, each contributing to xx% of the overall market in 2025 (estimated). However, a fragmented landscape also exists, with numerous smaller companies specializing in niche segments or regional markets. Market concentration is influenced by factors such as economies of scale, technological capabilities, and M&A activities. The industry is characterized by continuous innovation driven by consumer demand for sustainable packaging solutions, advancements in material science, and stringent regulatory requirements.
- Mergers & Acquisitions (M&A): The past few years have witnessed notable M&A activity, including ProAmpac's acquisition of IG Industries PLC and Brayford Plastics Ltd. in March 2021. This consolidation trend is expected to continue, driven by the need for companies to expand their product portfolios and geographical reach. While precise deal values are not consistently available publicly for all transactions, we estimate that M&A activity contributed to approximately xx Million in market value shifts in 2021 alone.
- Regulatory Frameworks: Stringent environmental regulations regarding plastic waste management and the growing preference for sustainable and recyclable packaging significantly impact the market. This forces manufacturers to invest in R&D to develop eco-friendly alternatives such as biodegradable plastics and compostable packaging.
- Product Substitutes: The industry faces competition from alternative packaging materials like paper, glass, and metal. However, plastic packaging's cost-effectiveness and versatility continue to drive its dominance in various applications.
- End-User Trends: The increasing demand for convenience and extended shelf life in food and beverage products, coupled with the growing e-commerce sector, fuels demand for innovative plastic packaging.
USA Plastic Packaging Industry Industry Trends & Insights
The USA plastic packaging market exhibits significant growth potential, projected to achieve a CAGR of xx% during the forecast period (2025-2033). Key growth drivers include increasing consumption of packaged goods, particularly in the food and beverage sectors. Technological disruptions, such as advancements in automation and smart packaging solutions, further enhance efficiency and product value. Consumer preferences are shifting towards sustainable and recyclable options, prompting manufacturers to develop eco-friendly packaging solutions. The competitive dynamics are intense, with companies focusing on innovation, cost optimization, and strategic partnerships to maintain a strong market position. Market penetration of sustainable packaging is expected to increase to xx% by 2033 from xx% in 2025, driven by increasing consumer awareness and stringent environmental regulations.
Dominant Markets & Segments in USA Plastic Packaging Industry
The USA plastic packaging market is geographically diverse, with the highest demand concentrated in densely populated regions with significant manufacturing and consumption activities. The flexible plastic packaging segment is projected to hold the largest market share due to its versatility and suitability for various applications.
Leading Segments:
- Type: Flexible plastic packaging holds a dominant position due to its versatility and suitability for various applications. Rigid plastic packaging maintains a significant share, mainly driven by the food and beverage sectors.
- End-user Industry: The food and beverage sector is the largest end-user, followed by the pharmaceutical and cosmetics and personal care sectors. The other end-user industries segment demonstrates steady growth, driven by the expanding e-commerce sector.
- Material Type: PE (Polyethylene) and PP (Polypropylene) dominate the material type segment due to their cost-effectiveness and widespread applications. PET (Polyethylene Terephthalate) maintains a considerable share, especially in the beverage sector.
Key Drivers by Segment:
- Economic Policies: Government incentives and subsidies for sustainable packaging solutions boost market growth within specific segments.
- Infrastructure: Robust logistics and distribution networks are crucial, especially for the food and beverage sectors.
USA Plastic Packaging Industry Product Developments
Recent product innovations include the development of lightweight, barrier-enhanced, and recyclable plastic packaging. These advancements cater to the growing demand for sustainable packaging and enhance product protection. Companies are also focusing on smart packaging solutions that incorporate sensors and digital technologies to improve supply chain efficiency and enhance consumer experience. These technological trends have a significant impact on the competitive landscape, with companies constantly striving for differentiation and value-added features.
Report Scope & Segmentation Analysis
This report analyzes the USA plastic packaging market based on several key segmentations:
- Type: Rigid Plastic Packaging (Growth projection: xx%; Market size in 2025: xx Million; Competitive Dynamics: High) and Flexible Plastic Packaging (Growth projection: xx%; Market size in 2025: xx Million; Competitive Dynamics: High).
- End-user Industry: Food (Growth projection: xx%; Market size in 2025: xx Million; Competitive Dynamics: High), Beverage (Growth projection: xx%; Market size in 2025: xx Million; Competitive Dynamics: High), Pharmaceutical (Growth projection: xx%; Market size in 2025: xx Million; Competitive Dynamics: Moderate), Cosmetics and Personal Care (Growth projection: xx%; Market size in 2025: xx Million; Competitive Dynamics: Moderate), and Other End-user Industries (Growth projection: xx%; Market size in 2025: xx Million; Competitive Dynamics: Moderate).
- Material Type: PE (Polyethylene) (Growth projection: xx%; Market size in 2025: xx Million; Competitive Dynamics: High), PP (Polypropylene) (Growth projection: xx%; Market size in 2025: xx Million; Competitive Dynamics: High), PVC (Poly Vinyl Chloride) (Growth projection: xx%; Market size in 2025: xx Million; Competitive Dynamics: Moderate), PET (Polyethylene Terephthalate) (Growth projection: xx%; Market size in 2025: xx Million; Competitive Dynamics: High), and Other Material Types (Growth projection: xx%; Market size in 2025: xx Million; Competitive Dynamics: Moderate).
Key Drivers of USA Plastic Packaging Industry Growth
The USA plastic packaging industry's growth is driven by several factors: the rising demand for packaged goods, advancements in packaging technology, the growing e-commerce sector, and increasing consumer preference for convenience. Furthermore, government initiatives promoting sustainable packaging and the expansion of the food and beverage industry provide further impetus to market growth. Finally, the development of lightweight, high-barrier materials contributes to reduced transportation costs and improved product shelf life.
Challenges in the USA Plastic Packaging Industry Sector
The industry faces challenges, including the stringent regulations regarding plastic waste management, fluctuating raw material prices, and the growing environmental concerns associated with plastic pollution. Supply chain disruptions and intense competition among established players also pose significant hurdles. These challenges lead to increased production costs and necessitate continuous innovation to maintain competitiveness. The estimated negative impact of these challenges on market growth in 2025 is estimated at xx Million.
Emerging Opportunities in USA Plastic Packaging Industry
Emerging opportunities include the growing demand for sustainable and eco-friendly packaging solutions, the rise of smart packaging technologies, and the expanding e-commerce sector driving innovation in packaging materials and designs. The increasing focus on personalized packaging and the development of new barrier materials to extend product shelf life also offer lucrative opportunities for market players. Further growth potential exists in niche markets and applications requiring specialized packaging solutions.
Leading Players in the USA Plastic Packaging Industry Market
- Proampac LLC
- Sonoco Products Company
- Alpha Packaging Inc
- Cascades Flexible Packaging
- Bericap Holdings
- Amcor PLC
- Silgan Closures
- Constantia Flexibles
- Albea SA
- Berry Global Inc
- Centor Inc (Gerresheimer)
- Sealed Air Corporation
- Sigma Plastics Group Inc
Key Developments in USA Plastic Packaging Industry Industry
- June 2021: BERICAP acquired Mala Verschluss-Systeme GmbH, expanding its aluminum closure offerings. This acquisition broadened its product portfolio and enhanced its position in the market.
- March 2021: ProAmpac's acquisition of IG Industries PLC and Brayford Plastics Ltd. expanded its presence in the UK flexible packaging market, bolstering its product range and market share.
Strategic Outlook for USA Plastic Packaging Industry Market
The USA plastic packaging market is poised for continued growth, driven by innovation in sustainable materials, advancements in packaging technology, and the ever-growing demand for packaged goods. The focus on eco-friendly solutions and enhanced supply chain efficiency will be key strategic factors for market success. Companies that invest in R&D, adopt sustainable practices, and strategically navigate regulatory challenges are expected to thrive in the years to come. The overall market is projected to show robust growth, with opportunities for both established players and new entrants to capture market share.
USA Plastic Packaging Industry Segmentation
-
1. End-user Industry
- 1.1. Food
- 1.2. Beverage
- 1.3. Pharmaceutical
- 1.4. Cosmetics and Personal Care
- 1.5. Other End-user Industries
-
2. Material Type
- 2.1. PE (Polyethylene)
- 2.2. PP (Polypropylene)
- 2.3. PVC (Poly Vinyl Chloride)
- 2.4. PET (Polyethylene Terephthalate)
- 2.5. Other Material Types
-
3. Type
- 3.1. Rigid Plastic Packaging
- 3.2. Flexible Plastic Packaging
USA Plastic Packaging Industry Segmentation By Geography
-
1. North America
- 1.1. United States
- 1.2. Canada
- 1.3. Mexico
-
2. South America
- 2.1. Brazil
- 2.2. Argentina
- 2.3. Rest of South America
-
3. Europe
- 3.1. United Kingdom
- 3.2. Germany
- 3.3. France
- 3.4. Italy
- 3.5. Spain
- 3.6. Russia
- 3.7. Benelux
- 3.8. Nordics
- 3.9. Rest of Europe
-
4. Middle East & Africa
- 4.1. Turkey
- 4.2. Israel
- 4.3. GCC
- 4.4. North Africa
- 4.5. South Africa
- 4.6. Rest of Middle East & Africa
-
5. Asia Pacific
- 5.1. China
- 5.2. India
- 5.3. Japan
- 5.4. South Korea
- 5.5. ASEAN
- 5.6. Oceania
- 5.7. Rest of Asia Pacific
USA Plastic Packaging Industry REPORT HIGHLIGHTS
| Aspects | Details |
|---|---|
| Study Period | 2019-2033 |
| Base Year | 2024 |
| Estimated Year | 2025 |
| Forecast Period | 2025-2033 |
| Historical Period | 2019-2024 |
| Growth Rate | CAGR of 3.20% from 2019-2033 |
| Segmentation |
|
Table of Contents
- 1. Introduction
- 1.1. Research Scope
- 1.2. Market Segmentation
- 1.3. Research Methodology
- 1.4. Definitions and Assumptions
- 2. Executive Summary
- 2.1. Introduction
- 3. Market Dynamics
- 3.1. Introduction
- 3.2. Market Drivers
- 3.2.1 Increased Demand for Flexible Plastic Packaging Solutions Across End-user Industries; Growth in End-user Industries
- 3.2.2 such as Food and Beverage and Pharmaceuticals; Increasing Demand for Sustainable and Innovative Food Packaging Products
- 3.3. Market Restrains
- 3.3.1. Increasing Price Volatility of Raw Materials
- 3.4. Market Trends
- 3.4.1. Pharmaceutical Industry to Drive the Demand for the Market
- 4. Market Factor Analysis
- 4.1. Porters Five Forces
- 4.2. Supply/Value Chain
- 4.3. PESTEL analysis
- 4.4. Market Entropy
- 4.5. Patent/Trademark Analysis
- 5. Global USA Plastic Packaging Industry Analysis, Insights and Forecast, 2019-2031
- 5.1. Market Analysis, Insights and Forecast - by End-user Industry
- 5.1.1. Food
- 5.1.2. Beverage
- 5.1.3. Pharmaceutical
- 5.1.4. Cosmetics and Personal Care
- 5.1.5. Other End-user Industries
- 5.2. Market Analysis, Insights and Forecast - by Material Type
- 5.2.1. PE (Polyethylene)
- 5.2.2. PP (Polypropylene)
- 5.2.3. PVC (Poly Vinyl Chloride)
- 5.2.4. PET (Polyethylene Terephthalate)
- 5.2.5. Other Material Types
- 5.3. Market Analysis, Insights and Forecast - by Type
- 5.3.1. Rigid Plastic Packaging
- 5.3.2. Flexible Plastic Packaging
- 5.4. Market Analysis, Insights and Forecast - by Region
- 5.4.1. North America
- 5.4.2. South America
- 5.4.3. Europe
- 5.4.4. Middle East & Africa
- 5.4.5. Asia Pacific
- 5.1. Market Analysis, Insights and Forecast - by End-user Industry
- 6. North America USA Plastic Packaging Industry Analysis, Insights and Forecast, 2019-2031
- 6.1. Market Analysis, Insights and Forecast - by End-user Industry
- 6.1.1. Food
- 6.1.2. Beverage
- 6.1.3. Pharmaceutical
- 6.1.4. Cosmetics and Personal Care
- 6.1.5. Other End-user Industries
- 6.2. Market Analysis, Insights and Forecast - by Material Type
- 6.2.1. PE (Polyethylene)
- 6.2.2. PP (Polypropylene)
- 6.2.3. PVC (Poly Vinyl Chloride)
- 6.2.4. PET (Polyethylene Terephthalate)
- 6.2.5. Other Material Types
- 6.3. Market Analysis, Insights and Forecast - by Type
- 6.3.1. Rigid Plastic Packaging
- 6.3.2. Flexible Plastic Packaging
- 6.1. Market Analysis, Insights and Forecast - by End-user Industry
- 7. South America USA Plastic Packaging Industry Analysis, Insights and Forecast, 2019-2031
- 7.1. Market Analysis, Insights and Forecast - by End-user Industry
- 7.1.1. Food
- 7.1.2. Beverage
- 7.1.3. Pharmaceutical
- 7.1.4. Cosmetics and Personal Care
- 7.1.5. Other End-user Industries
- 7.2. Market Analysis, Insights and Forecast - by Material Type
- 7.2.1. PE (Polyethylene)
- 7.2.2. PP (Polypropylene)
- 7.2.3. PVC (Poly Vinyl Chloride)
- 7.2.4. PET (Polyethylene Terephthalate)
- 7.2.5. Other Material Types
- 7.3. Market Analysis, Insights and Forecast - by Type
- 7.3.1. Rigid Plastic Packaging
- 7.3.2. Flexible Plastic Packaging
- 7.1. Market Analysis, Insights and Forecast - by End-user Industry
- 8. Europe USA Plastic Packaging Industry Analysis, Insights and Forecast, 2019-2031
- 8.1. Market Analysis, Insights and Forecast - by End-user Industry
- 8.1.1. Food
- 8.1.2. Beverage
- 8.1.3. Pharmaceutical
- 8.1.4. Cosmetics and Personal Care
- 8.1.5. Other End-user Industries
- 8.2. Market Analysis, Insights and Forecast - by Material Type
- 8.2.1. PE (Polyethylene)
- 8.2.2. PP (Polypropylene)
- 8.2.3. PVC (Poly Vinyl Chloride)
- 8.2.4. PET (Polyethylene Terephthalate)
- 8.2.5. Other Material Types
- 8.3. Market Analysis, Insights and Forecast - by Type
- 8.3.1. Rigid Plastic Packaging
- 8.3.2. Flexible Plastic Packaging
- 8.1. Market Analysis, Insights and Forecast - by End-user Industry
- 9. Middle East & Africa USA Plastic Packaging Industry Analysis, Insights and Forecast, 2019-2031
- 9.1. Market Analysis, Insights and Forecast - by End-user Industry
- 9.1.1. Food
- 9.1.2. Beverage
- 9.1.3. Pharmaceutical
- 9.1.4. Cosmetics and Personal Care
- 9.1.5. Other End-user Industries
- 9.2. Market Analysis, Insights and Forecast - by Material Type
- 9.2.1. PE (Polyethylene)
- 9.2.2. PP (Polypropylene)
- 9.2.3. PVC (Poly Vinyl Chloride)
- 9.2.4. PET (Polyethylene Terephthalate)
- 9.2.5. Other Material Types
- 9.3. Market Analysis, Insights and Forecast - by Type
- 9.3.1. Rigid Plastic Packaging
- 9.3.2. Flexible Plastic Packaging
- 9.1. Market Analysis, Insights and Forecast - by End-user Industry
- 10. Asia Pacific USA Plastic Packaging Industry Analysis, Insights and Forecast, 2019-2031
- 10.1. Market Analysis, Insights and Forecast - by End-user Industry
- 10.1.1. Food
- 10.1.2. Beverage
- 10.1.3. Pharmaceutical
- 10.1.4. Cosmetics and Personal Care
- 10.1.5. Other End-user Industries
- 10.2. Market Analysis, Insights and Forecast - by Material Type
- 10.2.1. PE (Polyethylene)
- 10.2.2. PP (Polypropylene)
- 10.2.3. PVC (Poly Vinyl Chloride)
- 10.2.4. PET (Polyethylene Terephthalate)
- 10.2.5. Other Material Types
- 10.3. Market Analysis, Insights and Forecast - by Type
- 10.3.1. Rigid Plastic Packaging
- 10.3.2. Flexible Plastic Packaging
- 10.1. Market Analysis, Insights and Forecast - by End-user Industry
- 11. Northeast USA Plastic Packaging Industry Analysis, Insights and Forecast, 2019-2031
- 12. Southeast USA Plastic Packaging Industry Analysis, Insights and Forecast, 2019-2031
- 13. Midwest USA Plastic Packaging Industry Analysis, Insights and Forecast, 2019-2031
- 14. Southwest USA Plastic Packaging Industry Analysis, Insights and Forecast, 2019-2031
- 15. West USA Plastic Packaging Industry Analysis, Insights and Forecast, 2019-2031
- 16. Competitive Analysis
- 16.1. Global Market Share Analysis 2024
- 16.2. Company Profiles
- 16.2.1 Proampac LLC
- 16.2.1.1. Overview
- 16.2.1.2. Products
- 16.2.1.3. SWOT Analysis
- 16.2.1.4. Recent Developments
- 16.2.1.5. Financials (Based on Availability)
- 16.2.2 Sonoco Products Company
- 16.2.2.1. Overview
- 16.2.2.2. Products
- 16.2.2.3. SWOT Analysis
- 16.2.2.4. Recent Developments
- 16.2.2.5. Financials (Based on Availability)
- 16.2.3 Alpha Packaging Inc
- 16.2.3.1. Overview
- 16.2.3.2. Products
- 16.2.3.3. SWOT Analysis
- 16.2.3.4. Recent Developments
- 16.2.3.5. Financials (Based on Availability)
- 16.2.4 Cascades Flexible Packaging
- 16.2.4.1. Overview
- 16.2.4.2. Products
- 16.2.4.3. SWOT Analysis
- 16.2.4.4. Recent Developments
- 16.2.4.5. Financials (Based on Availability)
- 16.2.5 Bericap Holdings*List Not Exhaustive
- 16.2.5.1. Overview
- 16.2.5.2. Products
- 16.2.5.3. SWOT Analysis
- 16.2.5.4. Recent Developments
- 16.2.5.5. Financials (Based on Availability)
- 16.2.6 Amcor PLC
- 16.2.6.1. Overview
- 16.2.6.2. Products
- 16.2.6.3. SWOT Analysis
- 16.2.6.4. Recent Developments
- 16.2.6.5. Financials (Based on Availability)
- 16.2.7 Silgan Closures
- 16.2.7.1. Overview
- 16.2.7.2. Products
- 16.2.7.3. SWOT Analysis
- 16.2.7.4. Recent Developments
- 16.2.7.5. Financials (Based on Availability)
- 16.2.8 Constantia Flexibles
- 16.2.8.1. Overview
- 16.2.8.2. Products
- 16.2.8.3. SWOT Analysis
- 16.2.8.4. Recent Developments
- 16.2.8.5. Financials (Based on Availability)
- 16.2.9 Albea SA
- 16.2.9.1. Overview
- 16.2.9.2. Products
- 16.2.9.3. SWOT Analysis
- 16.2.9.4. Recent Developments
- 16.2.9.5. Financials (Based on Availability)
- 16.2.10 Berry Global Inc
- 16.2.10.1. Overview
- 16.2.10.2. Products
- 16.2.10.3. SWOT Analysis
- 16.2.10.4. Recent Developments
- 16.2.10.5. Financials (Based on Availability)
- 16.2.11 Centor Inc (Gerresheimer)
- 16.2.11.1. Overview
- 16.2.11.2. Products
- 16.2.11.3. SWOT Analysis
- 16.2.11.4. Recent Developments
- 16.2.11.5. Financials (Based on Availability)
- 16.2.12 Sealed Air Corporation
- 16.2.12.1. Overview
- 16.2.12.2. Products
- 16.2.12.3. SWOT Analysis
- 16.2.12.4. Recent Developments
- 16.2.12.5. Financials (Based on Availability)
- 16.2.13 Sigma Plastics Group Inc
- 16.2.13.1. Overview
- 16.2.13.2. Products
- 16.2.13.3. SWOT Analysis
- 16.2.13.4. Recent Developments
- 16.2.13.5. Financials (Based on Availability)
- 16.2.1 Proampac LLC
List of Figures
- Figure 1: Global USA Plastic Packaging Industry Revenue Breakdown (Million, %) by Region 2024 & 2032
- Figure 2: United states USA Plastic Packaging Industry Revenue (Million), by Country 2024 & 2032
- Figure 3: United states USA Plastic Packaging Industry Revenue Share (%), by Country 2024 & 2032
- Figure 4: North America USA Plastic Packaging Industry Revenue (Million), by End-user Industry 2024 & 2032
- Figure 5: North America USA Plastic Packaging Industry Revenue Share (%), by End-user Industry 2024 & 2032
- Figure 6: North America USA Plastic Packaging Industry Revenue (Million), by Material Type 2024 & 2032
- Figure 7: North America USA Plastic Packaging Industry Revenue Share (%), by Material Type 2024 & 2032
- Figure 8: North America USA Plastic Packaging Industry Revenue (Million), by Type 2024 & 2032
- Figure 9: North America USA Plastic Packaging Industry Revenue Share (%), by Type 2024 & 2032
- Figure 10: North America USA Plastic Packaging Industry Revenue (Million), by Country 2024 & 2032
- Figure 11: North America USA Plastic Packaging Industry Revenue Share (%), by Country 2024 & 2032
- Figure 12: South America USA Plastic Packaging Industry Revenue (Million), by End-user Industry 2024 & 2032
- Figure 13: South America USA Plastic Packaging Industry Revenue Share (%), by End-user Industry 2024 & 2032
- Figure 14: South America USA Plastic Packaging Industry Revenue (Million), by Material Type 2024 & 2032
- Figure 15: South America USA Plastic Packaging Industry Revenue Share (%), by Material Type 2024 & 2032
- Figure 16: South America USA Plastic Packaging Industry Revenue (Million), by Type 2024 & 2032
- Figure 17: South America USA Plastic Packaging Industry Revenue Share (%), by Type 2024 & 2032
- Figure 18: South America USA Plastic Packaging Industry Revenue (Million), by Country 2024 & 2032
- Figure 19: South America USA Plastic Packaging Industry Revenue Share (%), by Country 2024 & 2032
- Figure 20: Europe USA Plastic Packaging Industry Revenue (Million), by End-user Industry 2024 & 2032
- Figure 21: Europe USA Plastic Packaging Industry Revenue Share (%), by End-user Industry 2024 & 2032
- Figure 22: Europe USA Plastic Packaging Industry Revenue (Million), by Material Type 2024 & 2032
- Figure 23: Europe USA Plastic Packaging Industry Revenue Share (%), by Material Type 2024 & 2032
- Figure 24: Europe USA Plastic Packaging Industry Revenue (Million), by Type 2024 & 2032
- Figure 25: Europe USA Plastic Packaging Industry Revenue Share (%), by Type 2024 & 2032
- Figure 26: Europe USA Plastic Packaging Industry Revenue (Million), by Country 2024 & 2032
- Figure 27: Europe USA Plastic Packaging Industry Revenue Share (%), by Country 2024 & 2032
- Figure 28: Middle East & Africa USA Plastic Packaging Industry Revenue (Million), by End-user Industry 2024 & 2032
- Figure 29: Middle East & Africa USA Plastic Packaging Industry Revenue Share (%), by End-user Industry 2024 & 2032
- Figure 30: Middle East & Africa USA Plastic Packaging Industry Revenue (Million), by Material Type 2024 & 2032
- Figure 31: Middle East & Africa USA Plastic Packaging Industry Revenue Share (%), by Material Type 2024 & 2032
- Figure 32: Middle East & Africa USA Plastic Packaging Industry Revenue (Million), by Type 2024 & 2032
- Figure 33: Middle East & Africa USA Plastic Packaging Industry Revenue Share (%), by Type 2024 & 2032
- Figure 34: Middle East & Africa USA Plastic Packaging Industry Revenue (Million), by Country 2024 & 2032
- Figure 35: Middle East & Africa USA Plastic Packaging Industry Revenue Share (%), by Country 2024 & 2032
- Figure 36: Asia Pacific USA Plastic Packaging Industry Revenue (Million), by End-user Industry 2024 & 2032
- Figure 37: Asia Pacific USA Plastic Packaging Industry Revenue Share (%), by End-user Industry 2024 & 2032
- Figure 38: Asia Pacific USA Plastic Packaging Industry Revenue (Million), by Material Type 2024 & 2032
- Figure 39: Asia Pacific USA Plastic Packaging Industry Revenue Share (%), by Material Type 2024 & 2032
- Figure 40: Asia Pacific USA Plastic Packaging Industry Revenue (Million), by Type 2024 & 2032
- Figure 41: Asia Pacific USA Plastic Packaging Industry Revenue Share (%), by Type 2024 & 2032
- Figure 42: Asia Pacific USA Plastic Packaging Industry Revenue (Million), by Country 2024 & 2032
- Figure 43: Asia Pacific USA Plastic Packaging Industry Revenue Share (%), by Country 2024 & 2032
List of Tables
- Table 1: Global USA Plastic Packaging Industry Revenue Million Forecast, by Region 2019 & 2032
- Table 2: Global USA Plastic Packaging Industry Revenue Million Forecast, by End-user Industry 2019 & 2032
- Table 3: Global USA Plastic Packaging Industry Revenue Million Forecast, by Material Type 2019 & 2032
- Table 4: Global USA Plastic Packaging Industry Revenue Million Forecast, by Type 2019 & 2032
- Table 5: Global USA Plastic Packaging Industry Revenue Million Forecast, by Region 2019 & 2032
- Table 6: Global USA Plastic Packaging Industry Revenue Million Forecast, by Country 2019 & 2032
- Table 7: Northeast USA Plastic Packaging Industry Revenue (Million) Forecast, by Application 2019 & 2032
- Table 8: Southeast USA Plastic Packaging Industry Revenue (Million) Forecast, by Application 2019 & 2032
- Table 9: Midwest USA Plastic Packaging Industry Revenue (Million) Forecast, by Application 2019 & 2032
- Table 10: Southwest USA Plastic Packaging Industry Revenue (Million) Forecast, by Application 2019 & 2032
- Table 11: West USA Plastic Packaging Industry Revenue (Million) Forecast, by Application 2019 & 2032
- Table 12: Global USA Plastic Packaging Industry Revenue Million Forecast, by End-user Industry 2019 & 2032
- Table 13: Global USA Plastic Packaging Industry Revenue Million Forecast, by Material Type 2019 & 2032
- Table 14: Global USA Plastic Packaging Industry Revenue Million Forecast, by Type 2019 & 2032
- Table 15: Global USA Plastic Packaging Industry Revenue Million Forecast, by Country 2019 & 2032
- Table 16: United States USA Plastic Packaging Industry Revenue (Million) Forecast, by Application 2019 & 2032
- Table 17: Canada USA Plastic Packaging Industry Revenue (Million) Forecast, by Application 2019 & 2032
- Table 18: Mexico USA Plastic Packaging Industry Revenue (Million) Forecast, by Application 2019 & 2032
- Table 19: Global USA Plastic Packaging Industry Revenue Million Forecast, by End-user Industry 2019 & 2032
- Table 20: Global USA Plastic Packaging Industry Revenue Million Forecast, by Material Type 2019 & 2032
- Table 21: Global USA Plastic Packaging Industry Revenue Million Forecast, by Type 2019 & 2032
- Table 22: Global USA Plastic Packaging Industry Revenue Million Forecast, by Country 2019 & 2032
- Table 23: Brazil USA Plastic Packaging Industry Revenue (Million) Forecast, by Application 2019 & 2032
- Table 24: Argentina USA Plastic Packaging Industry Revenue (Million) Forecast, by Application 2019 & 2032
- Table 25: Rest of South America USA Plastic Packaging Industry Revenue (Million) Forecast, by Application 2019 & 2032
- Table 26: Global USA Plastic Packaging Industry Revenue Million Forecast, by End-user Industry 2019 & 2032
- Table 27: Global USA Plastic Packaging Industry Revenue Million Forecast, by Material Type 2019 & 2032
- Table 28: Global USA Plastic Packaging Industry Revenue Million Forecast, by Type 2019 & 2032
- Table 29: Global USA Plastic Packaging Industry Revenue Million Forecast, by Country 2019 & 2032
- Table 30: United Kingdom USA Plastic Packaging Industry Revenue (Million) Forecast, by Application 2019 & 2032
- Table 31: Germany USA Plastic Packaging Industry Revenue (Million) Forecast, by Application 2019 & 2032
- Table 32: France USA Plastic Packaging Industry Revenue (Million) Forecast, by Application 2019 & 2032
- Table 33: Italy USA Plastic Packaging Industry Revenue (Million) Forecast, by Application 2019 & 2032
- Table 34: Spain USA Plastic Packaging Industry Revenue (Million) Forecast, by Application 2019 & 2032
- Table 35: Russia USA Plastic Packaging Industry Revenue (Million) Forecast, by Application 2019 & 2032
- Table 36: Benelux USA Plastic Packaging Industry Revenue (Million) Forecast, by Application 2019 & 2032
- Table 37: Nordics USA Plastic Packaging Industry Revenue (Million) Forecast, by Application 2019 & 2032
- Table 38: Rest of Europe USA Plastic Packaging Industry Revenue (Million) Forecast, by Application 2019 & 2032
- Table 39: Global USA Plastic Packaging Industry Revenue Million Forecast, by End-user Industry 2019 & 2032
- Table 40: Global USA Plastic Packaging Industry Revenue Million Forecast, by Material Type 2019 & 2032
- Table 41: Global USA Plastic Packaging Industry Revenue Million Forecast, by Type 2019 & 2032
- Table 42: Global USA Plastic Packaging Industry Revenue Million Forecast, by Country 2019 & 2032
- Table 43: Turkey USA Plastic Packaging Industry Revenue (Million) Forecast, by Application 2019 & 2032
- Table 44: Israel USA Plastic Packaging Industry Revenue (Million) Forecast, by Application 2019 & 2032
- Table 45: GCC USA Plastic Packaging Industry Revenue (Million) Forecast, by Application 2019 & 2032
- Table 46: North Africa USA Plastic Packaging Industry Revenue (Million) Forecast, by Application 2019 & 2032
- Table 47: South Africa USA Plastic Packaging Industry Revenue (Million) Forecast, by Application 2019 & 2032
- Table 48: Rest of Middle East & Africa USA Plastic Packaging Industry Revenue (Million) Forecast, by Application 2019 & 2032
- Table 49: Global USA Plastic Packaging Industry Revenue Million Forecast, by End-user Industry 2019 & 2032
- Table 50: Global USA Plastic Packaging Industry Revenue Million Forecast, by Material Type 2019 & 2032
- Table 51: Global USA Plastic Packaging Industry Revenue Million Forecast, by Type 2019 & 2032
- Table 52: Global USA Plastic Packaging Industry Revenue Million Forecast, by Country 2019 & 2032
- Table 53: China USA Plastic Packaging Industry Revenue (Million) Forecast, by Application 2019 & 2032
- Table 54: India USA Plastic Packaging Industry Revenue (Million) Forecast, by Application 2019 & 2032
- Table 55: Japan USA Plastic Packaging Industry Revenue (Million) Forecast, by Application 2019 & 2032
- Table 56: South Korea USA Plastic Packaging Industry Revenue (Million) Forecast, by Application 2019 & 2032
- Table 57: ASEAN USA Plastic Packaging Industry Revenue (Million) Forecast, by Application 2019 & 2032
- Table 58: Oceania USA Plastic Packaging Industry Revenue (Million) Forecast, by Application 2019 & 2032
- Table 59: Rest of Asia Pacific USA Plastic Packaging Industry Revenue (Million) Forecast, by Application 2019 & 2032
Frequently Asked Questions
1. What is the projected Compound Annual Growth Rate (CAGR) of the USA Plastic Packaging Industry?
The projected CAGR is approximately 3.20%.
2. Which companies are prominent players in the USA Plastic Packaging Industry?
Key companies in the market include Proampac LLC, Sonoco Products Company, Alpha Packaging Inc, Cascades Flexible Packaging, Bericap Holdings*List Not Exhaustive, Amcor PLC, Silgan Closures, Constantia Flexibles, Albea SA, Berry Global Inc, Centor Inc (Gerresheimer), Sealed Air Corporation, Sigma Plastics Group Inc.
3. What are the main segments of the USA Plastic Packaging Industry?
The market segments include End-user Industry, Material Type, Type.
4. Can you provide details about the market size?
The market size is estimated to be USD XX Million as of 2022.
5. What are some drivers contributing to market growth?
Increased Demand for Flexible Plastic Packaging Solutions Across End-user Industries; Growth in End-user Industries. such as Food and Beverage and Pharmaceuticals; Increasing Demand for Sustainable and Innovative Food Packaging Products.
6. What are the notable trends driving market growth?
Pharmaceutical Industry to Drive the Demand for the Market.
7. Are there any restraints impacting market growth?
Increasing Price Volatility of Raw Materials.
8. Can you provide examples of recent developments in the market?
June 2021: BERICAP, one of the world's top producers of plastic closures, has acquired Mala Verschluss-Systeme GmbH, expanding its product line to include aluminum closures. Mala is a Thuringian family business situated in Bad Liebenstein. It earned 40 million euros in yearly revenue in 2020 from the production and sale of aluminum screw cap closures for spirits, wine, and non-alcoholic beverages.
9. What pricing options are available for accessing the report?
Pricing options include single-user, multi-user, and enterprise licenses priced at USD 3800, USD 4500, and USD 5800 respectively.
10. Is the market size provided in terms of value or volume?
The market size is provided in terms of value, measured in Million.
11. Are there any specific market keywords associated with the report?
Yes, the market keyword associated with the report is "USA Plastic Packaging Industry," which aids in identifying and referencing the specific market segment covered.
12. How do I determine which pricing option suits my needs best?
The pricing options vary based on user requirements and access needs. Individual users may opt for single-user licenses, while businesses requiring broader access may choose multi-user or enterprise licenses for cost-effective access to the report.
13. Are there any additional resources or data provided in the USA Plastic Packaging Industry report?
While the report offers comprehensive insights, it's advisable to review the specific contents or supplementary materials provided to ascertain if additional resources or data are available.
14. How can I stay updated on further developments or reports in the USA Plastic Packaging Industry?
To stay informed about further developments, trends, and reports in the USA Plastic Packaging Industry, consider subscribing to industry newsletters, following relevant companies and organizations, or regularly checking reputable industry news sources and publications.
Methodology
Step 1 - Identification of Relevant Samples Size from Population Database


Step 2 - Approaches for Defining Global Market Size (Value, Volume* & Price*)

Note*: In applicable scenarios
Step 3 - Data Sources
Primary Research
- Web Analytics
- Survey Reports
- Research Institute
- Latest Research Reports
- Opinion Leaders
Secondary Research
- Annual Reports
- White Paper
- Latest Press Release
- Industry Association
- Paid Database
- Investor Presentations

Step 4 - Data Triangulation
Involves using different sources of information in order to increase the validity of a study
These sources are likely to be stakeholders in a program - participants, other researchers, program staff, other community members, and so on.
Then we put all data in single framework & apply various statistical tools to find out the dynamic on the market.
During the analysis stage, feedback from the stakeholder groups would be compared to determine areas of agreement as well as areas of divergence


