
Key Insights
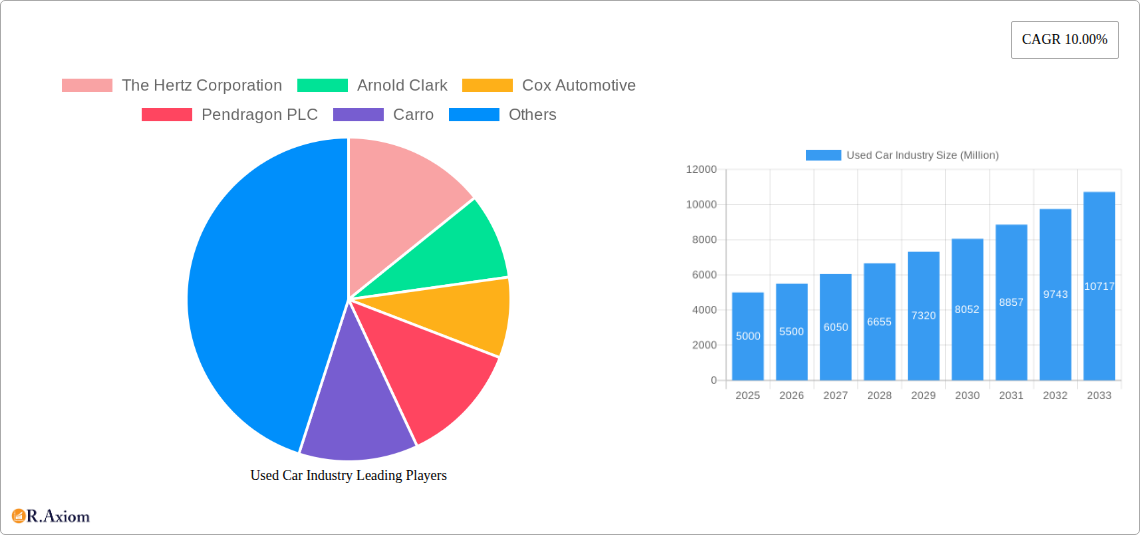
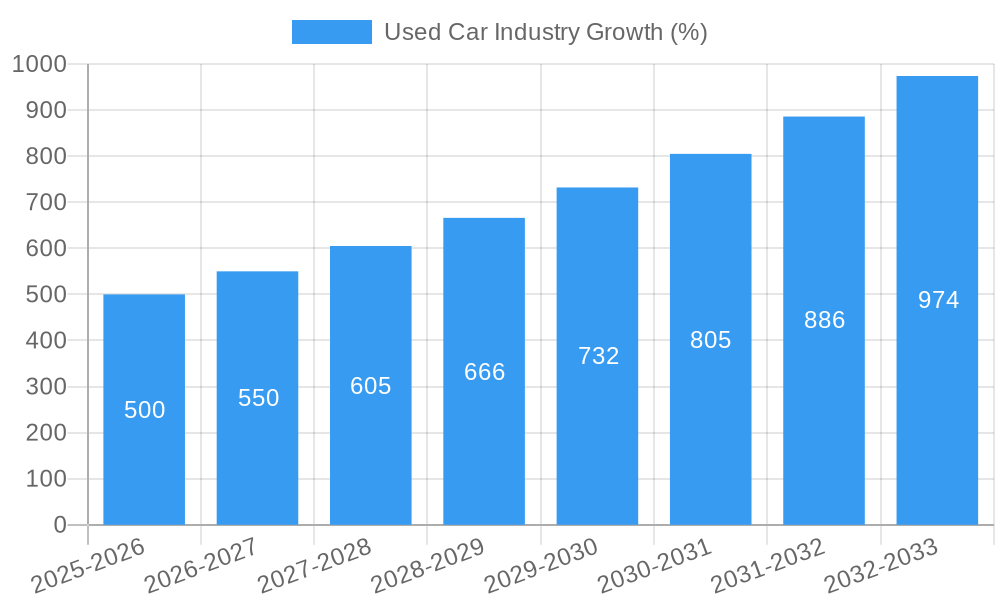
The used car market, a significant segment of the global automotive industry, is experiencing robust growth, projected to maintain a Compound Annual Growth Rate (CAGR) of 10% from 2025 to 2033. This expansion is driven by several key factors. Increasing vehicle affordability compared to new cars, particularly in the face of rising inflation and interest rates, is a major catalyst. The growing preference for pre-owned vehicles among budget-conscious consumers fuels this demand. Furthermore, advancements in vehicle technology and improved reliability of used cars are increasing consumer confidence. The rise of online platforms and organized used car dealerships has enhanced transparency and convenience, facilitating smoother transactions and boosting market penetration. Segment-wise, SUVs and MPVs are witnessing the highest growth, reflecting shifting consumer preferences towards larger and more versatile vehicles. The organized sector is steadily gaining market share, driven by increased consumer trust and improved service offerings. Geographic regions are exhibiting varied growth trajectories, with North America and Asia-Pacific expected to lead, fueled by substantial consumer bases and economic growth in these areas.
The competitive landscape is characterized by a mix of established global players like Hertz, Cox Automotive, and CarMax, alongside regional and national dealerships. These businesses are adapting to the evolving market dynamics by investing in digital platforms, improving inventory management, and offering value-added services like financing and warranties. However, challenges such as fluctuating used car prices due to supply chain disruptions and economic uncertainties remain. The unorganized sector still presents a significant portion of the market, posing both an opportunity and a challenge for organized players to consolidate and formalize the market. Future growth will hinge on the ability of companies to leverage technology, build trust, and offer customized solutions to meet the diverse needs of consumers across different geographical regions and vehicle segments. The forecast period (2025-2033) presents significant opportunities for expansion and innovation within the used car industry.
Used Car Industry: Market Analysis and Forecast 2019-2033
This comprehensive report provides an in-depth analysis of the global used car industry, covering market size, segmentation, key players, growth drivers, challenges, and future outlook. The study period spans from 2019 to 2033, with 2025 serving as the base and estimated year. The report offers actionable insights for industry stakeholders, including manufacturers, dealers, investors, and policymakers. The total market value is estimated to reach xx Million by 2033.
Used Car Industry Market Concentration & Innovation
This section analyzes the competitive landscape of the used car industry, focusing on market concentration, innovation, regulatory aspects, and M&A activities. The industry is characterized by a mix of large multinational corporations and smaller regional players. Key players such as The Hertz Corporation, Arnold Clark, Cox Automotive, Pendragon PLC, Carro, AutoNation, Asbury Automotive Group, Mahindra First Choice Wheels, Penske Cars, CarMax Inc, Maruti Suzuki True Value, and Emil Frey AG, each hold significant market share, but the overall market exhibits a moderate level of concentration. Market share fluctuations during the historical period (2019-2024) are primarily driven by M&A activity and shifts in consumer preferences. Deal values for significant M&A transactions exceeded xx Million in several instances during the study period.
- Market Concentration: The industry shows a moderately consolidated structure with a few dominant players and a large number of smaller independent dealers. The Herfindahl-Hirschman Index (HHI) is estimated at xx in 2024.
- Innovation Drivers: Technological advancements, such as online marketplaces and digital inspection tools, are significantly impacting industry operations. Consumer demand for convenience and transparency drives innovation.
- Regulatory Frameworks: Government regulations regarding emissions, safety standards, and data privacy influence market dynamics. Varying regulatory frameworks across different regions create diverse operational environments.
- Product Substitutes: Public transportation and ride-sharing services offer alternatives to car ownership, impacting demand for used vehicles, particularly in urban areas.
- End-User Trends: Growing preference for SUVs and crossovers, along with increasing demand for certified pre-owned vehicles, shapes market trends. Sustainability concerns are influencing the adoption of electric and hybrid vehicles.
- M&A Activities: Significant mergers and acquisitions have occurred, particularly among larger players seeking expansion and market consolidation. Total M&A deal value for 2019-2024 exceeded xx Million.
Used Car Industry Industry Trends & Insights
The used car market exhibits robust growth driven by several factors. Rising disposable incomes in developing economies and the increasing affordability of used vehicles fuel demand. The industry has witnessed a Compound Annual Growth Rate (CAGR) of xx% during the historical period (2019-2024), and this growth is projected to continue throughout the forecast period (2025-2033), although at a slightly lower CAGR of xx%. The market penetration of online platforms is steadily increasing, impacting both sales and customer experience. Technological disruptions, such as online marketplaces and AI-powered valuation tools, are transforming traditional sales processes and improving efficiency. Consumer preferences are shifting toward vehicles with advanced safety features and better fuel economy. Competitive dynamics are intensifying, particularly among organized and unorganized vendors. The introduction of new technologies and business models has also altered the overall competitive landscape of the market. The average transaction price of a used car increased by xx% between 2019 and 2024.
Dominant Markets & Segments in Used Car Industry
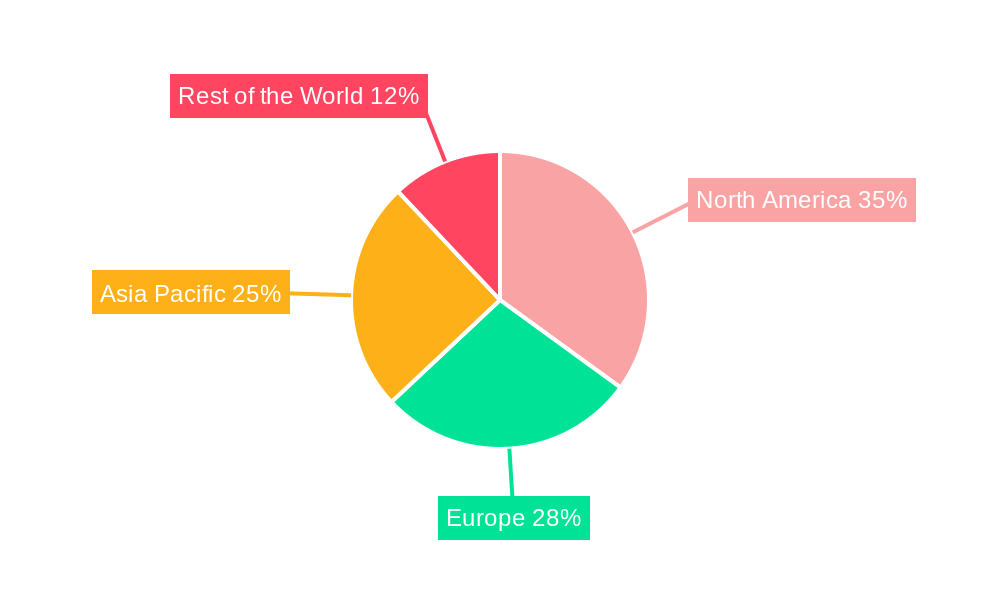
The used car market displays regional variations in dominance. North America and Europe historically dominate the market, driven by established automotive industries and robust consumer demand. However, Asia-Pacific is rapidly emerging as a key region with significant growth potential due to increasing urbanization and rising disposable incomes.
By Vehicle Type:
- SUVs and MPVs show the highest growth, reflecting consumer preferences for spacious and versatile vehicles.
- Hatchbacks and Sedans continue to maintain significant market share but are facing slower growth compared to SUVs and MPVs.
By Vendor:
- The organized sector, characterized by established dealerships and large online platforms, is growing rapidly, driven by increasing consumer preference for transparency, warranty, and financing options.
- The unorganized sector still maintains a significant presence but is gradually losing market share to the organized sector.
Key Drivers:
- Economic growth and rising disposable incomes directly impact consumer purchasing power, driving demand.
- Government policies, such as tax incentives for used car purchases or regulations on vehicle emissions, can influence market growth.
- Infrastructure development, particularly in emerging markets, plays a vital role in improving accessibility to used car dealerships and online services.
Used Car Industry Product Developments
Recent product innovations have centered on improving the online buying experience, such as user-friendly websites and apps, virtual inspections, and AI-powered valuation tools. These innovations enhance transparency and convenience for consumers and improve efficiency for dealers. The integration of financing and insurance options within online platforms is another key development. Certified pre-owned programs with extended warranties are gaining popularity, addressing consumer concerns about used vehicle reliability.
Report Scope & Segmentation Analysis
This report segments the used car market by vehicle type (Hatchbacks, Sedans, SUVs, MPVs) and vendor type (Organized, Unorganized). Each segment is analyzed in terms of its market size, growth rate, and competitive landscape. The report includes detailed market size estimations for each segment for the historical period (2019-2024), base year (2025), and forecast period (2025-2033). The growth projections incorporate assumptions about economic growth, consumer preferences, and technological advancements. Competitive dynamics are analyzed for each segment based on the presence of major players and their market share.
Key Drivers of Used Car Industry Growth
Several factors are driving the growth of the used car market. Rising disposable incomes and affordability are key factors, especially in emerging economies. Technological advancements, such as online marketplaces and mobile apps, enhance convenience and transparency. Government regulations and policies related to vehicle safety and emissions standards also influence market dynamics. The growing popularity of Certified Pre-Owned vehicles (CPO) increases consumer confidence in the used car market.
Challenges in the Used Car Industry Sector
The used car industry faces various challenges, including fluctuations in used car prices influenced by new car production and supply chain issues. Regulatory hurdles related to emissions standards and data privacy present significant operational complexities. Increasing competition, especially from online marketplaces and established dealerships, puts pressure on profit margins for smaller independent dealers. The prevalence of fraudulent activities in the unorganized sector undermines consumer trust and requires robust regulatory measures. A lack of transparency in pricing and vehicle history can deter potential buyers.
Emerging Opportunities in Used Car Industry
Emerging trends offer promising opportunities. The increasing adoption of digital technologies provides avenues for enhanced efficiency and customer engagement. The growth of the subscription-based vehicle ownership models allows for greater accessibility to used vehicles. Expansion into emerging markets in Asia, Africa, and Latin America presents significant untapped potential. The demand for sustainable and fuel-efficient vehicles is opening up opportunities for specific vehicle types.
Leading Players in the Used Car Industry Market
- The Hertz Corporation
- Arnold Clark
- Cox Automotive
- Pendragon PLC
- Carro
- AutoNation
- Asbury Automotive Group
- Mahindra First Choice Wheels
- Penske Cars
- CarMax Inc
- Maruti Suzuki True Value
- Emil Frey AG
Key Developments in Used Car Industry Industry
- March 2022: TrueCar Inc. launched TrueCar+, a new online car-buying marketplace offering personalized car buying experiences.
- January 2022: General Motors launched Carvago, leveraging its used car inventory for online sales.
- September 2021: Mobil88 launched the Mo88i application, simplifying the buying and selling of used cars with integrated inspections and financing.
- March 2021: Penske Automotive Group Inc. adopted CarShop as its global brand for used vehicle SuperCenters.
Strategic Outlook for Used Car Industry Market
The used car market is poised for continued growth, fueled by rising demand, technological advancements, and expansion into emerging markets. The industry's strategic focus should be on enhancing online platforms, embracing sustainable vehicle options, and strengthening consumer trust through transparent pricing and vehicle history reports. Opportunities for consolidation and expansion into adjacent services, such as vehicle maintenance and insurance, are expected to shape the future of the used car industry.
Used Car Industry Segmentation
-
1. Vehicle Type
- 1.1. Hatchbacks
- 1.2. Sedan
- 1.3. Sports Utility Vehicles and Multi-Purpose Vehicles
-
2. Vendor
- 2.1. Organized
- 2.2. Unorganized
Used Car Industry Segmentation By Geography
-
1. North America
- 1.1. United States
- 1.2. Canada
- 1.3. Rest of North America
-
2. Europe
- 2.1. Germany
- 2.2. United Kingdom
- 2.3. France
- 2.4. Spain
- 2.5. Rest of Europe
-
3. Asia Pacific
- 3.1. China
- 3.2. India
- 3.3. Japan
- 3.4. South Korea
- 3.5. Rest of Asia Pacific
-
4. Rest of the World
- 4.1. Brazil
- 4.2. United Arab Emirates
- 4.3. South Africa
- 4.4. Other Countries
Used Car Industry REPORT HIGHLIGHTS
| Aspects | Details |
|---|---|
| Study Period | 2019-2033 |
| Base Year | 2024 |
| Estimated Year | 2025 |
| Forecast Period | 2025-2033 |
| Historical Period | 2019-2024 |
| Growth Rate | CAGR of 10.00% from 2019-2033 |
| Segmentation |
|
Table of Contents
- 1. Introduction
- 1.1. Research Scope
- 1.2. Market Segmentation
- 1.3. Research Methodology
- 1.4. Definitions and Assumptions
- 2. Executive Summary
- 2.1. Introduction
- 3. Market Dynamics
- 3.1. Introduction
- 3.2. Market Drivers
- 3.2.1. Increasing Demand For Electric School Buses
- 3.3. Market Restrains
- 3.3.1. Uncertainty of The Global Pandemic
- 3.4. Market Trends
- 3.4.1. Strengthening of Online Infrastructure Positively Affecting the Used Cars Market
- 4. Market Factor Analysis
- 4.1. Porters Five Forces
- 4.2. Supply/Value Chain
- 4.3. PESTEL analysis
- 4.4. Market Entropy
- 4.5. Patent/Trademark Analysis
- 5. Global Used Car Industry Analysis, Insights and Forecast, 2019-2031
- 5.1. Market Analysis, Insights and Forecast - by Vehicle Type
- 5.1.1. Hatchbacks
- 5.1.2. Sedan
- 5.1.3. Sports Utility Vehicles and Multi-Purpose Vehicles
- 5.2. Market Analysis, Insights and Forecast - by Vendor
- 5.2.1. Organized
- 5.2.2. Unorganized
- 5.3. Market Analysis, Insights and Forecast - by Region
- 5.3.1. North America
- 5.3.2. Europe
- 5.3.3. Asia Pacific
- 5.3.4. Rest of the World
- 5.1. Market Analysis, Insights and Forecast - by Vehicle Type
- 6. North America Used Car Industry Analysis, Insights and Forecast, 2019-2031
- 6.1. Market Analysis, Insights and Forecast - by Vehicle Type
- 6.1.1. Hatchbacks
- 6.1.2. Sedan
- 6.1.3. Sports Utility Vehicles and Multi-Purpose Vehicles
- 6.2. Market Analysis, Insights and Forecast - by Vendor
- 6.2.1. Organized
- 6.2.2. Unorganized
- 6.1. Market Analysis, Insights and Forecast - by Vehicle Type
- 7. Europe Used Car Industry Analysis, Insights and Forecast, 2019-2031
- 7.1. Market Analysis, Insights and Forecast - by Vehicle Type
- 7.1.1. Hatchbacks
- 7.1.2. Sedan
- 7.1.3. Sports Utility Vehicles and Multi-Purpose Vehicles
- 7.2. Market Analysis, Insights and Forecast - by Vendor
- 7.2.1. Organized
- 7.2.2. Unorganized
- 7.1. Market Analysis, Insights and Forecast - by Vehicle Type
- 8. Asia Pacific Used Car Industry Analysis, Insights and Forecast, 2019-2031
- 8.1. Market Analysis, Insights and Forecast - by Vehicle Type
- 8.1.1. Hatchbacks
- 8.1.2. Sedan
- 8.1.3. Sports Utility Vehicles and Multi-Purpose Vehicles
- 8.2. Market Analysis, Insights and Forecast - by Vendor
- 8.2.1. Organized
- 8.2.2. Unorganized
- 8.1. Market Analysis, Insights and Forecast - by Vehicle Type
- 9. Rest of the World Used Car Industry Analysis, Insights and Forecast, 2019-2031
- 9.1. Market Analysis, Insights and Forecast - by Vehicle Type
- 9.1.1. Hatchbacks
- 9.1.2. Sedan
- 9.1.3. Sports Utility Vehicles and Multi-Purpose Vehicles
- 9.2. Market Analysis, Insights and Forecast - by Vendor
- 9.2.1. Organized
- 9.2.2. Unorganized
- 9.1. Market Analysis, Insights and Forecast - by Vehicle Type
- 10. North America Used Car Industry Analysis, Insights and Forecast, 2019-2031
- 10.1. Market Analysis, Insights and Forecast - By Country/Sub-region
- 10.1.1 United States
- 10.1.2 Canada
- 10.1.3 Rest of North America
- 11. Europe Used Car Industry Analysis, Insights and Forecast, 2019-2031
- 11.1. Market Analysis, Insights and Forecast - By Country/Sub-region
- 11.1.1 Germany
- 11.1.2 United Kingdom
- 11.1.3 France
- 11.1.4 Spain
- 11.1.5 Rest of Europe
- 12. Asia Pacific Used Car Industry Analysis, Insights and Forecast, 2019-2031
- 12.1. Market Analysis, Insights and Forecast - By Country/Sub-region
- 12.1.1 China
- 12.1.2 India
- 12.1.3 Japan
- 12.1.4 South Korea
- 12.1.5 Rest of Asia Pacific
- 13. Rest of the World Used Car Industry Analysis, Insights and Forecast, 2019-2031
- 13.1. Market Analysis, Insights and Forecast - By Country/Sub-region
- 13.1.1 Brazil
- 13.1.2 United Arab Emirates
- 13.1.3 South Africa
- 13.1.4 Other Countries
- 14. Competitive Analysis
- 14.1. Global Market Share Analysis 2024
- 14.2. Company Profiles
- 14.2.1 The Hertz Corporation
- 14.2.1.1. Overview
- 14.2.1.2. Products
- 14.2.1.3. SWOT Analysis
- 14.2.1.4. Recent Developments
- 14.2.1.5. Financials (Based on Availability)
- 14.2.2 Arnold Clark
- 14.2.2.1. Overview
- 14.2.2.2. Products
- 14.2.2.3. SWOT Analysis
- 14.2.2.4. Recent Developments
- 14.2.2.5. Financials (Based on Availability)
- 14.2.3 Cox Automotive
- 14.2.3.1. Overview
- 14.2.3.2. Products
- 14.2.3.3. SWOT Analysis
- 14.2.3.4. Recent Developments
- 14.2.3.5. Financials (Based on Availability)
- 14.2.4 Pendragon PLC
- 14.2.4.1. Overview
- 14.2.4.2. Products
- 14.2.4.3. SWOT Analysis
- 14.2.4.4. Recent Developments
- 14.2.4.5. Financials (Based on Availability)
- 14.2.5 Carro
- 14.2.5.1. Overview
- 14.2.5.2. Products
- 14.2.5.3. SWOT Analysis
- 14.2.5.4. Recent Developments
- 14.2.5.5. Financials (Based on Availability)
- 14.2.6 AutoNation
- 14.2.6.1. Overview
- 14.2.6.2. Products
- 14.2.6.3. SWOT Analysis
- 14.2.6.4. Recent Developments
- 14.2.6.5. Financials (Based on Availability)
- 14.2.7 Asbury Automotive Grou
- 14.2.7.1. Overview
- 14.2.7.2. Products
- 14.2.7.3. SWOT Analysis
- 14.2.7.4. Recent Developments
- 14.2.7.5. Financials (Based on Availability)
- 14.2.8 Mahindra First Choice Wheels
- 14.2.8.1. Overview
- 14.2.8.2. Products
- 14.2.8.3. SWOT Analysis
- 14.2.8.4. Recent Developments
- 14.2.8.5. Financials (Based on Availability)
- 14.2.9 Penske Cars
- 14.2.9.1. Overview
- 14.2.9.2. Products
- 14.2.9.3. SWOT Analysis
- 14.2.9.4. Recent Developments
- 14.2.9.5. Financials (Based on Availability)
- 14.2.10 CarMax Inc
- 14.2.10.1. Overview
- 14.2.10.2. Products
- 14.2.10.3. SWOT Analysis
- 14.2.10.4. Recent Developments
- 14.2.10.5. Financials (Based on Availability)
- 14.2.11 Maruti Suzuki True Value
- 14.2.11.1. Overview
- 14.2.11.2. Products
- 14.2.11.3. SWOT Analysis
- 14.2.11.4. Recent Developments
- 14.2.11.5. Financials (Based on Availability)
- 14.2.12 Emil Frey AG
- 14.2.12.1. Overview
- 14.2.12.2. Products
- 14.2.12.3. SWOT Analysis
- 14.2.12.4. Recent Developments
- 14.2.12.5. Financials (Based on Availability)
- 14.2.1 The Hertz Corporation
List of Figures
- Figure 1: Global Used Car Industry Revenue Breakdown (Million, %) by Region 2024 & 2032
- Figure 2: North America Used Car Industry Revenue (Million), by Country 2024 & 2032
- Figure 3: North America Used Car Industry Revenue Share (%), by Country 2024 & 2032
- Figure 4: Europe Used Car Industry Revenue (Million), by Country 2024 & 2032
- Figure 5: Europe Used Car Industry Revenue Share (%), by Country 2024 & 2032
- Figure 6: Asia Pacific Used Car Industry Revenue (Million), by Country 2024 & 2032
- Figure 7: Asia Pacific Used Car Industry Revenue Share (%), by Country 2024 & 2032
- Figure 8: Rest of the World Used Car Industry Revenue (Million), by Country 2024 & 2032
- Figure 9: Rest of the World Used Car Industry Revenue Share (%), by Country 2024 & 2032
- Figure 10: North America Used Car Industry Revenue (Million), by Vehicle Type 2024 & 2032
- Figure 11: North America Used Car Industry Revenue Share (%), by Vehicle Type 2024 & 2032
- Figure 12: North America Used Car Industry Revenue (Million), by Vendor 2024 & 2032
- Figure 13: North America Used Car Industry Revenue Share (%), by Vendor 2024 & 2032
- Figure 14: North America Used Car Industry Revenue (Million), by Country 2024 & 2032
- Figure 15: North America Used Car Industry Revenue Share (%), by Country 2024 & 2032
- Figure 16: Europe Used Car Industry Revenue (Million), by Vehicle Type 2024 & 2032
- Figure 17: Europe Used Car Industry Revenue Share (%), by Vehicle Type 2024 & 2032
- Figure 18: Europe Used Car Industry Revenue (Million), by Vendor 2024 & 2032
- Figure 19: Europe Used Car Industry Revenue Share (%), by Vendor 2024 & 2032
- Figure 20: Europe Used Car Industry Revenue (Million), by Country 2024 & 2032
- Figure 21: Europe Used Car Industry Revenue Share (%), by Country 2024 & 2032
- Figure 22: Asia Pacific Used Car Industry Revenue (Million), by Vehicle Type 2024 & 2032
- Figure 23: Asia Pacific Used Car Industry Revenue Share (%), by Vehicle Type 2024 & 2032
- Figure 24: Asia Pacific Used Car Industry Revenue (Million), by Vendor 2024 & 2032
- Figure 25: Asia Pacific Used Car Industry Revenue Share (%), by Vendor 2024 & 2032
- Figure 26: Asia Pacific Used Car Industry Revenue (Million), by Country 2024 & 2032
- Figure 27: Asia Pacific Used Car Industry Revenue Share (%), by Country 2024 & 2032
- Figure 28: Rest of the World Used Car Industry Revenue (Million), by Vehicle Type 2024 & 2032
- Figure 29: Rest of the World Used Car Industry Revenue Share (%), by Vehicle Type 2024 & 2032
- Figure 30: Rest of the World Used Car Industry Revenue (Million), by Vendor 2024 & 2032
- Figure 31: Rest of the World Used Car Industry Revenue Share (%), by Vendor 2024 & 2032
- Figure 32: Rest of the World Used Car Industry Revenue (Million), by Country 2024 & 2032
- Figure 33: Rest of the World Used Car Industry Revenue Share (%), by Country 2024 & 2032
List of Tables
- Table 1: Global Used Car Industry Revenue Million Forecast, by Region 2019 & 2032
- Table 2: Global Used Car Industry Revenue Million Forecast, by Vehicle Type 2019 & 2032
- Table 3: Global Used Car Industry Revenue Million Forecast, by Vendor 2019 & 2032
- Table 4: Global Used Car Industry Revenue Million Forecast, by Region 2019 & 2032
- Table 5: Global Used Car Industry Revenue Million Forecast, by Country 2019 & 2032
- Table 6: United States Used Car Industry Revenue (Million) Forecast, by Application 2019 & 2032
- Table 7: Canada Used Car Industry Revenue (Million) Forecast, by Application 2019 & 2032
- Table 8: Rest of North America Used Car Industry Revenue (Million) Forecast, by Application 2019 & 2032
- Table 9: Global Used Car Industry Revenue Million Forecast, by Country 2019 & 2032
- Table 10: Germany Used Car Industry Revenue (Million) Forecast, by Application 2019 & 2032
- Table 11: United Kingdom Used Car Industry Revenue (Million) Forecast, by Application 2019 & 2032
- Table 12: France Used Car Industry Revenue (Million) Forecast, by Application 2019 & 2032
- Table 13: Spain Used Car Industry Revenue (Million) Forecast, by Application 2019 & 2032
- Table 14: Rest of Europe Used Car Industry Revenue (Million) Forecast, by Application 2019 & 2032
- Table 15: Global Used Car Industry Revenue Million Forecast, by Country 2019 & 2032
- Table 16: China Used Car Industry Revenue (Million) Forecast, by Application 2019 & 2032
- Table 17: India Used Car Industry Revenue (Million) Forecast, by Application 2019 & 2032
- Table 18: Japan Used Car Industry Revenue (Million) Forecast, by Application 2019 & 2032
- Table 19: South Korea Used Car Industry Revenue (Million) Forecast, by Application 2019 & 2032
- Table 20: Rest of Asia Pacific Used Car Industry Revenue (Million) Forecast, by Application 2019 & 2032
- Table 21: Global Used Car Industry Revenue Million Forecast, by Country 2019 & 2032
- Table 22: Brazil Used Car Industry Revenue (Million) Forecast, by Application 2019 & 2032
- Table 23: United Arab Emirates Used Car Industry Revenue (Million) Forecast, by Application 2019 & 2032
- Table 24: South Africa Used Car Industry Revenue (Million) Forecast, by Application 2019 & 2032
- Table 25: Other Countries Used Car Industry Revenue (Million) Forecast, by Application 2019 & 2032
- Table 26: Global Used Car Industry Revenue Million Forecast, by Vehicle Type 2019 & 2032
- Table 27: Global Used Car Industry Revenue Million Forecast, by Vendor 2019 & 2032
- Table 28: Global Used Car Industry Revenue Million Forecast, by Country 2019 & 2032
- Table 29: United States Used Car Industry Revenue (Million) Forecast, by Application 2019 & 2032
- Table 30: Canada Used Car Industry Revenue (Million) Forecast, by Application 2019 & 2032
- Table 31: Rest of North America Used Car Industry Revenue (Million) Forecast, by Application 2019 & 2032
- Table 32: Global Used Car Industry Revenue Million Forecast, by Vehicle Type 2019 & 2032
- Table 33: Global Used Car Industry Revenue Million Forecast, by Vendor 2019 & 2032
- Table 34: Global Used Car Industry Revenue Million Forecast, by Country 2019 & 2032
- Table 35: Germany Used Car Industry Revenue (Million) Forecast, by Application 2019 & 2032
- Table 36: United Kingdom Used Car Industry Revenue (Million) Forecast, by Application 2019 & 2032
- Table 37: France Used Car Industry Revenue (Million) Forecast, by Application 2019 & 2032
- Table 38: Spain Used Car Industry Revenue (Million) Forecast, by Application 2019 & 2032
- Table 39: Rest of Europe Used Car Industry Revenue (Million) Forecast, by Application 2019 & 2032
- Table 40: Global Used Car Industry Revenue Million Forecast, by Vehicle Type 2019 & 2032
- Table 41: Global Used Car Industry Revenue Million Forecast, by Vendor 2019 & 2032
- Table 42: Global Used Car Industry Revenue Million Forecast, by Country 2019 & 2032
- Table 43: China Used Car Industry Revenue (Million) Forecast, by Application 2019 & 2032
- Table 44: India Used Car Industry Revenue (Million) Forecast, by Application 2019 & 2032
- Table 45: Japan Used Car Industry Revenue (Million) Forecast, by Application 2019 & 2032
- Table 46: South Korea Used Car Industry Revenue (Million) Forecast, by Application 2019 & 2032
- Table 47: Rest of Asia Pacific Used Car Industry Revenue (Million) Forecast, by Application 2019 & 2032
- Table 48: Global Used Car Industry Revenue Million Forecast, by Vehicle Type 2019 & 2032
- Table 49: Global Used Car Industry Revenue Million Forecast, by Vendor 2019 & 2032
- Table 50: Global Used Car Industry Revenue Million Forecast, by Country 2019 & 2032
- Table 51: Brazil Used Car Industry Revenue (Million) Forecast, by Application 2019 & 2032
- Table 52: United Arab Emirates Used Car Industry Revenue (Million) Forecast, by Application 2019 & 2032
- Table 53: South Africa Used Car Industry Revenue (Million) Forecast, by Application 2019 & 2032
- Table 54: Other Countries Used Car Industry Revenue (Million) Forecast, by Application 2019 & 2032
Frequently Asked Questions
1. What is the projected Compound Annual Growth Rate (CAGR) of the Used Car Industry?
The projected CAGR is approximately 10.00%.
2. Which companies are prominent players in the Used Car Industry?
Key companies in the market include The Hertz Corporation, Arnold Clark, Cox Automotive, Pendragon PLC, Carro, AutoNation, Asbury Automotive Grou, Mahindra First Choice Wheels, Penske Cars, CarMax Inc, Maruti Suzuki True Value, Emil Frey AG.
3. What are the main segments of the Used Car Industry?
The market segments include Vehicle Type, Vendor.
4. Can you provide details about the market size?
The market size is estimated to be USD XX Million as of 2022.
5. What are some drivers contributing to market growth?
Increasing Demand For Electric School Buses.
6. What are the notable trends driving market growth?
Strengthening of Online Infrastructure Positively Affecting the Used Cars Market.
7. Are there any restraints impacting market growth?
Uncertainty of The Global Pandemic.
8. Can you provide examples of recent developments in the market?
March 2022: TrueCar Inc. launched a new online car-buying marketplace called TrueCar+. TrueCar+ will provide consumers with a more flexible and personalized car buying experience for new and used vehicles.
9. What pricing options are available for accessing the report?
Pricing options include single-user, multi-user, and enterprise licenses priced at USD 4750, USD 5250, and USD 8750 respectively.
10. Is the market size provided in terms of value or volume?
The market size is provided in terms of value, measured in Million.
11. Are there any specific market keywords associated with the report?
Yes, the market keyword associated with the report is "Used Car Industry," which aids in identifying and referencing the specific market segment covered.
12. How do I determine which pricing option suits my needs best?
The pricing options vary based on user requirements and access needs. Individual users may opt for single-user licenses, while businesses requiring broader access may choose multi-user or enterprise licenses for cost-effective access to the report.
13. Are there any additional resources or data provided in the Used Car Industry report?
While the report offers comprehensive insights, it's advisable to review the specific contents or supplementary materials provided to ascertain if additional resources or data are available.
14. How can I stay updated on further developments or reports in the Used Car Industry?
To stay informed about further developments, trends, and reports in the Used Car Industry, consider subscribing to industry newsletters, following relevant companies and organizations, or regularly checking reputable industry news sources and publications.
Methodology
Step 1 - Identification of Relevant Samples Size from Population Database


Step 2 - Approaches for Defining Global Market Size (Value, Volume* & Price*)

Note*: In applicable scenarios
Step 3 - Data Sources
Primary Research
- Web Analytics
- Survey Reports
- Research Institute
- Latest Research Reports
- Opinion Leaders
Secondary Research
- Annual Reports
- White Paper
- Latest Press Release
- Industry Association
- Paid Database
- Investor Presentations

Step 4 - Data Triangulation
Involves using different sources of information in order to increase the validity of a study
These sources are likely to be stakeholders in a program - participants, other researchers, program staff, other community members, and so on.
Then we put all data in single framework & apply various statistical tools to find out the dynamic on the market.
During the analysis stage, feedback from the stakeholder groups would be compared to determine areas of agreement as well as areas of divergence


