


Key Insights
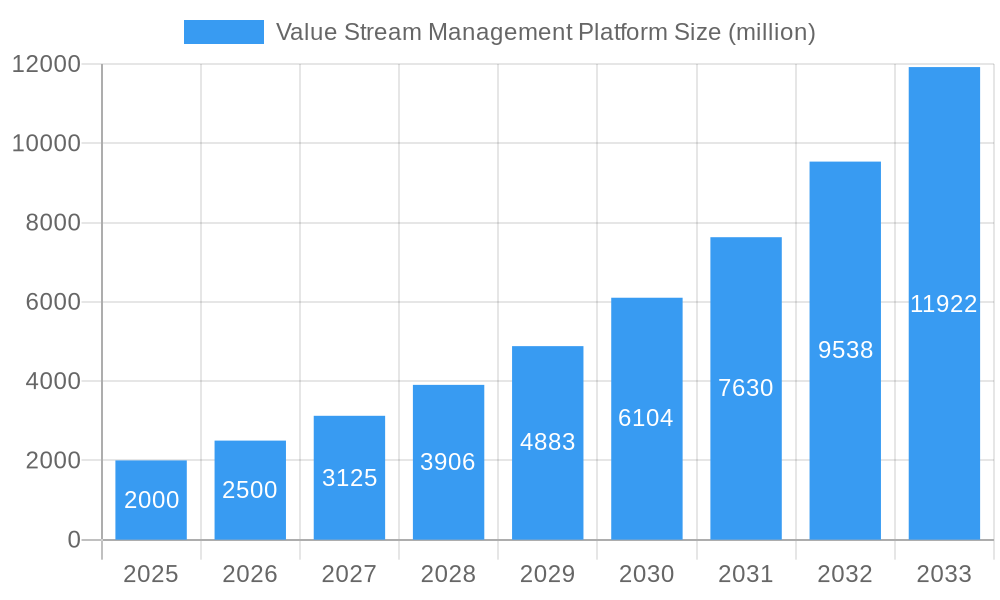
The Value Stream Management (VSM) Platform market is experiencing robust growth, driven by the increasing need for organizations to optimize their software delivery processes and enhance operational efficiency. The market, estimated at $2 billion in 2025, is projected to exhibit a Compound Annual Growth Rate (CAGR) of 25% from 2025 to 2033, reaching an estimated market value exceeding $10 billion by 2033. This expansion is fueled by several key factors, including the rising adoption of DevOps and Agile methodologies, the increasing complexity of software development lifecycles, and the growing demand for improved visibility and control across the entire value stream. Businesses are increasingly seeking platforms that provide end-to-end visibility into their software delivery pipelines, enabling them to identify bottlenecks, reduce cycle times, and improve overall quality. The market is witnessing a shift towards cloud-based solutions, driven by scalability, flexibility, and cost-effectiveness.
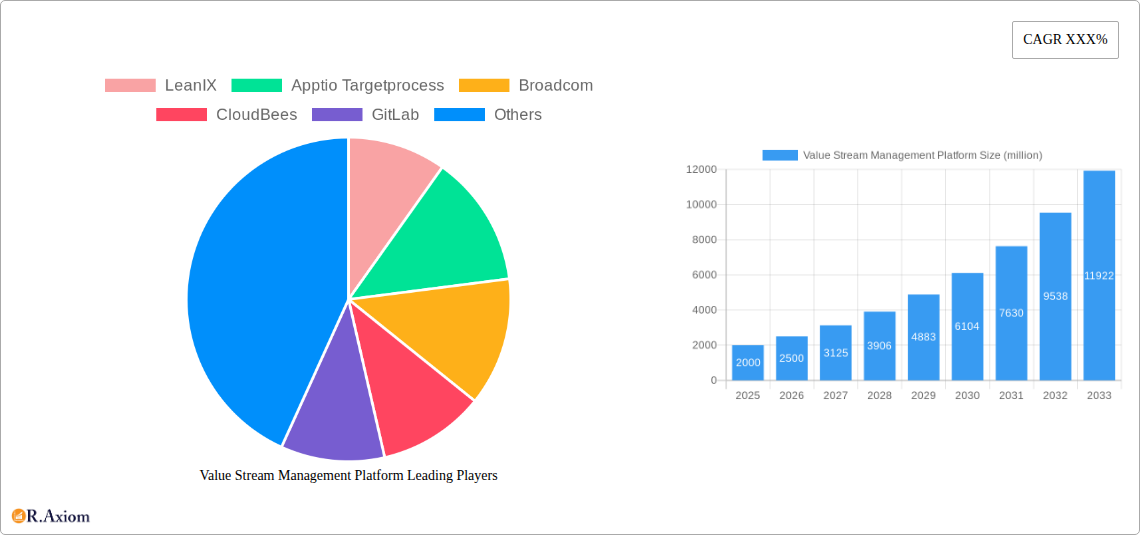
Value Stream Management Platform Market Size (In Billion)

The competitive landscape is dynamic, with a mix of established players and emerging startups vying for market share. Key players such as ServiceNow, Atlassian, and Broadcom are leveraging their existing customer bases and technological capabilities to expand their VSM offerings. Meanwhile, specialized VSM vendors like LeanIX and Tasktop are focusing on innovation and niche market segments. The market is also seeing increased consolidation, with larger companies acquiring smaller players to enhance their capabilities and expand their reach. The future growth of the VSM market will depend on factors such as continued technological advancements, increased awareness among businesses of the benefits of VSM, and the ability of vendors to adapt to evolving customer needs. Integration with other enterprise tools and the development of advanced analytics capabilities will be crucial for success in this rapidly evolving market.
Value Stream Management Platform Company Market Share
This comprehensive report provides a detailed analysis of the Value Stream Management Platform market, offering actionable insights for stakeholders across the technology landscape. With a study period spanning 2019-2033, a base year of 2025, and an estimated and forecast period of 2025-2033, this report unveils the market's current state, future trajectory, and key players shaping its evolution. The report leverages a wealth of data to provide a clear picture of market concentration, innovation, trends, and growth opportunities, ultimately helping businesses make informed strategic decisions. The market is estimated to be worth $XX million in 2025 and projected to reach $XX million by 2033, representing a CAGR of XX%.
Value Stream Management Platform Market Concentration & Innovation
The Value Stream Management Platform market exhibits a moderately concentrated landscape, with several key players holding significant market share. However, the market is also characterized by considerable innovation, driven by the increasing need for enhanced efficiency and agility in software development and IT operations. LeanIX, Apptio, and ServiceNow currently hold a substantial portion of the market share, estimated at XX%, YY%, and ZZ% respectively in 2025. The high value of M&A activity in the sector, totaling approximately $XX million between 2019 and 2024, demonstrates the strategic importance of this market.
- Market Concentration: High, with a few dominant players.
- Innovation Drivers: Demand for improved software development lifecycle (SDLC) efficiency, increased automation, and AI-driven analytics.
- Regulatory Frameworks: Compliance standards like GDPR and CCPA indirectly influence market growth by requiring robust data management capabilities within the platforms.
- Product Substitutes: While dedicated VSM platforms are preferred, some organizations might use a combination of disparate tools, leading to integration challenges.
- End-User Trends: Growing adoption of DevOps and Agile methodologies fuels the demand for VSM solutions.
- M&A Activities: Significant consolidation observed, with deal values exceeding $XX million in the historical period. Further consolidation is anticipated.
Value Stream Management Platform Industry Trends & Insights
The Value Stream Management Platform market is experiencing robust growth, fueled by several key factors. The increasing adoption of DevOps and Agile methodologies is a primary driver, necessitating tools for visualizing and optimizing workflows. Technological advancements, such as the integration of AI and machine learning, further enhance the capabilities of these platforms, providing more sophisticated analytics and automation opportunities. Consumer preferences are shifting towards cloud-based solutions for their scalability and accessibility. The competitive dynamics are intense, with established players constantly innovating and new entrants emerging to cater to niche market segments. Market penetration is currently estimated at XX%, with expectations of reaching YY% by 2033.
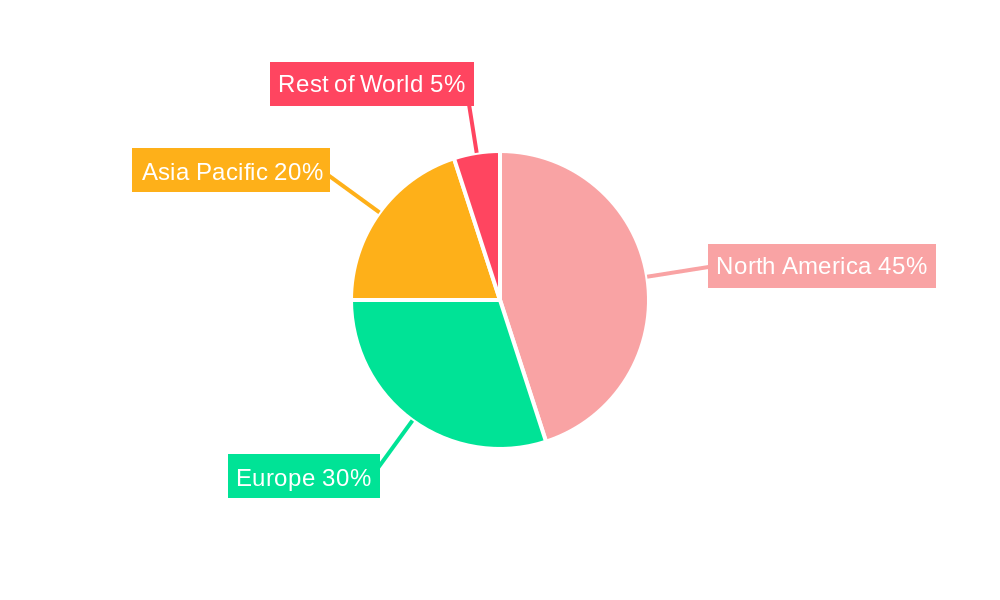
Dominant Markets & Segments in Value Stream Management Platform
North America currently holds the dominant position in the Value Stream Management Platform market, driven by early adoption of DevOps practices and a high concentration of technology companies. However, the Asia-Pacific region is witnessing rapid growth, fueled by increasing digital transformation initiatives and government support for technology adoption.
- Key Drivers in North America: High technological maturity, established DevOps culture, and substantial investment in IT infrastructure.
- Key Drivers in Asia-Pacific: Rapid digital transformation across various industries, government initiatives promoting technology adoption, and a growing pool of skilled professionals.
- Dominance Analysis: North America's dominance is attributed to the early adoption of the technology and significant existing market. However, the Asia-Pacific region's rapid growth indicates a potential shift in market share dynamics in the forecast period.
Value Stream Management Platform Product Developments
Recent product developments focus on enhanced analytics, AI-powered optimization, and seamless integration with existing DevOps tools. This reflects the market’s demand for more sophisticated capabilities to streamline workflows and improve decision-making. Key technological trends include improved visualization techniques, automation features, and integration with CI/CD pipelines. These innovations improve market fit by addressing the growing need for real-time insights and proactive problem-solving.
Report Scope & Segmentation Analysis
This report segments the Value Stream Management Platform market based on deployment type (cloud, on-premise), organization size (small, medium, large enterprises), industry vertical (IT, BFSI, healthcare, etc.), and geographic region. Each segment's growth trajectory varies, reflecting the specific needs and adoption rates within each area. For example, the cloud segment demonstrates faster growth compared to on-premise deployments. The overall market size is segmented into: cloud based (XX million in 2025), on-premise (YY million in 2025), and others (ZZ million in 2025).
Key Drivers of Value Stream Management Platform Growth
Several factors drive the growth of the Value Stream Management Platform market. The increasing complexity of software development processes necessitates efficient tools for managing workflows and improving visibility. The rising adoption of Agile and DevOps methodologies further accelerates demand. Additionally, regulatory requirements for data security and compliance also contribute to the market's expansion. Finally, technological advancements, such as AI-powered analytics, are enhancing the capabilities of VSM platforms, making them more attractive to organizations.
Challenges in the Value Stream Management Platform Sector
The Value Stream Management Platform sector faces several challenges. Data integration from diverse sources can be complex, requiring robust integration capabilities. The cost of implementation and maintenance can be a barrier for smaller organizations. Competition from established players and new entrants can also impact market share and pricing strategies. Finally, the lack of skilled professionals to manage and utilize these platforms can impede widespread adoption.
Emerging Opportunities in Value Stream Management Platform
Significant opportunities exist for VSM platforms to expand into new markets. The increasing adoption of microservices architectures presents opportunities for specialized solutions. Furthermore, the integration of AI/ML for predictive analytics and automation offers substantial potential. Finally, extending VSM capabilities to encompass the entire value chain, including supply chain management, provides significant growth potential.
Leading Players in the Value Stream Management Platform Market
- LeanIX
- Apptio
- Targetprocess
- Broadcom
- CloudBees
- GitLab
- codeBeamer
- Infosys (Panaya)
- Storyteller
- Digital.ai
- ConnectALL
- Plutora
- Tasktop
- Opsera
- Jellyfish
- LinearB
- Propelo
- HCL Technologies
- Plandek
- ServiceNow
Key Developments in Value Stream Management Platform Industry
- 2022 Q4: ServiceNow launched new features for its VSM platform, enhancing AI-powered analytics capabilities.
- 2023 Q1: LeanIX acquired a smaller competitor, expanding its market share and product offerings.
- 2023 Q2: Several major players announced strategic partnerships to improve interoperability between VSM platforms.
- 2024 Q1: New entrants introduced niche VSM solutions targeting specific industry verticals.
Strategic Outlook for Value Stream Management Platform Market
The Value Stream Management Platform market is poised for continued growth, driven by ongoing digital transformation initiatives and increasing adoption of Agile and DevOps methodologies. Opportunities abound for innovation, particularly in areas such as AI-powered automation and integration with broader enterprise systems. This evolving market warrants ongoing monitoring and strategic adaptation for companies aiming to thrive in this dynamic landscape.
Value Stream Management Platform Segmentation
-
1. Application
- 1.1. Large Enterprises
- 1.2. SMEs
-
2. Type
- 2.1. Cloud-based
- 2.2. On-premise
Value Stream Management Platform Segmentation By Geography
-
1. North America
- 1.1. United States
- 1.2. Canada
- 1.3. Mexico
-
2. South America
- 2.1. Brazil
- 2.2. Argentina
- 2.3. Rest of South America
-
3. Europe
- 3.1. United Kingdom
- 3.2. Germany
- 3.3. France
- 3.4. Italy
- 3.5. Spain
- 3.6. Russia
- 3.7. Benelux
- 3.8. Nordics
- 3.9. Rest of Europe
-
4. Middle East & Africa
- 4.1. Turkey
- 4.2. Israel
- 4.3. GCC
- 4.4. North Africa
- 4.5. South Africa
- 4.6. Rest of Middle East & Africa
-
5. Asia Pacific
- 5.1. China
- 5.2. India
- 5.3. Japan
- 5.4. South Korea
- 5.5. ASEAN
- 5.6. Oceania
- 5.7. Rest of Asia Pacific
Value Stream Management Platform Regional Market Share
Geographic Coverage of Value Stream Management Platform
Value Stream Management Platform REPORT HIGHLIGHTS
| Aspects | Details |
|---|---|
| Study Period | 2020-2034 |
| Base Year | 2025 |
| Estimated Year | 2026 |
| Forecast Period | 2026-2034 |
| Historical Period | 2020-2025 |
| Growth Rate | CAGR of XXX% from 2020-2034 |
| Segmentation |
|
Table of Contents
- 1. Introduction
- 1.1. Research Scope
- 1.2. Market Segmentation
- 1.3. Research Methodology
- 1.4. Definitions and Assumptions
- 2. Executive Summary
- 2.1. Introduction
- 3. Market Dynamics
- 3.1. Introduction
- 3.2. Market Drivers
- 3.3. Market Restrains
- 3.4. Market Trends
- 4. Market Factor Analysis
- 4.1. Porters Five Forces
- 4.2. Supply/Value Chain
- 4.3. PESTEL analysis
- 4.4. Market Entropy
- 4.5. Patent/Trademark Analysis
- 5. Global Value Stream Management Platform Analysis, Insights and Forecast, 2020-2032
- 5.1. Market Analysis, Insights and Forecast - by Application
- 5.1.1. Large Enterprises
- 5.1.2. SMEs
- 5.2. Market Analysis, Insights and Forecast - by Type
- 5.2.1. Cloud-based
- 5.2.2. On-premise
- 5.3. Market Analysis, Insights and Forecast - by Region
- 5.3.1. North America
- 5.3.2. South America
- 5.3.3. Europe
- 5.3.4. Middle East & Africa
- 5.3.5. Asia Pacific
- 5.1. Market Analysis, Insights and Forecast - by Application
- 6. North America Value Stream Management Platform Analysis, Insights and Forecast, 2020-2032
- 6.1. Market Analysis, Insights and Forecast - by Application
- 6.1.1. Large Enterprises
- 6.1.2. SMEs
- 6.2. Market Analysis, Insights and Forecast - by Type
- 6.2.1. Cloud-based
- 6.2.2. On-premise
- 6.1. Market Analysis, Insights and Forecast - by Application
- 7. South America Value Stream Management Platform Analysis, Insights and Forecast, 2020-2032
- 7.1. Market Analysis, Insights and Forecast - by Application
- 7.1.1. Large Enterprises
- 7.1.2. SMEs
- 7.2. Market Analysis, Insights and Forecast - by Type
- 7.2.1. Cloud-based
- 7.2.2. On-premise
- 7.1. Market Analysis, Insights and Forecast - by Application
- 8. Europe Value Stream Management Platform Analysis, Insights and Forecast, 2020-2032
- 8.1. Market Analysis, Insights and Forecast - by Application
- 8.1.1. Large Enterprises
- 8.1.2. SMEs
- 8.2. Market Analysis, Insights and Forecast - by Type
- 8.2.1. Cloud-based
- 8.2.2. On-premise
- 8.1. Market Analysis, Insights and Forecast - by Application
- 9. Middle East & Africa Value Stream Management Platform Analysis, Insights and Forecast, 2020-2032
- 9.1. Market Analysis, Insights and Forecast - by Application
- 9.1.1. Large Enterprises
- 9.1.2. SMEs
- 9.2. Market Analysis, Insights and Forecast - by Type
- 9.2.1. Cloud-based
- 9.2.2. On-premise
- 9.1. Market Analysis, Insights and Forecast - by Application
- 10. Asia Pacific Value Stream Management Platform Analysis, Insights and Forecast, 2020-2032
- 10.1. Market Analysis, Insights and Forecast - by Application
- 10.1.1. Large Enterprises
- 10.1.2. SMEs
- 10.2. Market Analysis, Insights and Forecast - by Type
- 10.2.1. Cloud-based
- 10.2.2. On-premise
- 10.1. Market Analysis, Insights and Forecast - by Application
- 11. Competitive Analysis
- 11.1. Global Market Share Analysis 2025
- 11.2. Company Profiles
- 11.2.1 LeanIX
- 11.2.1.1. Overview
- 11.2.1.2. Products
- 11.2.1.3. SWOT Analysis
- 11.2.1.4. Recent Developments
- 11.2.1.5. Financials (Based on Availability)
- 11.2.2 Apptio Targetprocess
- 11.2.2.1. Overview
- 11.2.2.2. Products
- 11.2.2.3. SWOT Analysis
- 11.2.2.4. Recent Developments
- 11.2.2.5. Financials (Based on Availability)
- 11.2.3 Broadcom
- 11.2.3.1. Overview
- 11.2.3.2. Products
- 11.2.3.3. SWOT Analysis
- 11.2.3.4. Recent Developments
- 11.2.3.5. Financials (Based on Availability)
- 11.2.4 CloudBees
- 11.2.4.1. Overview
- 11.2.4.2. Products
- 11.2.4.3. SWOT Analysis
- 11.2.4.4. Recent Developments
- 11.2.4.5. Financials (Based on Availability)
- 11.2.5 GitLab
- 11.2.5.1. Overview
- 11.2.5.2. Products
- 11.2.5.3. SWOT Analysis
- 11.2.5.4. Recent Developments
- 11.2.5.5. Financials (Based on Availability)
- 11.2.6 codeBeamer
- 11.2.6.1. Overview
- 11.2.6.2. Products
- 11.2.6.3. SWOT Analysis
- 11.2.6.4. Recent Developments
- 11.2.6.5. Financials (Based on Availability)
- 11.2.7 Infosys (Panaya)
- 11.2.7.1. Overview
- 11.2.7.2. Products
- 11.2.7.3. SWOT Analysis
- 11.2.7.4. Recent Developments
- 11.2.7.5. Financials (Based on Availability)
- 11.2.8 Storyteller
- 11.2.8.1. Overview
- 11.2.8.2. Products
- 11.2.8.3. SWOT Analysis
- 11.2.8.4. Recent Developments
- 11.2.8.5. Financials (Based on Availability)
- 11.2.9 Digital.ai
- 11.2.9.1. Overview
- 11.2.9.2. Products
- 11.2.9.3. SWOT Analysis
- 11.2.9.4. Recent Developments
- 11.2.9.5. Financials (Based on Availability)
- 11.2.10 ConnectALL
- 11.2.10.1. Overview
- 11.2.10.2. Products
- 11.2.10.3. SWOT Analysis
- 11.2.10.4. Recent Developments
- 11.2.10.5. Financials (Based on Availability)
- 11.2.11 Plutora
- 11.2.11.1. Overview
- 11.2.11.2. Products
- 11.2.11.3. SWOT Analysis
- 11.2.11.4. Recent Developments
- 11.2.11.5. Financials (Based on Availability)
- 11.2.12 Tasktop
- 11.2.12.1. Overview
- 11.2.12.2. Products
- 11.2.12.3. SWOT Analysis
- 11.2.12.4. Recent Developments
- 11.2.12.5. Financials (Based on Availability)
- 11.2.13 Opsera
- 11.2.13.1. Overview
- 11.2.13.2. Products
- 11.2.13.3. SWOT Analysis
- 11.2.13.4. Recent Developments
- 11.2.13.5. Financials (Based on Availability)
- 11.2.14 Jellyfish
- 11.2.14.1. Overview
- 11.2.14.2. Products
- 11.2.14.3. SWOT Analysis
- 11.2.14.4. Recent Developments
- 11.2.14.5. Financials (Based on Availability)
- 11.2.15 LinearB
- 11.2.15.1. Overview
- 11.2.15.2. Products
- 11.2.15.3. SWOT Analysis
- 11.2.15.4. Recent Developments
- 11.2.15.5. Financials (Based on Availability)
- 11.2.16 Propelo
- 11.2.16.1. Overview
- 11.2.16.2. Products
- 11.2.16.3. SWOT Analysis
- 11.2.16.4. Recent Developments
- 11.2.16.5. Financials (Based on Availability)
- 11.2.17 HCL Technologies
- 11.2.17.1. Overview
- 11.2.17.2. Products
- 11.2.17.3. SWOT Analysis
- 11.2.17.4. Recent Developments
- 11.2.17.5. Financials (Based on Availability)
- 11.2.18 Plandek
- 11.2.18.1. Overview
- 11.2.18.2. Products
- 11.2.18.3. SWOT Analysis
- 11.2.18.4. Recent Developments
- 11.2.18.5. Financials (Based on Availability)
- 11.2.19 ServiceNow
- 11.2.19.1. Overview
- 11.2.19.2. Products
- 11.2.19.3. SWOT Analysis
- 11.2.19.4. Recent Developments
- 11.2.19.5. Financials (Based on Availability)
- 11.2.1 LeanIX
List of Figures
- Figure 1: Global Value Stream Management Platform Revenue Breakdown (million, %) by Region 2025 & 2033
- Figure 2: North America Value Stream Management Platform Revenue (million), by Application 2025 & 2033
- Figure 3: North America Value Stream Management Platform Revenue Share (%), by Application 2025 & 2033
- Figure 4: North America Value Stream Management Platform Revenue (million), by Type 2025 & 2033
- Figure 5: North America Value Stream Management Platform Revenue Share (%), by Type 2025 & 2033
- Figure 6: North America Value Stream Management Platform Revenue (million), by Country 2025 & 2033
- Figure 7: North America Value Stream Management Platform Revenue Share (%), by Country 2025 & 2033
- Figure 8: South America Value Stream Management Platform Revenue (million), by Application 2025 & 2033
- Figure 9: South America Value Stream Management Platform Revenue Share (%), by Application 2025 & 2033
- Figure 10: South America Value Stream Management Platform Revenue (million), by Type 2025 & 2033
- Figure 11: South America Value Stream Management Platform Revenue Share (%), by Type 2025 & 2033
- Figure 12: South America Value Stream Management Platform Revenue (million), by Country 2025 & 2033
- Figure 13: South America Value Stream Management Platform Revenue Share (%), by Country 2025 & 2033
- Figure 14: Europe Value Stream Management Platform Revenue (million), by Application 2025 & 2033
- Figure 15: Europe Value Stream Management Platform Revenue Share (%), by Application 2025 & 2033
- Figure 16: Europe Value Stream Management Platform Revenue (million), by Type 2025 & 2033
- Figure 17: Europe Value Stream Management Platform Revenue Share (%), by Type 2025 & 2033
- Figure 18: Europe Value Stream Management Platform Revenue (million), by Country 2025 & 2033
- Figure 19: Europe Value Stream Management Platform Revenue Share (%), by Country 2025 & 2033
- Figure 20: Middle East & Africa Value Stream Management Platform Revenue (million), by Application 2025 & 2033
- Figure 21: Middle East & Africa Value Stream Management Platform Revenue Share (%), by Application 2025 & 2033
- Figure 22: Middle East & Africa Value Stream Management Platform Revenue (million), by Type 2025 & 2033
- Figure 23: Middle East & Africa Value Stream Management Platform Revenue Share (%), by Type 2025 & 2033
- Figure 24: Middle East & Africa Value Stream Management Platform Revenue (million), by Country 2025 & 2033
- Figure 25: Middle East & Africa Value Stream Management Platform Revenue Share (%), by Country 2025 & 2033
- Figure 26: Asia Pacific Value Stream Management Platform Revenue (million), by Application 2025 & 2033
- Figure 27: Asia Pacific Value Stream Management Platform Revenue Share (%), by Application 2025 & 2033
- Figure 28: Asia Pacific Value Stream Management Platform Revenue (million), by Type 2025 & 2033
- Figure 29: Asia Pacific Value Stream Management Platform Revenue Share (%), by Type 2025 & 2033
- Figure 30: Asia Pacific Value Stream Management Platform Revenue (million), by Country 2025 & 2033
- Figure 31: Asia Pacific Value Stream Management Platform Revenue Share (%), by Country 2025 & 2033
List of Tables
- Table 1: Global Value Stream Management Platform Revenue million Forecast, by Application 2020 & 2033
- Table 2: Global Value Stream Management Platform Revenue million Forecast, by Type 2020 & 2033
- Table 3: Global Value Stream Management Platform Revenue million Forecast, by Region 2020 & 2033
- Table 4: Global Value Stream Management Platform Revenue million Forecast, by Application 2020 & 2033
- Table 5: Global Value Stream Management Platform Revenue million Forecast, by Type 2020 & 2033
- Table 6: Global Value Stream Management Platform Revenue million Forecast, by Country 2020 & 2033
- Table 7: United States Value Stream Management Platform Revenue (million) Forecast, by Application 2020 & 2033
- Table 8: Canada Value Stream Management Platform Revenue (million) Forecast, by Application 2020 & 2033
- Table 9: Mexico Value Stream Management Platform Revenue (million) Forecast, by Application 2020 & 2033
- Table 10: Global Value Stream Management Platform Revenue million Forecast, by Application 2020 & 2033
- Table 11: Global Value Stream Management Platform Revenue million Forecast, by Type 2020 & 2033
- Table 12: Global Value Stream Management Platform Revenue million Forecast, by Country 2020 & 2033
- Table 13: Brazil Value Stream Management Platform Revenue (million) Forecast, by Application 2020 & 2033
- Table 14: Argentina Value Stream Management Platform Revenue (million) Forecast, by Application 2020 & 2033
- Table 15: Rest of South America Value Stream Management Platform Revenue (million) Forecast, by Application 2020 & 2033
- Table 16: Global Value Stream Management Platform Revenue million Forecast, by Application 2020 & 2033
- Table 17: Global Value Stream Management Platform Revenue million Forecast, by Type 2020 & 2033
- Table 18: Global Value Stream Management Platform Revenue million Forecast, by Country 2020 & 2033
- Table 19: United Kingdom Value Stream Management Platform Revenue (million) Forecast, by Application 2020 & 2033
- Table 20: Germany Value Stream Management Platform Revenue (million) Forecast, by Application 2020 & 2033
- Table 21: France Value Stream Management Platform Revenue (million) Forecast, by Application 2020 & 2033
- Table 22: Italy Value Stream Management Platform Revenue (million) Forecast, by Application 2020 & 2033
- Table 23: Spain Value Stream Management Platform Revenue (million) Forecast, by Application 2020 & 2033
- Table 24: Russia Value Stream Management Platform Revenue (million) Forecast, by Application 2020 & 2033
- Table 25: Benelux Value Stream Management Platform Revenue (million) Forecast, by Application 2020 & 2033
- Table 26: Nordics Value Stream Management Platform Revenue (million) Forecast, by Application 2020 & 2033
- Table 27: Rest of Europe Value Stream Management Platform Revenue (million) Forecast, by Application 2020 & 2033
- Table 28: Global Value Stream Management Platform Revenue million Forecast, by Application 2020 & 2033
- Table 29: Global Value Stream Management Platform Revenue million Forecast, by Type 2020 & 2033
- Table 30: Global Value Stream Management Platform Revenue million Forecast, by Country 2020 & 2033
- Table 31: Turkey Value Stream Management Platform Revenue (million) Forecast, by Application 2020 & 2033
- Table 32: Israel Value Stream Management Platform Revenue (million) Forecast, by Application 2020 & 2033
- Table 33: GCC Value Stream Management Platform Revenue (million) Forecast, by Application 2020 & 2033
- Table 34: North Africa Value Stream Management Platform Revenue (million) Forecast, by Application 2020 & 2033
- Table 35: South Africa Value Stream Management Platform Revenue (million) Forecast, by Application 2020 & 2033
- Table 36: Rest of Middle East & Africa Value Stream Management Platform Revenue (million) Forecast, by Application 2020 & 2033
- Table 37: Global Value Stream Management Platform Revenue million Forecast, by Application 2020 & 2033
- Table 38: Global Value Stream Management Platform Revenue million Forecast, by Type 2020 & 2033
- Table 39: Global Value Stream Management Platform Revenue million Forecast, by Country 2020 & 2033
- Table 40: China Value Stream Management Platform Revenue (million) Forecast, by Application 2020 & 2033
- Table 41: India Value Stream Management Platform Revenue (million) Forecast, by Application 2020 & 2033
- Table 42: Japan Value Stream Management Platform Revenue (million) Forecast, by Application 2020 & 2033
- Table 43: South Korea Value Stream Management Platform Revenue (million) Forecast, by Application 2020 & 2033
- Table 44: ASEAN Value Stream Management Platform Revenue (million) Forecast, by Application 2020 & 2033
- Table 45: Oceania Value Stream Management Platform Revenue (million) Forecast, by Application 2020 & 2033
- Table 46: Rest of Asia Pacific Value Stream Management Platform Revenue (million) Forecast, by Application 2020 & 2033
Frequently Asked Questions
1. What is the projected Compound Annual Growth Rate (CAGR) of the Value Stream Management Platform?
The projected CAGR is approximately XXX%.
2. Which companies are prominent players in the Value Stream Management Platform?
Key companies in the market include LeanIX, Apptio Targetprocess, Broadcom, CloudBees, GitLab, codeBeamer, Infosys (Panaya), Storyteller, Digital.ai, ConnectALL, Plutora, Tasktop, Opsera, Jellyfish, LinearB, Propelo, HCL Technologies, Plandek, ServiceNow.
3. What are the main segments of the Value Stream Management Platform?
The market segments include Application, Type.
4. Can you provide details about the market size?
The market size is estimated to be USD XXX million as of 2022.
5. What are some drivers contributing to market growth?
N/A
6. What are the notable trends driving market growth?
N/A
7. Are there any restraints impacting market growth?
N/A
8. Can you provide examples of recent developments in the market?
N/A
9. What pricing options are available for accessing the report?
Pricing options include single-user, multi-user, and enterprise licenses priced at USD 2900.00, USD 4350.00, and USD 5800.00 respectively.
10. Is the market size provided in terms of value or volume?
The market size is provided in terms of value, measured in million.
11. Are there any specific market keywords associated with the report?
Yes, the market keyword associated with the report is "Value Stream Management Platform," which aids in identifying and referencing the specific market segment covered.
12. How do I determine which pricing option suits my needs best?
The pricing options vary based on user requirements and access needs. Individual users may opt for single-user licenses, while businesses requiring broader access may choose multi-user or enterprise licenses for cost-effective access to the report.
13. Are there any additional resources or data provided in the Value Stream Management Platform report?
While the report offers comprehensive insights, it's advisable to review the specific contents or supplementary materials provided to ascertain if additional resources or data are available.
14. How can I stay updated on further developments or reports in the Value Stream Management Platform?
To stay informed about further developments, trends, and reports in the Value Stream Management Platform, consider subscribing to industry newsletters, following relevant companies and organizations, or regularly checking reputable industry news sources and publications.
Methodology
Step 1 - Identification of Relevant Samples Size from Population Database


Step 2 - Approaches for Defining Global Market Size (Value, Volume* & Price*)

Note*: In applicable scenarios
Step 3 - Data Sources
Primary Research
- Web Analytics
- Survey Reports
- Research Institute
- Latest Research Reports
- Opinion Leaders
Secondary Research
- Annual Reports
- White Paper
- Latest Press Release
- Industry Association
- Paid Database
- Investor Presentations

Step 4 - Data Triangulation
Involves using different sources of information in order to increase the validity of a study
These sources are likely to be stakeholders in a program - participants, other researchers, program staff, other community members, and so on.
Then we put all data in single framework & apply various statistical tools to find out the dynamic on the market.
During the analysis stage, feedback from the stakeholder groups would be compared to determine areas of agreement as well as areas of divergence