
Key Insights
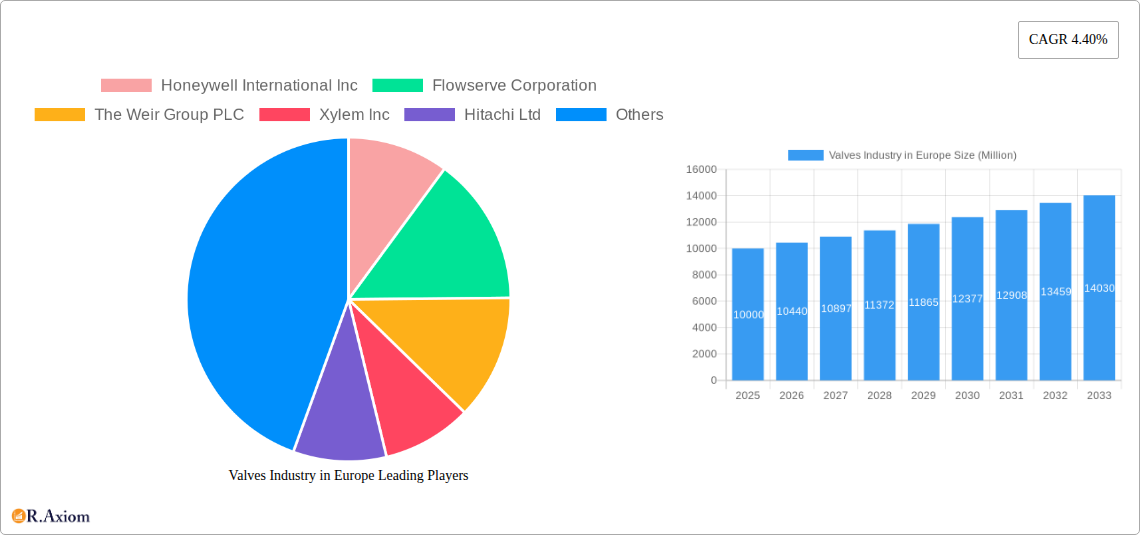
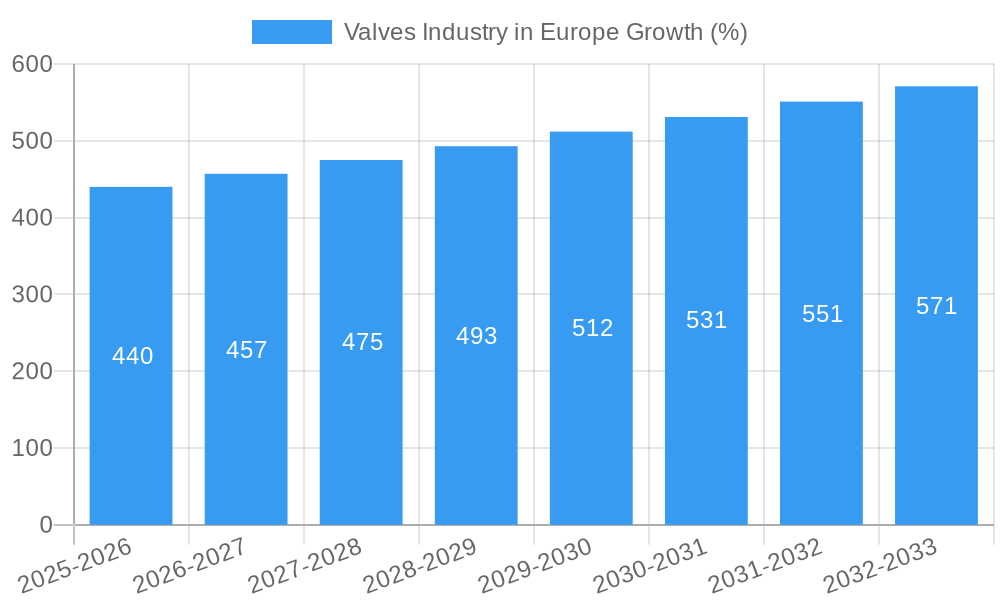
The European industrial valve market, valued at approximately €10 billion in 2025, is experiencing steady growth, projected to maintain a Compound Annual Growth Rate (CAGR) of 4.40% from 2025 to 2033. This expansion is fueled by several key drivers. Firstly, the ongoing investments in infrastructure projects across Europe, particularly in energy and water management, are significantly boosting demand for valves. Secondly, the increasing adoption of automation and digitalization in industrial processes is creating a need for advanced valve technologies offering enhanced control and efficiency. The rising focus on environmental sustainability also plays a crucial role, driving demand for valves that improve energy efficiency and reduce emissions in various industrial applications. Germany, France, and the United Kingdom represent the largest national markets within Europe, benefiting from established industrial bases and robust infrastructure development. However, growth is not uniform across all valve types. While ball and butterfly valves maintain a significant market share due to their widespread applicability, there's a notable rise in demand for specialized valves like control valves and those catering to specific industry requirements like the oil and gas sector. Competitive pressures from established players like Honeywell International Inc, Flowserve Corporation, and Emerson Electric Co, alongside emerging regional players, are shaping pricing and innovation within the market.
Despite this positive outlook, the market faces certain restraints. Fluctuations in raw material prices, particularly metals, can impact production costs and profitability. Furthermore, economic downturns or uncertainties within key end-user industries, such as construction and manufacturing, could dampen demand. To mitigate these challenges, manufacturers are increasingly focusing on developing cost-effective solutions, enhancing product durability, and offering tailored solutions to specific industry needs. The ongoing technological advancements and the growing demand for sustainable practices will continue to shape the future landscape of the European industrial valve market, presenting both opportunities and challenges for companies operating within this sector.
Valves Industry in Europe: A Comprehensive Market Analysis (2019-2033)
This in-depth report provides a comprehensive analysis of the European valves industry, covering market size, growth drivers, key players, and future outlook. The study period spans from 2019 to 2033, with 2025 serving as the base and estimated year. The report leverages extensive data and insights to offer actionable intelligence for industry stakeholders, investors, and strategic decision-makers.
Valves Industry in Europe Market Concentration & Innovation
The European valves market exhibits a moderately concentrated landscape, with several multinational corporations holding significant market share. Honeywell International Inc, Flowserve Corporation, and The Weir Group PLC are among the leading players, collectively accounting for an estimated xx% of the market in 2025. However, the presence of numerous smaller, specialized players ensures considerable competition, particularly in niche segments. Innovation is driven by increasing demand for energy efficiency, automation, and sustainable solutions. Stringent environmental regulations, particularly concerning emissions and water usage, are significant catalysts for the development of advanced valve technologies, such as smart valves with integrated sensors and remote monitoring capabilities. The market also witnesses considerable M&A activity, with deals primarily focused on expanding product portfolios, geographical reach, and technological capabilities. For instance, the USD 140 Million acquisition of Habonim by ITT Inc. in April 2022 exemplifies this trend. The average deal value in the past five years has been approximately USD xx Million. Product substitution is a moderate factor, with the emergence of alternative materials and designs impacting specific segments, particularly in the areas of corrosion resistance and durability. End-user trends towards automation and digitalization are driving the demand for sophisticated valves and control systems.
- Market Share (2025): Top 3 players – xx%
- Average M&A Deal Value (2019-2024): USD xx Million
- Key Innovation Drivers: Energy efficiency, automation, sustainability, environmental regulations.
Valves Industry in Europe Industry Trends & Insights
The European valves market is projected to experience a Compound Annual Growth Rate (CAGR) of xx% during the forecast period (2025-2033), driven by several key factors. Robust growth in the Oil & Gas, Chemicals, and Water & Wastewater sectors fuels high demand for valves, particularly in demanding applications. The increasing adoption of smart technologies, including the Internet of Things (IoT) and Industry 4.0 principles, is revolutionizing the industry, leading to increased automation and remote monitoring capabilities. Consumer preference is shifting toward high-performance, energy-efficient, and sustainable valve solutions. This preference is influenced by both environmental concerns and the desire for reduced operational costs. Market penetration of smart valves is projected to increase from xx% in 2025 to xx% by 2033. Competitive dynamics are characterized by intense rivalry among established players and the emergence of new entrants offering innovative solutions. This competitive landscape fosters innovation and drives price optimization, benefiting end-users. The market is also influenced by cyclical economic fluctuations, with periods of robust growth followed by periods of slower expansion, particularly influenced by large-scale infrastructure projects.
Dominant Markets & Segments in Valves Industry in Europe
By Type: The Gate/Globe/Check valve segment holds the largest market share, driven by its widespread applicability across various industries. Ball and Butterfly valves are also significant segments with robust growth prospects due to their ease of operation and cost-effectiveness.
By End-user Industry: The Oil & Gas sector remains the dominant end-user, followed closely by the Chemicals and Water & Wastewater sectors. Growth in these industries, driven by increased production and infrastructure development, significantly impacts the demand for valves.
By Country: The United Kingdom, Germany, and France represent the largest national markets, driven by robust industrial activities and extensive infrastructure networks. The Rest of Europe also exhibits significant growth potential.
Key Drivers: The United Kingdom's robust oil and gas sector and strong chemical production contribute to its dominance. Germany benefits from a strong manufacturing base and advanced industrial infrastructure. France's large water & wastewater management infrastructure drives demand within that segment.
Key Drivers (Bullet Points):
- UK: Oil & Gas, Chemical production, Infrastructure investments
- Germany: Manufacturing sector, strong industrial base, infrastructure modernization
- France: Water & Wastewater management, Energy sector investments
Valves Industry in Europe Product Developments
Recent product innovations focus on enhanced durability, improved performance, and increased automation capabilities. Smart valves with integrated sensors and remote monitoring features are gaining traction, enabling predictive maintenance and optimizing operational efficiency. The development of valves using advanced materials like corrosion-resistant alloys and lightweight composites enhances their lifespan and reduces maintenance costs. These innovations cater to the growing demand for efficient and sustainable solutions across various industries.
Report Scope & Segmentation Analysis
This report segments the European valves market by type (Ball, Butterfly, Gate/Globe/Check, Plug, Control, Other Types), end-user industry (Oil & Gas, Chemicals, Water & Wastewater, Power Generation, Mining, Other End-user Industries), and country (United Kingdom, Germany, France, Rest of Europe). Each segment's market size, growth projections, and competitive dynamics are comprehensively analyzed. Growth projections vary across segments, with the smart valve segment experiencing the most rapid expansion. Competitive dynamics are shaped by the presence of both established multinational corporations and specialized regional players.
Key Drivers of Valves Industry in Europe Growth
Several factors contribute to the growth of the European valves market. Increased investment in infrastructure projects, particularly in energy and water management, fuels demand. Technological advancements, including the adoption of smart valves and automation technologies, drive efficiency and reduce operational costs. Stringent environmental regulations necessitate the use of high-performance, energy-efficient valves, further stimulating market growth. The continued expansion of the Oil & Gas, Chemicals, and Water & Wastewater sectors provides a strong foundation for sustained growth.
Challenges in the Valves Industry in Europe Sector
The European valves industry faces several challenges, including fluctuating raw material prices which impact production costs. Supply chain disruptions, exacerbated by geopolitical events, pose significant risks to manufacturers. Intense competition from both established players and new entrants necessitates continuous innovation and cost optimization. Compliance with stringent environmental and safety regulations represents a significant operational cost.
Emerging Opportunities in Valves Industry in Europe
The growing adoption of Industry 4.0 principles, particularly the integration of IoT and digital technologies, creates significant opportunities. The increasing demand for sustainable and energy-efficient valve solutions presents a lucrative niche market. Expansion into emerging markets within Europe, particularly in Eastern Europe, offers untapped growth potential. The development of specialized valves for niche applications, such as high-pressure and cryogenic systems, holds significant promise.
Leading Players in the Valves Industry in Europe Market
- Honeywell International Inc
- Flowserve Corporation
- The Weir Group PLC
- Xylem Inc
- Hitachi Ltd
- Emerson Electric Co
- ITT INC
- AVK Holding A/S
- Danfoss A/S
- Schlumberger Limited
- Pentair PLC
- KITZ Corporation
Key Developments in Valves Industry in Europe Industry
- April 2022: ITT Inc. acquires Habonim for USD 140 Million, strengthening its position in the ball valve market and expanding its reach into harsh application segments.
Strategic Outlook for Valves Industry in Europe Market
The European valves market is poised for continued growth, driven by technological advancements, infrastructure development, and the increasing demand for sustainable solutions. The adoption of smart technologies and automation will redefine industry practices, while the focus on energy efficiency and environmental sustainability will shape future product development. The market’s dynamic competitive landscape will continue to foster innovation and offer considerable opportunities for both established and emerging players.
Valves Industry in Europe Segmentation
-
1. Type
- 1.1. Ball
- 1.2. Butterfly
- 1.3. Gate/Globe/Check
- 1.4. Plug
- 1.5. Control
- 1.6. Other Types
-
2. End-user Industry
- 2.1. Oil & Gas
- 2.2. Chemicals
- 2.3. Water & Wastewater
- 2.4. Power Generation
- 2.5. Mining
- 2.6. Other End-user Industries
Valves Industry in Europe Segmentation By Geography
-
1. Europe
- 1.1. United Kingdom
- 1.2. Germany
- 1.3. France
- 1.4. Italy
- 1.5. Spain
- 1.6. Russia
- 1.7. Benelux
- 1.8. Nordics
- 1.9. Rest of Europe

Valves Industry in Europe REPORT HIGHLIGHTS
| Aspects | Details |
|---|---|
| Study Period | 2019-2033 |
| Base Year | 2024 |
| Estimated Year | 2025 |
| Forecast Period | 2025-2033 |
| Historical Period | 2019-2024 |
| Growth Rate | CAGR of 4.40% from 2019-2033 |
| Segmentation |
|
Table of Contents
- 1. Introduction
- 1.1. Research Scope
- 1.2. Market Segmentation
- 1.3. Research Methodology
- 1.4. Definitions and Assumptions
- 2. Executive Summary
- 2.1. Introduction
- 3. Market Dynamics
- 3.1. Introduction
- 3.2. Market Drivers
- 3.2.1. Growing emphasis on Power and Water & Wastewater in Emerging Markets; Focus of End Users on Environmental Issues and Refurbishment of Aging Infrastructure to Stay Competitive
- 3.3. Market Restrains
- 3.3.1. High Cost of Microplate Systems
- 3.4. Market Trends
- 3.4.1. Control Valves to Hold a Significant Market Share
- 4. Market Factor Analysis
- 4.1. Porters Five Forces
- 4.2. Supply/Value Chain
- 4.3. PESTEL analysis
- 4.4. Market Entropy
- 4.5. Patent/Trademark Analysis
- 5. Valves Industry in Europe Analysis, Insights and Forecast, 2019-2031
- 5.1. Market Analysis, Insights and Forecast - by Type
- 5.1.1. Ball
- 5.1.2. Butterfly
- 5.1.3. Gate/Globe/Check
- 5.1.4. Plug
- 5.1.5. Control
- 5.1.6. Other Types
- 5.2. Market Analysis, Insights and Forecast - by End-user Industry
- 5.2.1. Oil & Gas
- 5.2.2. Chemicals
- 5.2.3. Water & Wastewater
- 5.2.4. Power Generation
- 5.2.5. Mining
- 5.2.6. Other End-user Industries
- 5.3. Market Analysis, Insights and Forecast - by Region
- 5.3.1. Europe
- 5.1. Market Analysis, Insights and Forecast - by Type
- 6. Germany Valves Industry in Europe Analysis, Insights and Forecast, 2019-2031
- 7. France Valves Industry in Europe Analysis, Insights and Forecast, 2019-2031
- 8. Italy Valves Industry in Europe Analysis, Insights and Forecast, 2019-2031
- 9. United Kingdom Valves Industry in Europe Analysis, Insights and Forecast, 2019-2031
- 10. Netherlands Valves Industry in Europe Analysis, Insights and Forecast, 2019-2031
- 11. Sweden Valves Industry in Europe Analysis, Insights and Forecast, 2019-2031
- 12. Rest of Europe Valves Industry in Europe Analysis, Insights and Forecast, 2019-2031
- 13. Competitive Analysis
- 13.1. Market Share Analysis 2024
- 13.2. Company Profiles
- 13.2.1 Honeywell International Inc
- 13.2.1.1. Overview
- 13.2.1.2. Products
- 13.2.1.3. SWOT Analysis
- 13.2.1.4. Recent Developments
- 13.2.1.5. Financials (Based on Availability)
- 13.2.2 Flowserve Corporation
- 13.2.2.1. Overview
- 13.2.2.2. Products
- 13.2.2.3. SWOT Analysis
- 13.2.2.4. Recent Developments
- 13.2.2.5. Financials (Based on Availability)
- 13.2.3 The Weir Group PLC
- 13.2.3.1. Overview
- 13.2.3.2. Products
- 13.2.3.3. SWOT Analysis
- 13.2.3.4. Recent Developments
- 13.2.3.5. Financials (Based on Availability)
- 13.2.4 Xylem Inc
- 13.2.4.1. Overview
- 13.2.4.2. Products
- 13.2.4.3. SWOT Analysis
- 13.2.4.4. Recent Developments
- 13.2.4.5. Financials (Based on Availability)
- 13.2.5 Hitachi Ltd
- 13.2.5.1. Overview
- 13.2.5.2. Products
- 13.2.5.3. SWOT Analysis
- 13.2.5.4. Recent Developments
- 13.2.5.5. Financials (Based on Availability)
- 13.2.6 Emerson Electric Co
- 13.2.6.1. Overview
- 13.2.6.2. Products
- 13.2.6.3. SWOT Analysis
- 13.2.6.4. Recent Developments
- 13.2.6.5. Financials (Based on Availability)
- 13.2.7 ITT INC
- 13.2.7.1. Overview
- 13.2.7.2. Products
- 13.2.7.3. SWOT Analysis
- 13.2.7.4. Recent Developments
- 13.2.7.5. Financials (Based on Availability)
- 13.2.8 AVK Holding A/S
- 13.2.8.1. Overview
- 13.2.8.2. Products
- 13.2.8.3. SWOT Analysis
- 13.2.8.4. Recent Developments
- 13.2.8.5. Financials (Based on Availability)
- 13.2.9 Danfoss A/S
- 13.2.9.1. Overview
- 13.2.9.2. Products
- 13.2.9.3. SWOT Analysis
- 13.2.9.4. Recent Developments
- 13.2.9.5. Financials (Based on Availability)
- 13.2.10 Schlumberger Limited
- 13.2.10.1. Overview
- 13.2.10.2. Products
- 13.2.10.3. SWOT Analysis
- 13.2.10.4. Recent Developments
- 13.2.10.5. Financials (Based on Availability)
- 13.2.11 Pentair PLC
- 13.2.11.1. Overview
- 13.2.11.2. Products
- 13.2.11.3. SWOT Analysis
- 13.2.11.4. Recent Developments
- 13.2.11.5. Financials (Based on Availability)
- 13.2.12 KITZ Corporation
- 13.2.12.1. Overview
- 13.2.12.2. Products
- 13.2.12.3. SWOT Analysis
- 13.2.12.4. Recent Developments
- 13.2.12.5. Financials (Based on Availability)
- 13.2.1 Honeywell International Inc
List of Figures
- Figure 1: Valves Industry in Europe Revenue Breakdown (Million, %) by Product 2024 & 2032
- Figure 2: Valves Industry in Europe Share (%) by Company 2024
List of Tables
- Table 1: Valves Industry in Europe Revenue Million Forecast, by Region 2019 & 2032
- Table 2: Valves Industry in Europe Volume K Unit Forecast, by Region 2019 & 2032
- Table 3: Valves Industry in Europe Revenue Million Forecast, by Type 2019 & 2032
- Table 4: Valves Industry in Europe Volume K Unit Forecast, by Type 2019 & 2032
- Table 5: Valves Industry in Europe Revenue Million Forecast, by End-user Industry 2019 & 2032
- Table 6: Valves Industry in Europe Volume K Unit Forecast, by End-user Industry 2019 & 2032
- Table 7: Valves Industry in Europe Revenue Million Forecast, by Region 2019 & 2032
- Table 8: Valves Industry in Europe Volume K Unit Forecast, by Region 2019 & 2032
- Table 9: Valves Industry in Europe Revenue Million Forecast, by Country 2019 & 2032
- Table 10: Valves Industry in Europe Volume K Unit Forecast, by Country 2019 & 2032
- Table 11: Germany Valves Industry in Europe Revenue (Million) Forecast, by Application 2019 & 2032
- Table 12: Germany Valves Industry in Europe Volume (K Unit) Forecast, by Application 2019 & 2032
- Table 13: France Valves Industry in Europe Revenue (Million) Forecast, by Application 2019 & 2032
- Table 14: France Valves Industry in Europe Volume (K Unit) Forecast, by Application 2019 & 2032
- Table 15: Italy Valves Industry in Europe Revenue (Million) Forecast, by Application 2019 & 2032
- Table 16: Italy Valves Industry in Europe Volume (K Unit) Forecast, by Application 2019 & 2032
- Table 17: United Kingdom Valves Industry in Europe Revenue (Million) Forecast, by Application 2019 & 2032
- Table 18: United Kingdom Valves Industry in Europe Volume (K Unit) Forecast, by Application 2019 & 2032
- Table 19: Netherlands Valves Industry in Europe Revenue (Million) Forecast, by Application 2019 & 2032
- Table 20: Netherlands Valves Industry in Europe Volume (K Unit) Forecast, by Application 2019 & 2032
- Table 21: Sweden Valves Industry in Europe Revenue (Million) Forecast, by Application 2019 & 2032
- Table 22: Sweden Valves Industry in Europe Volume (K Unit) Forecast, by Application 2019 & 2032
- Table 23: Rest of Europe Valves Industry in Europe Revenue (Million) Forecast, by Application 2019 & 2032
- Table 24: Rest of Europe Valves Industry in Europe Volume (K Unit) Forecast, by Application 2019 & 2032
- Table 25: Valves Industry in Europe Revenue Million Forecast, by Type 2019 & 2032
- Table 26: Valves Industry in Europe Volume K Unit Forecast, by Type 2019 & 2032
- Table 27: Valves Industry in Europe Revenue Million Forecast, by End-user Industry 2019 & 2032
- Table 28: Valves Industry in Europe Volume K Unit Forecast, by End-user Industry 2019 & 2032
- Table 29: Valves Industry in Europe Revenue Million Forecast, by Country 2019 & 2032
- Table 30: Valves Industry in Europe Volume K Unit Forecast, by Country 2019 & 2032
- Table 31: United Kingdom Valves Industry in Europe Revenue (Million) Forecast, by Application 2019 & 2032
- Table 32: United Kingdom Valves Industry in Europe Volume (K Unit) Forecast, by Application 2019 & 2032
- Table 33: Germany Valves Industry in Europe Revenue (Million) Forecast, by Application 2019 & 2032
- Table 34: Germany Valves Industry in Europe Volume (K Unit) Forecast, by Application 2019 & 2032
- Table 35: France Valves Industry in Europe Revenue (Million) Forecast, by Application 2019 & 2032
- Table 36: France Valves Industry in Europe Volume (K Unit) Forecast, by Application 2019 & 2032
- Table 37: Italy Valves Industry in Europe Revenue (Million) Forecast, by Application 2019 & 2032
- Table 38: Italy Valves Industry in Europe Volume (K Unit) Forecast, by Application 2019 & 2032
- Table 39: Spain Valves Industry in Europe Revenue (Million) Forecast, by Application 2019 & 2032
- Table 40: Spain Valves Industry in Europe Volume (K Unit) Forecast, by Application 2019 & 2032
- Table 41: Russia Valves Industry in Europe Revenue (Million) Forecast, by Application 2019 & 2032
- Table 42: Russia Valves Industry in Europe Volume (K Unit) Forecast, by Application 2019 & 2032
- Table 43: Benelux Valves Industry in Europe Revenue (Million) Forecast, by Application 2019 & 2032
- Table 44: Benelux Valves Industry in Europe Volume (K Unit) Forecast, by Application 2019 & 2032
- Table 45: Nordics Valves Industry in Europe Revenue (Million) Forecast, by Application 2019 & 2032
- Table 46: Nordics Valves Industry in Europe Volume (K Unit) Forecast, by Application 2019 & 2032
- Table 47: Rest of Europe Valves Industry in Europe Revenue (Million) Forecast, by Application 2019 & 2032
- Table 48: Rest of Europe Valves Industry in Europe Volume (K Unit) Forecast, by Application 2019 & 2032
Frequently Asked Questions
1. What is the projected Compound Annual Growth Rate (CAGR) of the Valves Industry in Europe?
The projected CAGR is approximately 4.40%.
2. Which companies are prominent players in the Valves Industry in Europe?
Key companies in the market include Honeywell International Inc, Flowserve Corporation, The Weir Group PLC, Xylem Inc, Hitachi Ltd, Emerson Electric Co, ITT INC, AVK Holding A/S, Danfoss A/S, Schlumberger Limited, Pentair PLC, KITZ Corporation.
3. What are the main segments of the Valves Industry in Europe?
The market segments include Type, End-user Industry.
4. Can you provide details about the market size?
The market size is estimated to be USD XX Million as of 2022.
5. What are some drivers contributing to market growth?
Growing emphasis on Power and Water & Wastewater in Emerging Markets; Focus of End Users on Environmental Issues and Refurbishment of Aging Infrastructure to Stay Competitive.
6. What are the notable trends driving market growth?
Control Valves to Hold a Significant Market Share.
7. Are there any restraints impacting market growth?
High Cost of Microplate Systems.
8. Can you provide examples of recent developments in the market?
April 2022 - ITT Inc announced that the company had acquired Habonim, a provider of industrial valves and actuators, for USD 140 million. Habonim will become part of ITT's Industrial Process (IP) segment. The company's complementary ball valve offering and focus on harsh applications in attractive end-user markets will drive stronger sales growth for Industrial Process and ITT over the long term.
9. What pricing options are available for accessing the report?
Pricing options include single-user, multi-user, and enterprise licenses priced at USD 4750, USD 4950, and USD 6800 respectively.
10. Is the market size provided in terms of value or volume?
The market size is provided in terms of value, measured in Million and volume, measured in K Unit.
11. Are there any specific market keywords associated with the report?
Yes, the market keyword associated with the report is "Valves Industry in Europe," which aids in identifying and referencing the specific market segment covered.
12. How do I determine which pricing option suits my needs best?
The pricing options vary based on user requirements and access needs. Individual users may opt for single-user licenses, while businesses requiring broader access may choose multi-user or enterprise licenses for cost-effective access to the report.
13. Are there any additional resources or data provided in the Valves Industry in Europe report?
While the report offers comprehensive insights, it's advisable to review the specific contents or supplementary materials provided to ascertain if additional resources or data are available.
14. How can I stay updated on further developments or reports in the Valves Industry in Europe?
To stay informed about further developments, trends, and reports in the Valves Industry in Europe, consider subscribing to industry newsletters, following relevant companies and organizations, or regularly checking reputable industry news sources and publications.
Methodology
Step 1 - Identification of Relevant Samples Size from Population Database


Step 2 - Approaches for Defining Global Market Size (Value, Volume* & Price*)

Note*: In applicable scenarios
Step 3 - Data Sources
Primary Research
- Web Analytics
- Survey Reports
- Research Institute
- Latest Research Reports
- Opinion Leaders
Secondary Research
- Annual Reports
- White Paper
- Latest Press Release
- Industry Association
- Paid Database
- Investor Presentations

Step 4 - Data Triangulation
Involves using different sources of information in order to increase the validity of a study
These sources are likely to be stakeholders in a program - participants, other researchers, program staff, other community members, and so on.
Then we put all data in single framework & apply various statistical tools to find out the dynamic on the market.
During the analysis stage, feedback from the stakeholder groups would be compared to determine areas of agreement as well as areas of divergence


