

Key Insights
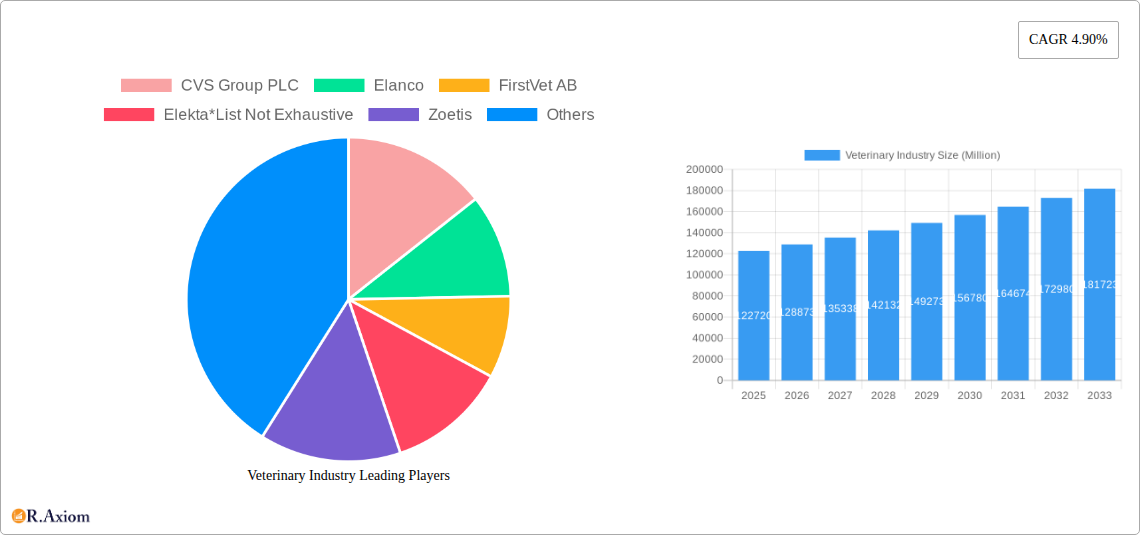
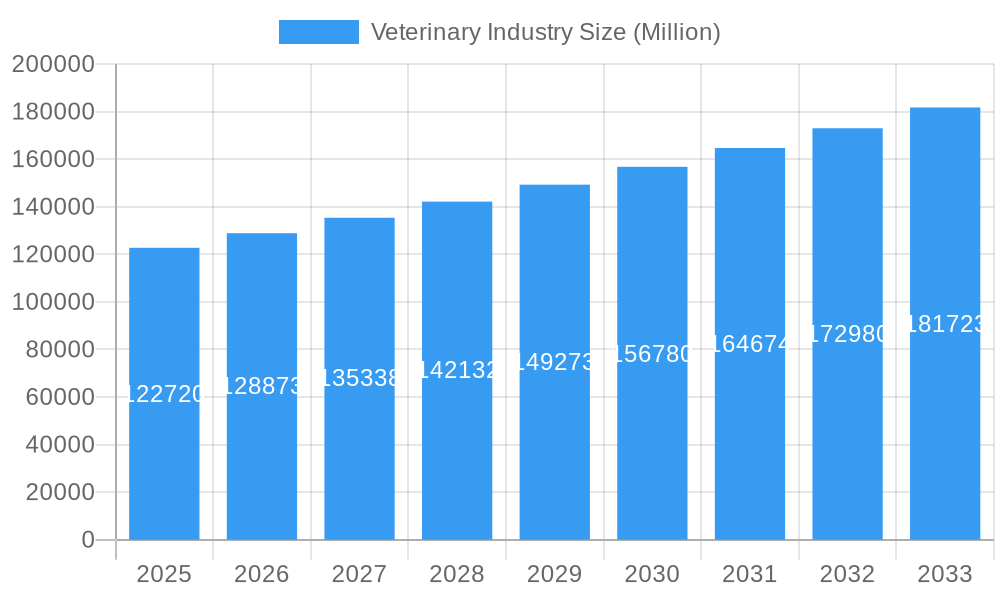
The global veterinary industry, valued at $122.72 billion in 2025, is experiencing robust growth, projected to expand at a compound annual growth rate (CAGR) of 4.90% from 2025 to 2033. This expansion is driven by several key factors. Firstly, increasing pet ownership globally, coupled with rising pet humanization, fuels demand for advanced veterinary services and premium pet care products. Secondly, technological advancements, such as sophisticated diagnostic imaging, minimally invasive surgical techniques, and telehealth platforms, are enhancing the quality and efficiency of veterinary care, contributing significantly to market growth. Furthermore, the growing awareness of animal health and welfare among consumers, combined with increased disposable incomes in developing economies, further propels market expansion. While rising costs associated with veterinary care and potential regulatory hurdles might pose some challenges, the overall market outlook remains positive. The market segmentation reveals strong growth potential across diverse service lines, including surgery, diagnostic tests and imaging, and physical health monitoring. The companion animal segment significantly contributes to the overall market value, but the farm animal segment presents a substantial and growing opportunity as farmers increasingly prioritize animal health for increased productivity and profitability. Major players such as Zoetis, Idexx Laboratories, and others are investing heavily in research and development, expanding their service portfolios and geographic reach, thereby further shaping the industry's growth trajectory.
Veterinary Industry Market Size (In Billion)
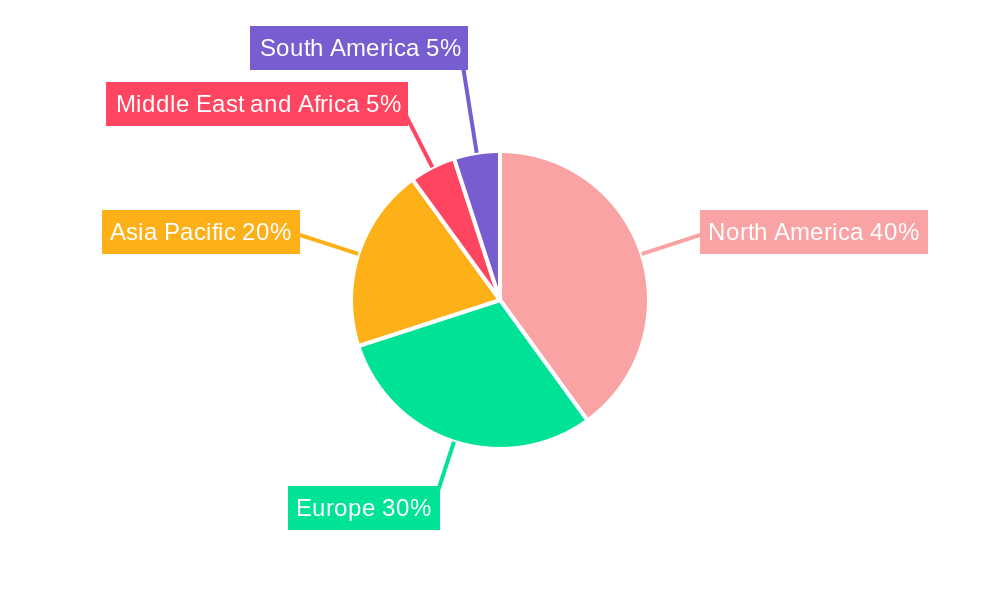
The geographical distribution of market share indicates significant contributions from North America and Europe. However, rapidly developing economies in Asia Pacific, particularly China and India, present lucrative opportunities for future growth due to increasing pet ownership and investment in veterinary infrastructure. The Middle East and Africa, and South America also present substantial, albeit currently smaller, potential for future expansion. Overall, the Veterinary market is poised for continued expansion, propelled by a confluence of factors that highlight the evolving human-animal bond and the growing importance of animal health globally. The industry is likely to see consolidation as larger players acquire smaller companies and integrate new technologies to improve efficiencies and optimize service offerings.
Veterinary Industry Company Market Share
Veterinary Industry Market Report: 2019-2033
This comprehensive report provides an in-depth analysis of the global veterinary industry, encompassing market size, segmentation, growth drivers, challenges, and key players. The study period covers 2019-2033, with 2025 as the base and estimated year. The forecast period is 2025-2033, and the historical period is 2019-2024. The report offers actionable insights for industry stakeholders, including veterinary service providers, pharmaceutical companies, and investors. The total market value is predicted to reach xx Million by 2033.
Veterinary Industry Market Concentration & Innovation
The veterinary industry is characterized by a dynamic interplay of established players and emerging companies, leading to a moderately concentrated market. Major players such as Zoetis and Idexx Laboratories hold significant market share, but the landscape is increasingly fragmented due to the entry of smaller, specialized firms. Market concentration is influenced by factors like M&A activity, technological innovation, and regulatory changes.
- Market Share: Zoetis and Idexx Laboratories collectively hold an estimated xx% market share in 2025, while the remaining share is distributed across numerous companies, including CVS Group PLC, Elanco, and others.
- M&A Activity: The industry has witnessed significant consolidation in recent years, with deal values exceeding xx Million in the past five years. These mergers and acquisitions are driven by the desire to expand product portfolios, geographic reach, and technological capabilities. For example, the merger between [Company A] and [Company B] in [Year] resulted in a combined market value of xx Million.
- Innovation Drivers: Technological advancements, particularly in diagnostics and therapeutics, are key innovation drivers. The development of novel drugs, advanced imaging techniques, and telemedicine platforms are reshaping the industry.
- Regulatory Frameworks: Stringent regulatory requirements for veterinary drugs and devices influence innovation and market entry. Compliance with these regulations significantly impacts the time-to-market for new products and services.
- Product Substitutes: The availability of generic drugs and alternative treatment methods presents a competitive challenge to established players. Companies are focusing on developing differentiated products and services to maintain market share.
- End-User Trends: Growing pet ownership and increasing pet humanization are driving demand for premium veterinary services.
Veterinary Industry Industry Trends & Insights
The global veterinary industry is experiencing robust growth, driven by several key factors. The compound annual growth rate (CAGR) is projected to be xx% during the forecast period (2025-2033). This growth is fueled by several factors including rising pet ownership, increasing pet humanization, advancements in veterinary medicine, and the expansion of veterinary services into new geographical areas. The market penetration of advanced diagnostic tools and treatment modalities is also contributing to market expansion. Technological advancements like telemedicine are transforming access to veterinary care, while increased consumer awareness regarding pet health is driving demand for premium services. Competitive dynamics are characterized by both collaboration and competition, with companies focusing on developing innovative products, expanding service offerings, and establishing strong distribution networks.
Dominant Markets & Segments in Veterinary Industry
The companion animal segment dominates the veterinary market, accounting for the largest share of revenue. This segment is further driven by the rising humanization of pets and increased spending on pet healthcare. The North American region is the leading market due to high pet ownership rates and sophisticated healthcare infrastructure. Within services, diagnostic testing and imaging are the fastest-growing segments due to technological advances and increased demand for early disease detection.
- Key Drivers for Companion Animal Segment:
- Rising pet ownership and humanization of pets.
- Increased disposable incomes leading to higher spending on pet healthcare.
- Growing adoption of pet insurance.
- Key Drivers for Farm Animal Segment:
- Increasing demand for meat and dairy products.
- Government initiatives to improve livestock health and productivity.
- Advancements in animal breeding and husbandry techniques.
- Dominant Service Segments: Diagnostic tests and imaging exhibit robust growth due to technological advancements and early disease detection needs. Surgery is a significant segment, with specialized procedures driving growth. Physical health monitoring is also growing due to the increased need for preventative care and remote monitoring solutions.
Veterinary Industry Product Developments
Recent product innovations focus on advanced diagnostics (e.g., Hacarus Inc.'s ECG platform), minimally invasive surgical techniques, and personalized medicine approaches. These developments aim to improve treatment outcomes, reduce costs, and enhance animal welfare. The market emphasizes user-friendly diagnostic tools and accessible treatment solutions that align with evolving veterinary practices and consumer preferences.
Report Scope & Segmentation Analysis
This report segments the veterinary industry by service type (surgery, diagnostic tests and imaging, physical health monitoring, other services) and animal type (companion animals, farm animals). Each segment is analyzed based on market size, growth rate, and competitive dynamics. For instance, the diagnostic testing and imaging segment is projected to grow at a CAGR of xx% due to the adoption of advanced technologies, while the companion animal segment continues to dominate the market, fueled by increased pet ownership and spending.
Key Drivers of Veterinary Industry Growth
Several factors drive growth, including the increasing humanization of pets, leading to higher healthcare spending; technological advancements in diagnostics and treatments; rising pet ownership, particularly in developing economies; and supportive government policies promoting animal health and welfare. The implementation of mobile veterinary clinics, as seen in Andhra Pradesh's initiative, further expands access to care.
Challenges in the Veterinary Industry Sector
Challenges include the high cost of advanced veterinary care, potentially limiting access for some pet owners; regulatory hurdles in the development and approval of new drugs and therapies; supply chain disruptions affecting the availability of medicines and equipment; and intense competition among veterinary service providers. These challenges necessitate strategic adaptation and innovation within the industry.
Emerging Opportunities in Veterinary Industry
Emerging opportunities include the growing demand for telehealth services for remote pet health monitoring; the development of personalized medicine approaches tailored to individual animal needs; the expansion into emerging markets with increasing pet ownership; and the integration of artificial intelligence and machine learning for improved diagnostics and treatment.
Leading Players in the Veterinary Industry Market
- CVS Group PLC
- Elanco
- FirstVet AB
- Elekta
- Zoetis
- CityVet Inc
- Kremer Veterinary Services
- Ethos Veterinary Health
- Torigen Pharmaceuticals Inc
- Karyopharm Therapeutics Inc
- ELIAS Animal Health
- Greencross Limited
- Armor Animal Health (Animart)
- Mars Inc
- Idexx laboratories
Key Developments in Veterinary Industry Industry
- May 2022: Launch of 175 Mobile Ambulatory Veterinary Clinics (MAVCs) in Andhra Pradesh, India, signifying improved accessibility to veterinary services. The planned expansion to 340 clinics demonstrates a significant commitment to rural animal healthcare.
- March 2022: Hacarus Inc. and DS Pharma Animal Health launched an ECG platform for early detection of canine heart disease, highlighting advancements in diagnostic technology and a growing focus on preventative care.
Strategic Outlook for Veterinary Industry Market
The veterinary industry is poised for continued growth, driven by technological advancements, increasing pet ownership, and a heightened focus on animal health and welfare. Opportunities lie in expanding access to care, particularly in underserved areas, and developing innovative products and services that meet the evolving needs of pet owners and veterinary professionals. The market's future hinges on adapting to technological disruptions and effectively addressing emerging challenges.
Veterinary Industry Segmentation
-
1. Service
- 1.1. Surgery
- 1.2. Diagnostic Tests and Imaging
- 1.3. Physical Health Monitoring
- 1.4. Other Services
-
2. Animal Type
- 2.1. Companion Animal
- 2.2. Farm Animal
Veterinary Industry Segmentation By Geography
-
1. North America
- 1.1. United States
- 1.2. Canada
- 1.3. Mexico
-
2. Europe
- 2.1. Germany
- 2.2. United Kingdom
- 2.3. France
- 2.4. Italy
- 2.5. Spain
- 2.6. Rest of Europe
-
3. Asia Pacific
- 3.1. China
- 3.2. Japan
- 3.3. India
- 3.4. Australia
- 3.5. South Korea
- 3.6. Rest of Asia Pacific
-
4. Middle East and Africa
- 4.1. GCC
- 4.2. South Africa
- 4.3. Rest of Middle East and Africa
-
5. South America
- 5.1. Brazil
- 5.2. Argentina
- 5.3. Rest of South America
Veterinary Industry Regional Market Share
Geographic Coverage of Veterinary Industry
Veterinary Industry REPORT HIGHLIGHTS
| Aspects | Details |
|---|---|
| Study Period | 2020-2034 |
| Base Year | 2025 |
| Estimated Year | 2026 |
| Forecast Period | 2026-2034 |
| Historical Period | 2020-2025 |
| Growth Rate | CAGR of 4.90% from 2020-2034 |
| Segmentation |
|
Table of Contents
- 1. Introduction
- 1.1. Research Scope
- 1.2. Market Segmentation
- 1.3. Research Objective
- 1.4. Definitions and Assumptions
- 2. Executive Summary
- 2.1. Market Snapshot
- 3. Market Dynamics
- 3.1. Market Drivers
- 3.2. Market Restrains
- 3.3. Market Trends
- 3.4. Market Opportunities
- 4. Market Factor Analysis
- 4.1. Porters Five Forces
- 4.1.1. Bargaining Power of Suppliers
- 4.1.2. Bargaining Power of Buyers
- 4.1.3. Threat of New Entrants
- 4.1.4. Threat of Substitutes
- 4.1.5. Competitive Rivalry
- 4.2. PESTEL analysis
- 4.3. BCG Analysis
- 4.3.1. Stars (High Growth, High Market Share)
- 4.3.2. Cash Cows (Low Growth, High Market Share)
- 4.3.3. Question Mark (High Growth, Low Market Share)
- 4.3.4. Dogs (Low Growth, Low Market Share)
- 4.4. Ansoff Matrix Analysis
- 4.5. Supply Chain Analysis
- 4.6. Regulatory Landscape
- 4.7. Current Market Potential and Opportunity Assessment (TAM–SAM–SOM Framework)
- 4.8. RAX Analyst Note
- 4.1. Porters Five Forces
- 5. Market Analysis, Insights and Forecast 2021-2033
- 5.1. Market Analysis, Insights and Forecast - by Service
- 5.1.1. Surgery
- 5.1.2. Diagnostic Tests and Imaging
- 5.1.3. Physical Health Monitoring
- 5.1.4. Other Services
- 5.2. Market Analysis, Insights and Forecast - by Animal Type
- 5.2.1. Companion Animal
- 5.2.2. Farm Animal
- 5.3. Market Analysis, Insights and Forecast - by Region
- 5.3.1. North America
- 5.3.2. Europe
- 5.3.3. Asia Pacific
- 5.3.4. Middle East and Africa
- 5.3.5. South America
- 5.1. Market Analysis, Insights and Forecast - by Service
- 6. Global Veterinary Industry Analysis, Insights and Forecast, 2021-2033
- 6.1. Market Analysis, Insights and Forecast - by Service
- 6.1.1. Surgery
- 6.1.2. Diagnostic Tests and Imaging
- 6.1.3. Physical Health Monitoring
- 6.1.4. Other Services
- 6.2. Market Analysis, Insights and Forecast - by Animal Type
- 6.2.1. Companion Animal
- 6.2.2. Farm Animal
- 6.1. Market Analysis, Insights and Forecast - by Service
- 7. North America Veterinary Industry Analysis, Insights and Forecast, 2020-2032
- 7.1. Market Analysis, Insights and Forecast - by Service
- 7.1.1. Surgery
- 7.1.2. Diagnostic Tests and Imaging
- 7.1.3. Physical Health Monitoring
- 7.1.4. Other Services
- 7.2. Market Analysis, Insights and Forecast - by Animal Type
- 7.2.1. Companion Animal
- 7.2.2. Farm Animal
- 7.1. Market Analysis, Insights and Forecast - by Service
- 8. Europe Veterinary Industry Analysis, Insights and Forecast, 2020-2032
- 8.1. Market Analysis, Insights and Forecast - by Service
- 8.1.1. Surgery
- 8.1.2. Diagnostic Tests and Imaging
- 8.1.3. Physical Health Monitoring
- 8.1.4. Other Services
- 8.2. Market Analysis, Insights and Forecast - by Animal Type
- 8.2.1. Companion Animal
- 8.2.2. Farm Animal
- 8.1. Market Analysis, Insights and Forecast - by Service
- 9. Asia Pacific Veterinary Industry Analysis, Insights and Forecast, 2020-2032
- 9.1. Market Analysis, Insights and Forecast - by Service
- 9.1.1. Surgery
- 9.1.2. Diagnostic Tests and Imaging
- 9.1.3. Physical Health Monitoring
- 9.1.4. Other Services
- 9.2. Market Analysis, Insights and Forecast - by Animal Type
- 9.2.1. Companion Animal
- 9.2.2. Farm Animal
- 9.1. Market Analysis, Insights and Forecast - by Service
- 10. Middle East and Africa Veterinary Industry Analysis, Insights and Forecast, 2020-2032
- 10.1. Market Analysis, Insights and Forecast - by Service
- 10.1.1. Surgery
- 10.1.2. Diagnostic Tests and Imaging
- 10.1.3. Physical Health Monitoring
- 10.1.4. Other Services
- 10.2. Market Analysis, Insights and Forecast - by Animal Type
- 10.2.1. Companion Animal
- 10.2.2. Farm Animal
- 10.1. Market Analysis, Insights and Forecast - by Service
- 11. South America Veterinary Industry Analysis, Insights and Forecast, 2020-2032
- 11.1. Market Analysis, Insights and Forecast - by Service
- 11.1.1. Surgery
- 11.1.2. Diagnostic Tests and Imaging
- 11.1.3. Physical Health Monitoring
- 11.1.4. Other Services
- 11.2. Market Analysis, Insights and Forecast - by Animal Type
- 11.2.1. Companion Animal
- 11.2.2. Farm Animal
- 11.1. Market Analysis, Insights and Forecast - by Service
- 12. Competitive Analysis
- 12.1. Company Profiles
- 12.1.1 CVS Group PLC
- 12.1.1.1. Company Overview
- 12.1.1.2. Products
- 12.1.1.3. Company Financials
- 12.1.1.4. SWOT Analysis
- 12.1.2 Elanco
- 12.1.2.1. Company Overview
- 12.1.2.2. Products
- 12.1.2.3. Company Financials
- 12.1.2.4. SWOT Analysis
- 12.1.3 FirstVet AB
- 12.1.3.1. Company Overview
- 12.1.3.2. Products
- 12.1.3.3. Company Financials
- 12.1.3.4. SWOT Analysis
- 12.1.4 Elekta*List Not Exhaustive
- 12.1.4.1. Company Overview
- 12.1.4.2. Products
- 12.1.4.3. Company Financials
- 12.1.4.4. SWOT Analysis
- 12.1.5 Zoetis
- 12.1.5.1. Company Overview
- 12.1.5.2. Products
- 12.1.5.3. Company Financials
- 12.1.5.4. SWOT Analysis
- 12.1.6 CityVet Inc
- 12.1.6.1. Company Overview
- 12.1.6.2. Products
- 12.1.6.3. Company Financials
- 12.1.6.4. SWOT Analysis
- 12.1.7 Kremer Veterinary Services
- 12.1.7.1. Company Overview
- 12.1.7.2. Products
- 12.1.7.3. Company Financials
- 12.1.7.4. SWOT Analysis
- 12.1.8 Ethos Veterinary Health
- 12.1.8.1. Company Overview
- 12.1.8.2. Products
- 12.1.8.3. Company Financials
- 12.1.8.4. SWOT Analysis
- 12.1.9 Torigen Pharmaceuticals Inc
- 12.1.9.1. Company Overview
- 12.1.9.2. Products
- 12.1.9.3. Company Financials
- 12.1.9.4. SWOT Analysis
- 12.1.10 Karyopharm Therapeutics Inc
- 12.1.10.1. Company Overview
- 12.1.10.2. Products
- 12.1.10.3. Company Financials
- 12.1.10.4. SWOT Analysis
- 12.1.11 ELIAS Animal Health
- 12.1.11.1. Company Overview
- 12.1.11.2. Products
- 12.1.11.3. Company Financials
- 12.1.11.4. SWOT Analysis
- 12.1.12 Greencross Limited
- 12.1.12.1. Company Overview
- 12.1.12.2. Products
- 12.1.12.3. Company Financials
- 12.1.12.4. SWOT Analysis
- 12.1.13 Armor Animal Health (Animart)
- 12.1.13.1. Company Overview
- 12.1.13.2. Products
- 12.1.13.3. Company Financials
- 12.1.13.4. SWOT Analysis
- 12.1.14 Mars Inc
- 12.1.14.1. Company Overview
- 12.1.14.2. Products
- 12.1.14.3. Company Financials
- 12.1.14.4. SWOT Analysis
- 12.1.15 Idexx laboratories
- 12.1.15.1. Company Overview
- 12.1.15.2. Products
- 12.1.15.3. Company Financials
- 12.1.15.4. SWOT Analysis
- 12.1.1 CVS Group PLC
- 12.2. Market Entropy
- 12.2.1 Company's Key Areas Served
- 12.2.2 Recent Developments
- 12.3. Company Market Share Analysis 2025
- 12.3.1 Top 5 Companies Market Share Analysis
- 12.3.2 Top 3 Companies Market Share Analysis
- 12.4. List of Potential Customers
- 13. Research Methodology
List of Figures
- Figure 1: Global Veterinary Industry Revenue Breakdown (Million, %) by Region 2025 & 2033
- Figure 2: North America Veterinary Industry Revenue (Million), by Service 2025 & 2033
- Figure 3: North America Veterinary Industry Revenue Share (%), by Service 2025 & 2033
- Figure 4: North America Veterinary Industry Revenue (Million), by Animal Type 2025 & 2033
- Figure 5: North America Veterinary Industry Revenue Share (%), by Animal Type 2025 & 2033
- Figure 6: North America Veterinary Industry Revenue (Million), by Country 2025 & 2033
- Figure 7: North America Veterinary Industry Revenue Share (%), by Country 2025 & 2033
- Figure 8: Europe Veterinary Industry Revenue (Million), by Service 2025 & 2033
- Figure 9: Europe Veterinary Industry Revenue Share (%), by Service 2025 & 2033
- Figure 10: Europe Veterinary Industry Revenue (Million), by Animal Type 2025 & 2033
- Figure 11: Europe Veterinary Industry Revenue Share (%), by Animal Type 2025 & 2033
- Figure 12: Europe Veterinary Industry Revenue (Million), by Country 2025 & 2033
- Figure 13: Europe Veterinary Industry Revenue Share (%), by Country 2025 & 2033
- Figure 14: Asia Pacific Veterinary Industry Revenue (Million), by Service 2025 & 2033
- Figure 15: Asia Pacific Veterinary Industry Revenue Share (%), by Service 2025 & 2033
- Figure 16: Asia Pacific Veterinary Industry Revenue (Million), by Animal Type 2025 & 2033
- Figure 17: Asia Pacific Veterinary Industry Revenue Share (%), by Animal Type 2025 & 2033
- Figure 18: Asia Pacific Veterinary Industry Revenue (Million), by Country 2025 & 2033
- Figure 19: Asia Pacific Veterinary Industry Revenue Share (%), by Country 2025 & 2033
- Figure 20: Middle East and Africa Veterinary Industry Revenue (Million), by Service 2025 & 2033
- Figure 21: Middle East and Africa Veterinary Industry Revenue Share (%), by Service 2025 & 2033
- Figure 22: Middle East and Africa Veterinary Industry Revenue (Million), by Animal Type 2025 & 2033
- Figure 23: Middle East and Africa Veterinary Industry Revenue Share (%), by Animal Type 2025 & 2033
- Figure 24: Middle East and Africa Veterinary Industry Revenue (Million), by Country 2025 & 2033
- Figure 25: Middle East and Africa Veterinary Industry Revenue Share (%), by Country 2025 & 2033
- Figure 26: South America Veterinary Industry Revenue (Million), by Service 2025 & 2033
- Figure 27: South America Veterinary Industry Revenue Share (%), by Service 2025 & 2033
- Figure 28: South America Veterinary Industry Revenue (Million), by Animal Type 2025 & 2033
- Figure 29: South America Veterinary Industry Revenue Share (%), by Animal Type 2025 & 2033
- Figure 30: South America Veterinary Industry Revenue (Million), by Country 2025 & 2033
- Figure 31: South America Veterinary Industry Revenue Share (%), by Country 2025 & 2033
List of Tables
- Table 1: Global Veterinary Industry Revenue Million Forecast, by Service 2020 & 2033
- Table 2: Global Veterinary Industry Revenue Million Forecast, by Animal Type 2020 & 2033
- Table 3: Global Veterinary Industry Revenue Million Forecast, by Region 2020 & 2033
- Table 4: Global Veterinary Industry Revenue Million Forecast, by Service 2020 & 2033
- Table 5: Global Veterinary Industry Revenue Million Forecast, by Animal Type 2020 & 2033
- Table 6: Global Veterinary Industry Revenue Million Forecast, by Country 2020 & 2033
- Table 7: United States Veterinary Industry Revenue (Million) Forecast, by Application 2020 & 2033
- Table 8: Canada Veterinary Industry Revenue (Million) Forecast, by Application 2020 & 2033
- Table 9: Mexico Veterinary Industry Revenue (Million) Forecast, by Application 2020 & 2033
- Table 10: Global Veterinary Industry Revenue Million Forecast, by Service 2020 & 2033
- Table 11: Global Veterinary Industry Revenue Million Forecast, by Animal Type 2020 & 2033
- Table 12: Global Veterinary Industry Revenue Million Forecast, by Country 2020 & 2033
- Table 13: Germany Veterinary Industry Revenue (Million) Forecast, by Application 2020 & 2033
- Table 14: United Kingdom Veterinary Industry Revenue (Million) Forecast, by Application 2020 & 2033
- Table 15: France Veterinary Industry Revenue (Million) Forecast, by Application 2020 & 2033
- Table 16: Italy Veterinary Industry Revenue (Million) Forecast, by Application 2020 & 2033
- Table 17: Spain Veterinary Industry Revenue (Million) Forecast, by Application 2020 & 2033
- Table 18: Rest of Europe Veterinary Industry Revenue (Million) Forecast, by Application 2020 & 2033
- Table 19: Global Veterinary Industry Revenue Million Forecast, by Service 2020 & 2033
- Table 20: Global Veterinary Industry Revenue Million Forecast, by Animal Type 2020 & 2033
- Table 21: Global Veterinary Industry Revenue Million Forecast, by Country 2020 & 2033
- Table 22: China Veterinary Industry Revenue (Million) Forecast, by Application 2020 & 2033
- Table 23: Japan Veterinary Industry Revenue (Million) Forecast, by Application 2020 & 2033
- Table 24: India Veterinary Industry Revenue (Million) Forecast, by Application 2020 & 2033
- Table 25: Australia Veterinary Industry Revenue (Million) Forecast, by Application 2020 & 2033
- Table 26: South Korea Veterinary Industry Revenue (Million) Forecast, by Application 2020 & 2033
- Table 27: Rest of Asia Pacific Veterinary Industry Revenue (Million) Forecast, by Application 2020 & 2033
- Table 28: Global Veterinary Industry Revenue Million Forecast, by Service 2020 & 2033
- Table 29: Global Veterinary Industry Revenue Million Forecast, by Animal Type 2020 & 2033
- Table 30: Global Veterinary Industry Revenue Million Forecast, by Country 2020 & 2033
- Table 31: GCC Veterinary Industry Revenue (Million) Forecast, by Application 2020 & 2033
- Table 32: South Africa Veterinary Industry Revenue (Million) Forecast, by Application 2020 & 2033
- Table 33: Rest of Middle East and Africa Veterinary Industry Revenue (Million) Forecast, by Application 2020 & 2033
- Table 34: Global Veterinary Industry Revenue Million Forecast, by Service 2020 & 2033
- Table 35: Global Veterinary Industry Revenue Million Forecast, by Animal Type 2020 & 2033
- Table 36: Global Veterinary Industry Revenue Million Forecast, by Country 2020 & 2033
- Table 37: Brazil Veterinary Industry Revenue (Million) Forecast, by Application 2020 & 2033
- Table 38: Argentina Veterinary Industry Revenue (Million) Forecast, by Application 2020 & 2033
- Table 39: Rest of South America Veterinary Industry Revenue (Million) Forecast, by Application 2020 & 2033
Frequently Asked Questions
1. What is the projected Compound Annual Growth Rate (CAGR) of the Veterinary Industry?
The projected CAGR is approximately 4.90%.
2. Which companies are prominent players in the Veterinary Industry?
Key companies in the market include CVS Group PLC, Elanco, FirstVet AB, Elekta*List Not Exhaustive, Zoetis, CityVet Inc, Kremer Veterinary Services, Ethos Veterinary Health, Torigen Pharmaceuticals Inc, Karyopharm Therapeutics Inc, ELIAS Animal Health, Greencross Limited, Armor Animal Health (Animart), Mars Inc, Idexx laboratories.
3. What are the main segments of the Veterinary Industry?
The market segments include Service, Animal Type.
4. Can you provide details about the market size?
The market size is estimated to be USD 122.72 Million as of 2022.
5. What are some drivers contributing to market growth?
Increasing Prevalence of Various Diseases in Animals; Rising Adoption of Animals; Growing Expenditure on Animals/Pets.
6. What are the notable trends driving market growth?
The Companion Animal Segment is Expected to Dominate the Market.
7. Are there any restraints impacting market growth?
Shortage of Skilled Personnel; Increasing Cost of Veterinary Services.
8. Can you provide examples of recent developments in the market?
May 2022: The Chief Minister of Andhra Pradesh, Sri YS Jagan Mohan Reddy, officially launched 175 Mobile Ambulatory Veterinary Clinics (MAVCs) with an investment of Rs 278 crore. The state government planned to establish 340 Dr. YSR Sanchaara Pasu Aarogya Seva, or Mobile Ambulatory Veterinary Clinics (MAVC), in the state to improve the service delivery system and ensure that the veterinary services provided by the animal husbandry department are more easily accessible to the public.
9. What pricing options are available for accessing the report?
Pricing options include single-user, multi-user, and enterprise licenses priced at USD 4750, USD 5250, and USD 8750 respectively.
10. Is the market size provided in terms of value or volume?
The market size is provided in terms of value, measured in Million.
11. Are there any specific market keywords associated with the report?
Yes, the market keyword associated with the report is "Veterinary Industry," which aids in identifying and referencing the specific market segment covered.
12. How do I determine which pricing option suits my needs best?
The pricing options vary based on user requirements and access needs. Individual users may opt for single-user licenses, while businesses requiring broader access may choose multi-user or enterprise licenses for cost-effective access to the report.
13. Are there any additional resources or data provided in the Veterinary Industry report?
While the report offers comprehensive insights, it's advisable to review the specific contents or supplementary materials provided to ascertain if additional resources or data are available.
14. How can I stay updated on further developments or reports in the Veterinary Industry?
To stay informed about further developments, trends, and reports in the Veterinary Industry, consider subscribing to industry newsletters, following relevant companies and organizations, or regularly checking reputable industry news sources and publications.
Methodology
Step 1 - Identification of Relevant Samples Size from Population Database


Step 2 - Approaches for Defining Global Market Size (Value, Volume* & Price*)

Note*: In applicable scenarios
Step 3 - Data Sources
Primary Research
- Web Analytics
- Survey Reports
- Research Institute
- Latest Research Reports
- Opinion Leaders
Secondary Research
- Annual Reports
- White Paper
- Latest Press Release
- Industry Association
- Paid Database
- Investor Presentations

Step 4 - Data Triangulation
Involves using different sources of information in order to increase the validity of a study
These sources are likely to be stakeholders in a program - participants, other researchers, program staff, other community members, and so on.
Then we put all data in single framework & apply various statistical tools to find out the dynamic on the market.
During the analysis stage, feedback from the stakeholder groups would be compared to determine areas of agreement as well as areas of divergence