
Key Insights
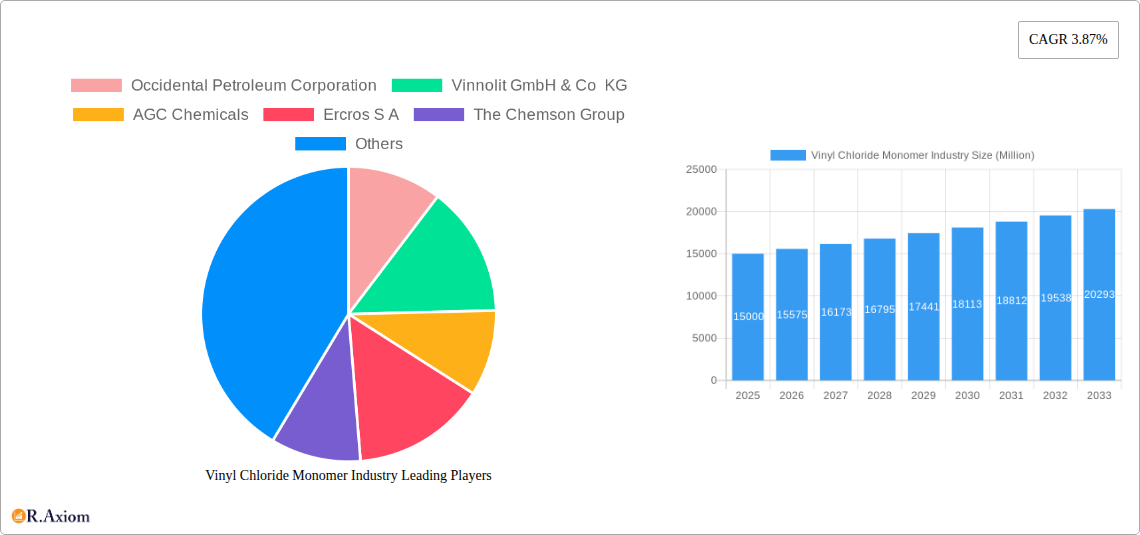
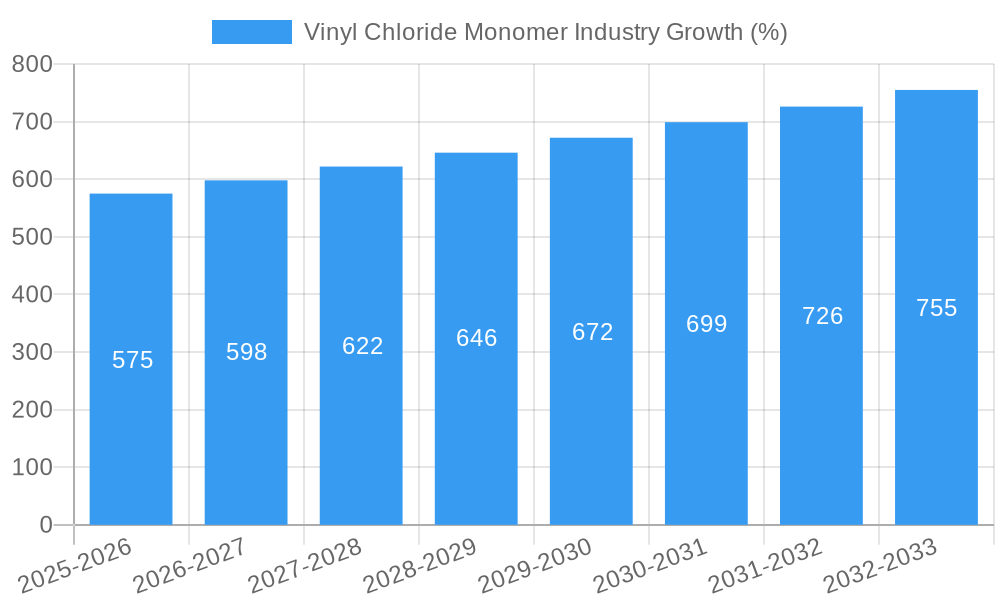
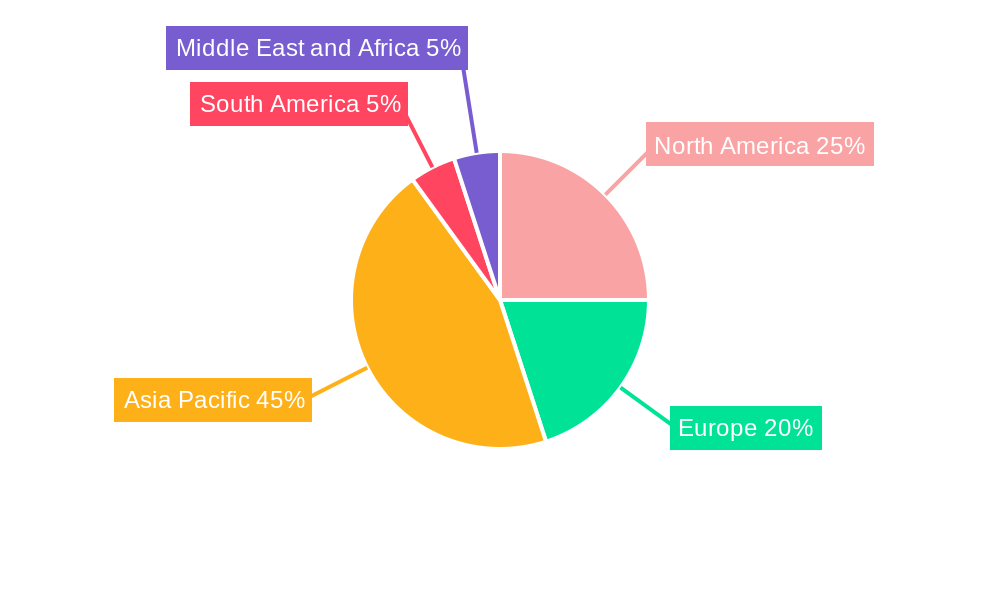
The Vinyl Chloride Monomer (VCM) market, valued at approximately $15 billion in 2025, is projected to experience steady growth, exhibiting a Compound Annual Growth Rate (CAGR) of 3.87% from 2025 to 2033. This growth is driven by the robust demand from key end-use industries, primarily building and construction (fueled by infrastructure development globally), and the healthcare sector (driven by increased demand for medical devices and equipment utilizing PVC). Furthermore, the expanding electrical industry, particularly in developing economies, contributes significantly to the market's expansion. While PVC remains the dominant application, other emerging applications are also contributing to the market's growth trajectory. However, stringent environmental regulations regarding the production and disposal of VCM, coupled with fluctuating raw material prices (primarily ethylene and chlorine), pose significant challenges. The competitive landscape is characterized by several major players, including Occidental Petroleum, Vinnolit, AGC Chemicals, and others, each vying for market share through innovation, capacity expansion, and strategic partnerships. Regional variations exist, with Asia-Pacific, particularly China and India, expected to remain the largest market due to rapid infrastructure development and industrialization. North America and Europe are also expected to see considerable growth, although at a potentially slower pace than Asia-Pacific.
The forecast period (2025-2033) is expected to witness a shift towards sustainable VCM production methods, driven by increasing environmental concerns. Companies are investing in research and development to reduce their carbon footprint and improve their overall sustainability profile. This includes exploring alternative feedstocks and implementing more efficient manufacturing processes. The market will also see increased consolidation, with mergers and acquisitions potentially reshaping the competitive landscape. Overall, the VCM market's future prospects remain promising, despite the aforementioned challenges, fueled by the persistent demand from key end-use sectors and ongoing innovation within the industry. However, companies need to strategically navigate environmental regulations and price fluctuations to maximize their returns during this period.
This comprehensive report provides a detailed analysis of the global Vinyl Chloride Monomer (VCM) industry, offering in-depth insights into market dynamics, competitive landscape, and future growth prospects. The report covers the historical period from 2019 to 2024, with a base year of 2025 and a forecast period spanning from 2025 to 2033. The study encompasses various segments, key players, and emerging trends, providing actionable intelligence for industry stakeholders.
Vinyl Chloride Monomer Industry Market Concentration & Innovation
The VCM market exhibits a moderately concentrated structure, with several major players controlling a significant share of global production. Market share analysis reveals that companies like Occidental Petroleum Corporation, Vinnolit GmbH & Co KG, and Westlake Chemical Corporation hold substantial positions. However, the market also accommodates numerous smaller players, creating a dynamic competitive landscape. Innovation is driven by the need for enhanced efficiency, cost reduction, and the development of sustainable production processes. Regulatory frameworks, particularly those related to environmental protection and worker safety, significantly influence industry operations. The presence of substitute materials, albeit limited, exerts some competitive pressure. Mergers and acquisitions (M&A) activity is moderate, with deal values typically in the range of xx Million to xx Million USD, primarily focused on consolidating market share and expanding geographic reach. End-user trends towards sustainable building materials and stricter environmental regulations are shaping the industry.
- Market Concentration: Moderately concentrated, with top 5 players holding approximately xx% market share.
- Innovation Drivers: Enhanced efficiency, cost reduction, sustainable production.
- Regulatory Frameworks: Stringent environmental and safety regulations.
- Product Substitutes: Limited, with some competition from alternative polymers.
- M&A Activity: Moderate, with deal values ranging from xx Million to xx Million USD.
Vinyl Chloride Monomer Industry Industry Trends & Insights
The global VCM market is projected to witness a Compound Annual Growth Rate (CAGR) of xx% during the forecast period (2025-2033). This growth is primarily driven by the robust demand from the construction industry, particularly in developing economies experiencing rapid urbanization. Technological disruptions, such as the adoption of digital twins in manufacturing processes (as demonstrated by AGC Chemicals' recent initiative), are enhancing operational efficiency and optimizing production. Consumer preferences are shifting towards eco-friendly building materials, pushing manufacturers to develop sustainable VCM production methods. Competitive dynamics are characterized by price competition, product differentiation, and geographic expansion strategies. Market penetration of VCM in emerging applications, such as specialized films and coatings, is gradually increasing.
Dominant Markets & Segments in Vinyl Chloride Monomer Industry
The Asia-Pacific region dominates the VCM market, fueled by rapid infrastructure development and construction activities in countries like China and India. Within the end-user segments, the building and construction sector accounts for the largest share of VCM consumption, owing to its extensive use in PVC pipes, profiles, and flooring.
- Dominant Region: Asia-Pacific (China and India are key drivers)
- Dominant End-User Industry: Building and Construction (driven by infrastructure development and urbanization)
- Dominant Application: PVC (due to its versatility and cost-effectiveness)
Key Drivers:
- Building & Construction: Rapid urbanization, infrastructure development projects, and increasing construction activities in developing economies.
- Economic Policies: Government investments in infrastructure, supportive policies promoting construction.
- Infrastructure Development: Extensive road, building, and housing projects driving PVC demand.
Vinyl Chloride Monomer Industry Product Developments
Recent product innovations focus on enhancing the performance characteristics of VCM, including improved durability, UV resistance, and flame retardancy. Manufacturers are also exploring the development of bio-based VCM to meet growing sustainability demands. These developments aim to cater to diverse applications, including flexible packaging and specialty films. The competitive advantage lies in the ability to offer superior quality products at competitive prices, along with strong technical support and timely delivery.
Report Scope & Segmentation Analysis
This report segments the VCM market by end-user industry (Building and Construction, Healthcare, Electrical, Other End-user Industries) and application (PVC, Other Applications). Each segment is analyzed based on historical and projected market size, growth rate, and competitive dynamics. The Building and Construction segment exhibits the highest growth potential, followed by the PVC application segment. The report provides detailed insights into the market share and future prospects of each segment.
- End-User Industry: Building and Construction (Largest market share, highest growth potential); Healthcare (Steady growth); Electrical (Moderate growth); Other End-user Industries (Niche applications)
- Application: PVC (Dominant application, high volume consumption); Other Applications (Emerging applications with moderate growth)
Key Drivers of Vinyl Chloride Monomer Industry Growth
Growth in the VCM market is primarily driven by the increasing demand for PVC from the construction industry, particularly in emerging economies. Technological advancements in VCM production processes have led to cost reductions and improved efficiency. Favorable economic conditions and government investments in infrastructure projects further boost market growth. Stringent environmental regulations are prompting manufacturers to adopt more sustainable production methods, which, in turn, is contributing to the long-term growth of the industry.
Challenges in the Vinyl Chloride Monomer Industry Sector
The VCM industry faces several challenges, including fluctuating raw material prices, stringent environmental regulations, and intense competition. Supply chain disruptions can impact production and profitability. Moreover, the inherent toxicity of VCM necessitates robust safety measures and waste management practices, which add to operational costs. These factors collectively impact the industry's profitability and growth trajectory.
Emerging Opportunities in Vinyl Chloride Monomer Industry
Emerging opportunities include the development of bio-based VCM and the expansion into new applications, such as specialized films and coatings. Sustainable production methods are becoming increasingly important, and companies investing in green technologies are poised for significant growth. The rising demand for flexible packaging in emerging markets also presents a considerable growth opportunity.
Leading Players in the Vinyl Chloride Monomer Industry Market
- Occidental Petroleum Corporation
- Vinnolit GmbH & Co KG
- AGC Chemicals
- Ercros S A
- The Chemson Group
- Westlake Chemical Corporation
- Olin Corporation
- Reliance Industries Limited
- Vynova Group
- Tosoh Corporation
- NOVA Chemicals
- Dow
- Mexichem
- The Axiall Corporation
- Shin-Etsu PVC B V
Key Developments in Vinyl Chloride Monomer Industry Industry
- April 2023: AGC Chemicals developed a Process Digital Twin for chemical plants and commenced operations at its VCM manufacturing plant in Indonesia. This development signifies the increasing adoption of digital technologies to enhance efficiency and optimize production processes within the VCM industry.
Strategic Outlook for Vinyl Chloride Monomer Industry Market
The VCM market is poised for significant growth, driven by continued demand from the construction sector and expansion into new applications. Technological advancements, particularly in sustainable production methods, will play a crucial role in shaping the future of the industry. Companies investing in innovation, sustainable practices, and efficient supply chains will be best positioned to capitalize on the emerging opportunities and navigate the challenges within the VCM market.
Vinyl Chloride Monomer Industry Segmentation
-
1. Application
- 1.1. PVC
- 1.2. Other Applications
-
2. End-user Industry
- 2.1. Building and Construction
- 2.2. Healthcare
- 2.3. Electrical
- 2.4. Other End-user Industries
Vinyl Chloride Monomer Industry Segmentation By Geography
-
1. Asia Pacific
- 1.1. China
- 1.2. India
- 1.3. Japan
- 1.4. South Korea
- 1.5. Rest of Asia Pacific
-
2. North America
- 2.1. United States
- 2.2. Canada
- 2.3. Mexico
-
3. Europe
- 3.1. Germany
- 3.2. United Kingdom
- 3.3. France
- 3.4. Italy
- 3.5. Rest of Europe
-
4. South America
- 4.1. Brazil
- 4.2. Argentina
- 4.3. Rest of South America
-
5. Middle East and Africa
- 5.1. Saudi Arabia
- 5.2. South Africa
- 5.3. Rest of Middle East and Africa
Vinyl Chloride Monomer Industry REPORT HIGHLIGHTS
| Aspects | Details |
|---|---|
| Study Period | 2019-2033 |
| Base Year | 2024 |
| Estimated Year | 2025 |
| Forecast Period | 2025-2033 |
| Historical Period | 2019-2024 |
| Growth Rate | CAGR of 3.87% from 2019-2033 |
| Segmentation |
|
Table of Contents
- 1. Introduction
- 1.1. Research Scope
- 1.2. Market Segmentation
- 1.3. Research Methodology
- 1.4. Definitions and Assumptions
- 2. Executive Summary
- 2.1. Introduction
- 3. Market Dynamics
- 3.1. Introduction
- 3.2. Market Drivers
- 3.2.1. Rising Demand in Healthcare Sector; High Consumption from Building and Construction Industry
- 3.3. Market Restrains
- 3.3.1. Increasing Environmental Concerns and Availability of Substitutes in Various Applications; Other Restraints
- 3.4. Market Trends
- 3.4.1. Building and Construction Sector to Boost Market
- 4. Market Factor Analysis
- 4.1. Porters Five Forces
- 4.2. Supply/Value Chain
- 4.3. PESTEL analysis
- 4.4. Market Entropy
- 4.5. Patent/Trademark Analysis
- 5. Global Vinyl Chloride Monomer Industry Analysis, Insights and Forecast, 2019-2031
- 5.1. Market Analysis, Insights and Forecast - by Application
- 5.1.1. PVC
- 5.1.2. Other Applications
- 5.2. Market Analysis, Insights and Forecast - by End-user Industry
- 5.2.1. Building and Construction
- 5.2.2. Healthcare
- 5.2.3. Electrical
- 5.2.4. Other End-user Industries
- 5.3. Market Analysis, Insights and Forecast - by Region
- 5.3.1. Asia Pacific
- 5.3.2. North America
- 5.3.3. Europe
- 5.3.4. South America
- 5.3.5. Middle East and Africa
- 5.1. Market Analysis, Insights and Forecast - by Application
- 6. Asia Pacific Vinyl Chloride Monomer Industry Analysis, Insights and Forecast, 2019-2031
- 6.1. Market Analysis, Insights and Forecast - by Application
- 6.1.1. PVC
- 6.1.2. Other Applications
- 6.2. Market Analysis, Insights and Forecast - by End-user Industry
- 6.2.1. Building and Construction
- 6.2.2. Healthcare
- 6.2.3. Electrical
- 6.2.4. Other End-user Industries
- 6.1. Market Analysis, Insights and Forecast - by Application
- 7. North America Vinyl Chloride Monomer Industry Analysis, Insights and Forecast, 2019-2031
- 7.1. Market Analysis, Insights and Forecast - by Application
- 7.1.1. PVC
- 7.1.2. Other Applications
- 7.2. Market Analysis, Insights and Forecast - by End-user Industry
- 7.2.1. Building and Construction
- 7.2.2. Healthcare
- 7.2.3. Electrical
- 7.2.4. Other End-user Industries
- 7.1. Market Analysis, Insights and Forecast - by Application
- 8. Europe Vinyl Chloride Monomer Industry Analysis, Insights and Forecast, 2019-2031
- 8.1. Market Analysis, Insights and Forecast - by Application
- 8.1.1. PVC
- 8.1.2. Other Applications
- 8.2. Market Analysis, Insights and Forecast - by End-user Industry
- 8.2.1. Building and Construction
- 8.2.2. Healthcare
- 8.2.3. Electrical
- 8.2.4. Other End-user Industries
- 8.1. Market Analysis, Insights and Forecast - by Application
- 9. South America Vinyl Chloride Monomer Industry Analysis, Insights and Forecast, 2019-2031
- 9.1. Market Analysis, Insights and Forecast - by Application
- 9.1.1. PVC
- 9.1.2. Other Applications
- 9.2. Market Analysis, Insights and Forecast - by End-user Industry
- 9.2.1. Building and Construction
- 9.2.2. Healthcare
- 9.2.3. Electrical
- 9.2.4. Other End-user Industries
- 9.1. Market Analysis, Insights and Forecast - by Application
- 10. Middle East and Africa Vinyl Chloride Monomer Industry Analysis, Insights and Forecast, 2019-2031
- 10.1. Market Analysis, Insights and Forecast - by Application
- 10.1.1. PVC
- 10.1.2. Other Applications
- 10.2. Market Analysis, Insights and Forecast - by End-user Industry
- 10.2.1. Building and Construction
- 10.2.2. Healthcare
- 10.2.3. Electrical
- 10.2.4. Other End-user Industries
- 10.1. Market Analysis, Insights and Forecast - by Application
- 11. Asia Pacific Vinyl Chloride Monomer Industry Analysis, Insights and Forecast, 2019-2031
- 11.1. Market Analysis, Insights and Forecast - By Country/Sub-region
- 11.1.1 China
- 11.1.2 India
- 11.1.3 Japan
- 11.1.4 South Korea
- 11.1.5 Rest of Asia Pacific
- 12. North America Vinyl Chloride Monomer Industry Analysis, Insights and Forecast, 2019-2031
- 12.1. Market Analysis, Insights and Forecast - By Country/Sub-region
- 12.1.1 United States
- 12.1.2 Canada
- 12.1.3 Mexico
- 13. Europe Vinyl Chloride Monomer Industry Analysis, Insights and Forecast, 2019-2031
- 13.1. Market Analysis, Insights and Forecast - By Country/Sub-region
- 13.1.1 Germany
- 13.1.2 United Kingdom
- 13.1.3 France
- 13.1.4 Italy
- 13.1.5 Rest of Europe
- 14. South America Vinyl Chloride Monomer Industry Analysis, Insights and Forecast, 2019-2031
- 14.1. Market Analysis, Insights and Forecast - By Country/Sub-region
- 14.1.1 Brazil
- 14.1.2 Argentina
- 14.1.3 Rest of South America
- 15. Middle East and Africa Vinyl Chloride Monomer Industry Analysis, Insights and Forecast, 2019-2031
- 15.1. Market Analysis, Insights and Forecast - By Country/Sub-region
- 15.1.1 Saudi Arabia
- 15.1.2 South Africa
- 15.1.3 Rest of Middle East and Africa
- 16. Competitive Analysis
- 16.1. Global Market Share Analysis 2024
- 16.2. Company Profiles
- 16.2.1 Occidental Petroleum Corporation
- 16.2.1.1. Overview
- 16.2.1.2. Products
- 16.2.1.3. SWOT Analysis
- 16.2.1.4. Recent Developments
- 16.2.1.5. Financials (Based on Availability)
- 16.2.2 Vinnolit GmbH & Co KG
- 16.2.2.1. Overview
- 16.2.2.2. Products
- 16.2.2.3. SWOT Analysis
- 16.2.2.4. Recent Developments
- 16.2.2.5. Financials (Based on Availability)
- 16.2.3 AGC Chemicals
- 16.2.3.1. Overview
- 16.2.3.2. Products
- 16.2.3.3. SWOT Analysis
- 16.2.3.4. Recent Developments
- 16.2.3.5. Financials (Based on Availability)
- 16.2.4 Ercros S A
- 16.2.4.1. Overview
- 16.2.4.2. Products
- 16.2.4.3. SWOT Analysis
- 16.2.4.4. Recent Developments
- 16.2.4.5. Financials (Based on Availability)
- 16.2.5 The Chemson Group
- 16.2.5.1. Overview
- 16.2.5.2. Products
- 16.2.5.3. SWOT Analysis
- 16.2.5.4. Recent Developments
- 16.2.5.5. Financials (Based on Availability)
- 16.2.6 Westlake Chemical Corporation*List Not Exhaustive
- 16.2.6.1. Overview
- 16.2.6.2. Products
- 16.2.6.3. SWOT Analysis
- 16.2.6.4. Recent Developments
- 16.2.6.5. Financials (Based on Availability)
- 16.2.7 Olin Corporation
- 16.2.7.1. Overview
- 16.2.7.2. Products
- 16.2.7.3. SWOT Analysis
- 16.2.7.4. Recent Developments
- 16.2.7.5. Financials (Based on Availability)
- 16.2.8 Reliance Industries Limited
- 16.2.8.1. Overview
- 16.2.8.2. Products
- 16.2.8.3. SWOT Analysis
- 16.2.8.4. Recent Developments
- 16.2.8.5. Financials (Based on Availability)
- 16.2.9 Vynova Group
- 16.2.9.1. Overview
- 16.2.9.2. Products
- 16.2.9.3. SWOT Analysis
- 16.2.9.4. Recent Developments
- 16.2.9.5. Financials (Based on Availability)
- 16.2.10 Tosoh Corporation
- 16.2.10.1. Overview
- 16.2.10.2. Products
- 16.2.10.3. SWOT Analysis
- 16.2.10.4. Recent Developments
- 16.2.10.5. Financials (Based on Availability)
- 16.2.11 NOVA Chemicals
- 16.2.11.1. Overview
- 16.2.11.2. Products
- 16.2.11.3. SWOT Analysis
- 16.2.11.4. Recent Developments
- 16.2.11.5. Financials (Based on Availability)
- 16.2.12 Dow
- 16.2.12.1. Overview
- 16.2.12.2. Products
- 16.2.12.3. SWOT Analysis
- 16.2.12.4. Recent Developments
- 16.2.12.5. Financials (Based on Availability)
- 16.2.13 Mexichem
- 16.2.13.1. Overview
- 16.2.13.2. Products
- 16.2.13.3. SWOT Analysis
- 16.2.13.4. Recent Developments
- 16.2.13.5. Financials (Based on Availability)
- 16.2.14 The Axiall Corporation
- 16.2.14.1. Overview
- 16.2.14.2. Products
- 16.2.14.3. SWOT Analysis
- 16.2.14.4. Recent Developments
- 16.2.14.5. Financials (Based on Availability)
- 16.2.15 Shin-Etsu PVC B V
- 16.2.15.1. Overview
- 16.2.15.2. Products
- 16.2.15.3. SWOT Analysis
- 16.2.15.4. Recent Developments
- 16.2.15.5. Financials (Based on Availability)
- 16.2.1 Occidental Petroleum Corporation
List of Figures
- Figure 1: Global Vinyl Chloride Monomer Industry Revenue Breakdown (Million, %) by Region 2024 & 2032
- Figure 2: Global Vinyl Chloride Monomer Industry Volume Breakdown (Million, %) by Region 2024 & 2032
- Figure 3: Asia Pacific Vinyl Chloride Monomer Industry Revenue (Million), by Country 2024 & 2032
- Figure 4: Asia Pacific Vinyl Chloride Monomer Industry Volume (Million), by Country 2024 & 2032
- Figure 5: Asia Pacific Vinyl Chloride Monomer Industry Revenue Share (%), by Country 2024 & 2032
- Figure 6: Asia Pacific Vinyl Chloride Monomer Industry Volume Share (%), by Country 2024 & 2032
- Figure 7: North America Vinyl Chloride Monomer Industry Revenue (Million), by Country 2024 & 2032
- Figure 8: North America Vinyl Chloride Monomer Industry Volume (Million), by Country 2024 & 2032
- Figure 9: North America Vinyl Chloride Monomer Industry Revenue Share (%), by Country 2024 & 2032
- Figure 10: North America Vinyl Chloride Monomer Industry Volume Share (%), by Country 2024 & 2032
- Figure 11: Europe Vinyl Chloride Monomer Industry Revenue (Million), by Country 2024 & 2032
- Figure 12: Europe Vinyl Chloride Monomer Industry Volume (Million), by Country 2024 & 2032
- Figure 13: Europe Vinyl Chloride Monomer Industry Revenue Share (%), by Country 2024 & 2032
- Figure 14: Europe Vinyl Chloride Monomer Industry Volume Share (%), by Country 2024 & 2032
- Figure 15: South America Vinyl Chloride Monomer Industry Revenue (Million), by Country 2024 & 2032
- Figure 16: South America Vinyl Chloride Monomer Industry Volume (Million), by Country 2024 & 2032
- Figure 17: South America Vinyl Chloride Monomer Industry Revenue Share (%), by Country 2024 & 2032
- Figure 18: South America Vinyl Chloride Monomer Industry Volume Share (%), by Country 2024 & 2032
- Figure 19: Middle East and Africa Vinyl Chloride Monomer Industry Revenue (Million), by Country 2024 & 2032
- Figure 20: Middle East and Africa Vinyl Chloride Monomer Industry Volume (Million), by Country 2024 & 2032
- Figure 21: Middle East and Africa Vinyl Chloride Monomer Industry Revenue Share (%), by Country 2024 & 2032
- Figure 22: Middle East and Africa Vinyl Chloride Monomer Industry Volume Share (%), by Country 2024 & 2032
- Figure 23: Asia Pacific Vinyl Chloride Monomer Industry Revenue (Million), by Application 2024 & 2032
- Figure 24: Asia Pacific Vinyl Chloride Monomer Industry Volume (Million), by Application 2024 & 2032
- Figure 25: Asia Pacific Vinyl Chloride Monomer Industry Revenue Share (%), by Application 2024 & 2032
- Figure 26: Asia Pacific Vinyl Chloride Monomer Industry Volume Share (%), by Application 2024 & 2032
- Figure 27: Asia Pacific Vinyl Chloride Monomer Industry Revenue (Million), by End-user Industry 2024 & 2032
- Figure 28: Asia Pacific Vinyl Chloride Monomer Industry Volume (Million), by End-user Industry 2024 & 2032
- Figure 29: Asia Pacific Vinyl Chloride Monomer Industry Revenue Share (%), by End-user Industry 2024 & 2032
- Figure 30: Asia Pacific Vinyl Chloride Monomer Industry Volume Share (%), by End-user Industry 2024 & 2032
- Figure 31: Asia Pacific Vinyl Chloride Monomer Industry Revenue (Million), by Country 2024 & 2032
- Figure 32: Asia Pacific Vinyl Chloride Monomer Industry Volume (Million), by Country 2024 & 2032
- Figure 33: Asia Pacific Vinyl Chloride Monomer Industry Revenue Share (%), by Country 2024 & 2032
- Figure 34: Asia Pacific Vinyl Chloride Monomer Industry Volume Share (%), by Country 2024 & 2032
- Figure 35: North America Vinyl Chloride Monomer Industry Revenue (Million), by Application 2024 & 2032
- Figure 36: North America Vinyl Chloride Monomer Industry Volume (Million), by Application 2024 & 2032
- Figure 37: North America Vinyl Chloride Monomer Industry Revenue Share (%), by Application 2024 & 2032
- Figure 38: North America Vinyl Chloride Monomer Industry Volume Share (%), by Application 2024 & 2032
- Figure 39: North America Vinyl Chloride Monomer Industry Revenue (Million), by End-user Industry 2024 & 2032
- Figure 40: North America Vinyl Chloride Monomer Industry Volume (Million), by End-user Industry 2024 & 2032
- Figure 41: North America Vinyl Chloride Monomer Industry Revenue Share (%), by End-user Industry 2024 & 2032
- Figure 42: North America Vinyl Chloride Monomer Industry Volume Share (%), by End-user Industry 2024 & 2032
- Figure 43: North America Vinyl Chloride Monomer Industry Revenue (Million), by Country 2024 & 2032
- Figure 44: North America Vinyl Chloride Monomer Industry Volume (Million), by Country 2024 & 2032
- Figure 45: North America Vinyl Chloride Monomer Industry Revenue Share (%), by Country 2024 & 2032
- Figure 46: North America Vinyl Chloride Monomer Industry Volume Share (%), by Country 2024 & 2032
- Figure 47: Europe Vinyl Chloride Monomer Industry Revenue (Million), by Application 2024 & 2032
- Figure 48: Europe Vinyl Chloride Monomer Industry Volume (Million), by Application 2024 & 2032
- Figure 49: Europe Vinyl Chloride Monomer Industry Revenue Share (%), by Application 2024 & 2032
- Figure 50: Europe Vinyl Chloride Monomer Industry Volume Share (%), by Application 2024 & 2032
- Figure 51: Europe Vinyl Chloride Monomer Industry Revenue (Million), by End-user Industry 2024 & 2032
- Figure 52: Europe Vinyl Chloride Monomer Industry Volume (Million), by End-user Industry 2024 & 2032
- Figure 53: Europe Vinyl Chloride Monomer Industry Revenue Share (%), by End-user Industry 2024 & 2032
- Figure 54: Europe Vinyl Chloride Monomer Industry Volume Share (%), by End-user Industry 2024 & 2032
- Figure 55: Europe Vinyl Chloride Monomer Industry Revenue (Million), by Country 2024 & 2032
- Figure 56: Europe Vinyl Chloride Monomer Industry Volume (Million), by Country 2024 & 2032
- Figure 57: Europe Vinyl Chloride Monomer Industry Revenue Share (%), by Country 2024 & 2032
- Figure 58: Europe Vinyl Chloride Monomer Industry Volume Share (%), by Country 2024 & 2032
- Figure 59: South America Vinyl Chloride Monomer Industry Revenue (Million), by Application 2024 & 2032
- Figure 60: South America Vinyl Chloride Monomer Industry Volume (Million), by Application 2024 & 2032
- Figure 61: South America Vinyl Chloride Monomer Industry Revenue Share (%), by Application 2024 & 2032
- Figure 62: South America Vinyl Chloride Monomer Industry Volume Share (%), by Application 2024 & 2032
- Figure 63: South America Vinyl Chloride Monomer Industry Revenue (Million), by End-user Industry 2024 & 2032
- Figure 64: South America Vinyl Chloride Monomer Industry Volume (Million), by End-user Industry 2024 & 2032
- Figure 65: South America Vinyl Chloride Monomer Industry Revenue Share (%), by End-user Industry 2024 & 2032
- Figure 66: South America Vinyl Chloride Monomer Industry Volume Share (%), by End-user Industry 2024 & 2032
- Figure 67: South America Vinyl Chloride Monomer Industry Revenue (Million), by Country 2024 & 2032
- Figure 68: South America Vinyl Chloride Monomer Industry Volume (Million), by Country 2024 & 2032
- Figure 69: South America Vinyl Chloride Monomer Industry Revenue Share (%), by Country 2024 & 2032
- Figure 70: South America Vinyl Chloride Monomer Industry Volume Share (%), by Country 2024 & 2032
- Figure 71: Middle East and Africa Vinyl Chloride Monomer Industry Revenue (Million), by Application 2024 & 2032
- Figure 72: Middle East and Africa Vinyl Chloride Monomer Industry Volume (Million), by Application 2024 & 2032
- Figure 73: Middle East and Africa Vinyl Chloride Monomer Industry Revenue Share (%), by Application 2024 & 2032
- Figure 74: Middle East and Africa Vinyl Chloride Monomer Industry Volume Share (%), by Application 2024 & 2032
- Figure 75: Middle East and Africa Vinyl Chloride Monomer Industry Revenue (Million), by End-user Industry 2024 & 2032
- Figure 76: Middle East and Africa Vinyl Chloride Monomer Industry Volume (Million), by End-user Industry 2024 & 2032
- Figure 77: Middle East and Africa Vinyl Chloride Monomer Industry Revenue Share (%), by End-user Industry 2024 & 2032
- Figure 78: Middle East and Africa Vinyl Chloride Monomer Industry Volume Share (%), by End-user Industry 2024 & 2032
- Figure 79: Middle East and Africa Vinyl Chloride Monomer Industry Revenue (Million), by Country 2024 & 2032
- Figure 80: Middle East and Africa Vinyl Chloride Monomer Industry Volume (Million), by Country 2024 & 2032
- Figure 81: Middle East and Africa Vinyl Chloride Monomer Industry Revenue Share (%), by Country 2024 & 2032
- Figure 82: Middle East and Africa Vinyl Chloride Monomer Industry Volume Share (%), by Country 2024 & 2032
List of Tables
- Table 1: Global Vinyl Chloride Monomer Industry Revenue Million Forecast, by Region 2019 & 2032
- Table 2: Global Vinyl Chloride Monomer Industry Volume Million Forecast, by Region 2019 & 2032
- Table 3: Global Vinyl Chloride Monomer Industry Revenue Million Forecast, by Application 2019 & 2032
- Table 4: Global Vinyl Chloride Monomer Industry Volume Million Forecast, by Application 2019 & 2032
- Table 5: Global Vinyl Chloride Monomer Industry Revenue Million Forecast, by End-user Industry 2019 & 2032
- Table 6: Global Vinyl Chloride Monomer Industry Volume Million Forecast, by End-user Industry 2019 & 2032
- Table 7: Global Vinyl Chloride Monomer Industry Revenue Million Forecast, by Region 2019 & 2032
- Table 8: Global Vinyl Chloride Monomer Industry Volume Million Forecast, by Region 2019 & 2032
- Table 9: Global Vinyl Chloride Monomer Industry Revenue Million Forecast, by Country 2019 & 2032
- Table 10: Global Vinyl Chloride Monomer Industry Volume Million Forecast, by Country 2019 & 2032
- Table 11: China Vinyl Chloride Monomer Industry Revenue (Million) Forecast, by Application 2019 & 2032
- Table 12: China Vinyl Chloride Monomer Industry Volume (Million) Forecast, by Application 2019 & 2032
- Table 13: India Vinyl Chloride Monomer Industry Revenue (Million) Forecast, by Application 2019 & 2032
- Table 14: India Vinyl Chloride Monomer Industry Volume (Million) Forecast, by Application 2019 & 2032
- Table 15: Japan Vinyl Chloride Monomer Industry Revenue (Million) Forecast, by Application 2019 & 2032
- Table 16: Japan Vinyl Chloride Monomer Industry Volume (Million) Forecast, by Application 2019 & 2032
- Table 17: South Korea Vinyl Chloride Monomer Industry Revenue (Million) Forecast, by Application 2019 & 2032
- Table 18: South Korea Vinyl Chloride Monomer Industry Volume (Million) Forecast, by Application 2019 & 2032
- Table 19: Rest of Asia Pacific Vinyl Chloride Monomer Industry Revenue (Million) Forecast, by Application 2019 & 2032
- Table 20: Rest of Asia Pacific Vinyl Chloride Monomer Industry Volume (Million) Forecast, by Application 2019 & 2032
- Table 21: Global Vinyl Chloride Monomer Industry Revenue Million Forecast, by Country 2019 & 2032
- Table 22: Global Vinyl Chloride Monomer Industry Volume Million Forecast, by Country 2019 & 2032
- Table 23: United States Vinyl Chloride Monomer Industry Revenue (Million) Forecast, by Application 2019 & 2032
- Table 24: United States Vinyl Chloride Monomer Industry Volume (Million) Forecast, by Application 2019 & 2032
- Table 25: Canada Vinyl Chloride Monomer Industry Revenue (Million) Forecast, by Application 2019 & 2032
- Table 26: Canada Vinyl Chloride Monomer Industry Volume (Million) Forecast, by Application 2019 & 2032
- Table 27: Mexico Vinyl Chloride Monomer Industry Revenue (Million) Forecast, by Application 2019 & 2032
- Table 28: Mexico Vinyl Chloride Monomer Industry Volume (Million) Forecast, by Application 2019 & 2032
- Table 29: Global Vinyl Chloride Monomer Industry Revenue Million Forecast, by Country 2019 & 2032
- Table 30: Global Vinyl Chloride Monomer Industry Volume Million Forecast, by Country 2019 & 2032
- Table 31: Germany Vinyl Chloride Monomer Industry Revenue (Million) Forecast, by Application 2019 & 2032
- Table 32: Germany Vinyl Chloride Monomer Industry Volume (Million) Forecast, by Application 2019 & 2032
- Table 33: United Kingdom Vinyl Chloride Monomer Industry Revenue (Million) Forecast, by Application 2019 & 2032
- Table 34: United Kingdom Vinyl Chloride Monomer Industry Volume (Million) Forecast, by Application 2019 & 2032
- Table 35: France Vinyl Chloride Monomer Industry Revenue (Million) Forecast, by Application 2019 & 2032
- Table 36: France Vinyl Chloride Monomer Industry Volume (Million) Forecast, by Application 2019 & 2032
- Table 37: Italy Vinyl Chloride Monomer Industry Revenue (Million) Forecast, by Application 2019 & 2032
- Table 38: Italy Vinyl Chloride Monomer Industry Volume (Million) Forecast, by Application 2019 & 2032
- Table 39: Rest of Europe Vinyl Chloride Monomer Industry Revenue (Million) Forecast, by Application 2019 & 2032
- Table 40: Rest of Europe Vinyl Chloride Monomer Industry Volume (Million) Forecast, by Application 2019 & 2032
- Table 41: Global Vinyl Chloride Monomer Industry Revenue Million Forecast, by Country 2019 & 2032
- Table 42: Global Vinyl Chloride Monomer Industry Volume Million Forecast, by Country 2019 & 2032
- Table 43: Brazil Vinyl Chloride Monomer Industry Revenue (Million) Forecast, by Application 2019 & 2032
- Table 44: Brazil Vinyl Chloride Monomer Industry Volume (Million) Forecast, by Application 2019 & 2032
- Table 45: Argentina Vinyl Chloride Monomer Industry Revenue (Million) Forecast, by Application 2019 & 2032
- Table 46: Argentina Vinyl Chloride Monomer Industry Volume (Million) Forecast, by Application 2019 & 2032
- Table 47: Rest of South America Vinyl Chloride Monomer Industry Revenue (Million) Forecast, by Application 2019 & 2032
- Table 48: Rest of South America Vinyl Chloride Monomer Industry Volume (Million) Forecast, by Application 2019 & 2032
- Table 49: Global Vinyl Chloride Monomer Industry Revenue Million Forecast, by Country 2019 & 2032
- Table 50: Global Vinyl Chloride Monomer Industry Volume Million Forecast, by Country 2019 & 2032
- Table 51: Saudi Arabia Vinyl Chloride Monomer Industry Revenue (Million) Forecast, by Application 2019 & 2032
- Table 52: Saudi Arabia Vinyl Chloride Monomer Industry Volume (Million) Forecast, by Application 2019 & 2032
- Table 53: South Africa Vinyl Chloride Monomer Industry Revenue (Million) Forecast, by Application 2019 & 2032
- Table 54: South Africa Vinyl Chloride Monomer Industry Volume (Million) Forecast, by Application 2019 & 2032
- Table 55: Rest of Middle East and Africa Vinyl Chloride Monomer Industry Revenue (Million) Forecast, by Application 2019 & 2032
- Table 56: Rest of Middle East and Africa Vinyl Chloride Monomer Industry Volume (Million) Forecast, by Application 2019 & 2032
- Table 57: Global Vinyl Chloride Monomer Industry Revenue Million Forecast, by Application 2019 & 2032
- Table 58: Global Vinyl Chloride Monomer Industry Volume Million Forecast, by Application 2019 & 2032
- Table 59: Global Vinyl Chloride Monomer Industry Revenue Million Forecast, by End-user Industry 2019 & 2032
- Table 60: Global Vinyl Chloride Monomer Industry Volume Million Forecast, by End-user Industry 2019 & 2032
- Table 61: Global Vinyl Chloride Monomer Industry Revenue Million Forecast, by Country 2019 & 2032
- Table 62: Global Vinyl Chloride Monomer Industry Volume Million Forecast, by Country 2019 & 2032
- Table 63: China Vinyl Chloride Monomer Industry Revenue (Million) Forecast, by Application 2019 & 2032
- Table 64: China Vinyl Chloride Monomer Industry Volume (Million) Forecast, by Application 2019 & 2032
- Table 65: India Vinyl Chloride Monomer Industry Revenue (Million) Forecast, by Application 2019 & 2032
- Table 66: India Vinyl Chloride Monomer Industry Volume (Million) Forecast, by Application 2019 & 2032
- Table 67: Japan Vinyl Chloride Monomer Industry Revenue (Million) Forecast, by Application 2019 & 2032
- Table 68: Japan Vinyl Chloride Monomer Industry Volume (Million) Forecast, by Application 2019 & 2032
- Table 69: South Korea Vinyl Chloride Monomer Industry Revenue (Million) Forecast, by Application 2019 & 2032
- Table 70: South Korea Vinyl Chloride Monomer Industry Volume (Million) Forecast, by Application 2019 & 2032
- Table 71: Rest of Asia Pacific Vinyl Chloride Monomer Industry Revenue (Million) Forecast, by Application 2019 & 2032
- Table 72: Rest of Asia Pacific Vinyl Chloride Monomer Industry Volume (Million) Forecast, by Application 2019 & 2032
- Table 73: Global Vinyl Chloride Monomer Industry Revenue Million Forecast, by Application 2019 & 2032
- Table 74: Global Vinyl Chloride Monomer Industry Volume Million Forecast, by Application 2019 & 2032
- Table 75: Global Vinyl Chloride Monomer Industry Revenue Million Forecast, by End-user Industry 2019 & 2032
- Table 76: Global Vinyl Chloride Monomer Industry Volume Million Forecast, by End-user Industry 2019 & 2032
- Table 77: Global Vinyl Chloride Monomer Industry Revenue Million Forecast, by Country 2019 & 2032
- Table 78: Global Vinyl Chloride Monomer Industry Volume Million Forecast, by Country 2019 & 2032
- Table 79: United States Vinyl Chloride Monomer Industry Revenue (Million) Forecast, by Application 2019 & 2032
- Table 80: United States Vinyl Chloride Monomer Industry Volume (Million) Forecast, by Application 2019 & 2032
- Table 81: Canada Vinyl Chloride Monomer Industry Revenue (Million) Forecast, by Application 2019 & 2032
- Table 82: Canada Vinyl Chloride Monomer Industry Volume (Million) Forecast, by Application 2019 & 2032
- Table 83: Mexico Vinyl Chloride Monomer Industry Revenue (Million) Forecast, by Application 2019 & 2032
- Table 84: Mexico Vinyl Chloride Monomer Industry Volume (Million) Forecast, by Application 2019 & 2032
- Table 85: Global Vinyl Chloride Monomer Industry Revenue Million Forecast, by Application 2019 & 2032
- Table 86: Global Vinyl Chloride Monomer Industry Volume Million Forecast, by Application 2019 & 2032
- Table 87: Global Vinyl Chloride Monomer Industry Revenue Million Forecast, by End-user Industry 2019 & 2032
- Table 88: Global Vinyl Chloride Monomer Industry Volume Million Forecast, by End-user Industry 2019 & 2032
- Table 89: Global Vinyl Chloride Monomer Industry Revenue Million Forecast, by Country 2019 & 2032
- Table 90: Global Vinyl Chloride Monomer Industry Volume Million Forecast, by Country 2019 & 2032
- Table 91: Germany Vinyl Chloride Monomer Industry Revenue (Million) Forecast, by Application 2019 & 2032
- Table 92: Germany Vinyl Chloride Monomer Industry Volume (Million) Forecast, by Application 2019 & 2032
- Table 93: United Kingdom Vinyl Chloride Monomer Industry Revenue (Million) Forecast, by Application 2019 & 2032
- Table 94: United Kingdom Vinyl Chloride Monomer Industry Volume (Million) Forecast, by Application 2019 & 2032
- Table 95: France Vinyl Chloride Monomer Industry Revenue (Million) Forecast, by Application 2019 & 2032
- Table 96: France Vinyl Chloride Monomer Industry Volume (Million) Forecast, by Application 2019 & 2032
- Table 97: Italy Vinyl Chloride Monomer Industry Revenue (Million) Forecast, by Application 2019 & 2032
- Table 98: Italy Vinyl Chloride Monomer Industry Volume (Million) Forecast, by Application 2019 & 2032
- Table 99: Rest of Europe Vinyl Chloride Monomer Industry Revenue (Million) Forecast, by Application 2019 & 2032
- Table 100: Rest of Europe Vinyl Chloride Monomer Industry Volume (Million) Forecast, by Application 2019 & 2032
- Table 101: Global Vinyl Chloride Monomer Industry Revenue Million Forecast, by Application 2019 & 2032
- Table 102: Global Vinyl Chloride Monomer Industry Volume Million Forecast, by Application 2019 & 2032
- Table 103: Global Vinyl Chloride Monomer Industry Revenue Million Forecast, by End-user Industry 2019 & 2032
- Table 104: Global Vinyl Chloride Monomer Industry Volume Million Forecast, by End-user Industry 2019 & 2032
- Table 105: Global Vinyl Chloride Monomer Industry Revenue Million Forecast, by Country 2019 & 2032
- Table 106: Global Vinyl Chloride Monomer Industry Volume Million Forecast, by Country 2019 & 2032
- Table 107: Brazil Vinyl Chloride Monomer Industry Revenue (Million) Forecast, by Application 2019 & 2032
- Table 108: Brazil Vinyl Chloride Monomer Industry Volume (Million) Forecast, by Application 2019 & 2032
- Table 109: Argentina Vinyl Chloride Monomer Industry Revenue (Million) Forecast, by Application 2019 & 2032
- Table 110: Argentina Vinyl Chloride Monomer Industry Volume (Million) Forecast, by Application 2019 & 2032
- Table 111: Rest of South America Vinyl Chloride Monomer Industry Revenue (Million) Forecast, by Application 2019 & 2032
- Table 112: Rest of South America Vinyl Chloride Monomer Industry Volume (Million) Forecast, by Application 2019 & 2032
- Table 113: Global Vinyl Chloride Monomer Industry Revenue Million Forecast, by Application 2019 & 2032
- Table 114: Global Vinyl Chloride Monomer Industry Volume Million Forecast, by Application 2019 & 2032
- Table 115: Global Vinyl Chloride Monomer Industry Revenue Million Forecast, by End-user Industry 2019 & 2032
- Table 116: Global Vinyl Chloride Monomer Industry Volume Million Forecast, by End-user Industry 2019 & 2032
- Table 117: Global Vinyl Chloride Monomer Industry Revenue Million Forecast, by Country 2019 & 2032
- Table 118: Global Vinyl Chloride Monomer Industry Volume Million Forecast, by Country 2019 & 2032
- Table 119: Saudi Arabia Vinyl Chloride Monomer Industry Revenue (Million) Forecast, by Application 2019 & 2032
- Table 120: Saudi Arabia Vinyl Chloride Monomer Industry Volume (Million) Forecast, by Application 2019 & 2032
- Table 121: South Africa Vinyl Chloride Monomer Industry Revenue (Million) Forecast, by Application 2019 & 2032
- Table 122: South Africa Vinyl Chloride Monomer Industry Volume (Million) Forecast, by Application 2019 & 2032
- Table 123: Rest of Middle East and Africa Vinyl Chloride Monomer Industry Revenue (Million) Forecast, by Application 2019 & 2032
- Table 124: Rest of Middle East and Africa Vinyl Chloride Monomer Industry Volume (Million) Forecast, by Application 2019 & 2032
Frequently Asked Questions
1. What is the projected Compound Annual Growth Rate (CAGR) of the Vinyl Chloride Monomer Industry?
The projected CAGR is approximately 3.87%.
2. Which companies are prominent players in the Vinyl Chloride Monomer Industry?
Key companies in the market include Occidental Petroleum Corporation, Vinnolit GmbH & Co KG, AGC Chemicals, Ercros S A, The Chemson Group, Westlake Chemical Corporation*List Not Exhaustive, Olin Corporation, Reliance Industries Limited, Vynova Group, Tosoh Corporation, NOVA Chemicals, Dow, Mexichem, The Axiall Corporation, Shin-Etsu PVC B V.
3. What are the main segments of the Vinyl Chloride Monomer Industry?
The market segments include Application, End-user Industry .
4. Can you provide details about the market size?
The market size is estimated to be USD XX Million as of 2022.
5. What are some drivers contributing to market growth?
Rising Demand in Healthcare Sector; High Consumption from Building and Construction Industry.
6. What are the notable trends driving market growth?
Building and Construction Sector to Boost Market.
7. Are there any restraints impacting market growth?
Increasing Environmental Concerns and Availability of Substitutes in Various Applications; Other Restraints.
8. Can you provide examples of recent developments in the market?
April 2023: AGC developed Process Digital Twin for chemical plants and to begin the operation at its Vinyl Chloride Monomer manufacturing plant in Indonesia.
9. What pricing options are available for accessing the report?
Pricing options include single-user, multi-user, and enterprise licenses priced at USD 4750, USD 5250, and USD 8750 respectively.
10. Is the market size provided in terms of value or volume?
The market size is provided in terms of value, measured in Million and volume, measured in Million.
11. Are there any specific market keywords associated with the report?
Yes, the market keyword associated with the report is "Vinyl Chloride Monomer Industry," which aids in identifying and referencing the specific market segment covered.
12. How do I determine which pricing option suits my needs best?
The pricing options vary based on user requirements and access needs. Individual users may opt for single-user licenses, while businesses requiring broader access may choose multi-user or enterprise licenses for cost-effective access to the report.
13. Are there any additional resources or data provided in the Vinyl Chloride Monomer Industry report?
While the report offers comprehensive insights, it's advisable to review the specific contents or supplementary materials provided to ascertain if additional resources or data are available.
14. How can I stay updated on further developments or reports in the Vinyl Chloride Monomer Industry?
To stay informed about further developments, trends, and reports in the Vinyl Chloride Monomer Industry, consider subscribing to industry newsletters, following relevant companies and organizations, or regularly checking reputable industry news sources and publications.
Methodology
Step 1 - Identification of Relevant Samples Size from Population Database


Step 2 - Approaches for Defining Global Market Size (Value, Volume* & Price*)

Note*: In applicable scenarios
Step 3 - Data Sources
Primary Research
- Web Analytics
- Survey Reports
- Research Institute
- Latest Research Reports
- Opinion Leaders
Secondary Research
- Annual Reports
- White Paper
- Latest Press Release
- Industry Association
- Paid Database
- Investor Presentations

Step 4 - Data Triangulation
Involves using different sources of information in order to increase the validity of a study
These sources are likely to be stakeholders in a program - participants, other researchers, program staff, other community members, and so on.
Then we put all data in single framework & apply various statistical tools to find out the dynamic on the market.
During the analysis stage, feedback from the stakeholder groups would be compared to determine areas of agreement as well as areas of divergence


