


Key Insights
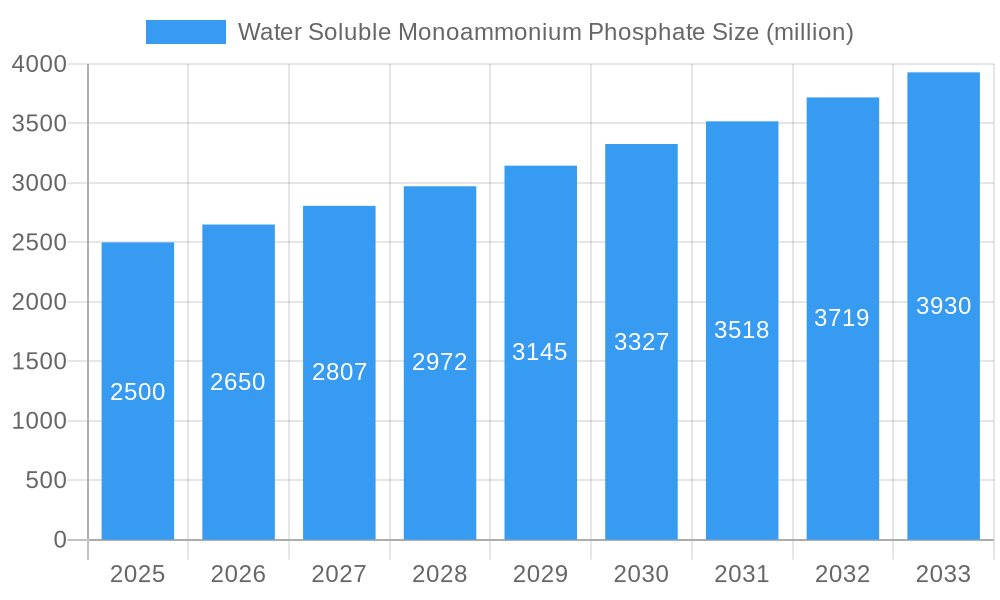
The global water-soluble monoammonium phosphate (MAP) market exhibits robust growth, driven primarily by the increasing demand for high-efficiency fertilizers in agriculture. The rising global population and the need to enhance crop yields are key factors fueling this demand. Water-soluble MAP offers superior nutrient uptake compared to traditional granular fertilizers, leading to improved crop quality and higher productivity. This advantage is particularly significant in controlled-environment agriculture (CEA), hydroponics, and fertigation systems, which are experiencing substantial growth themselves. Furthermore, the increasing adoption of precision farming techniques and the focus on sustainable agricultural practices further contribute to the market's expansion. Major players like Mosaic Company, OCP Group, and Koch Fertilizer are investing heavily in research and development to enhance the efficiency and sustainability of their MAP products, further driving market growth.
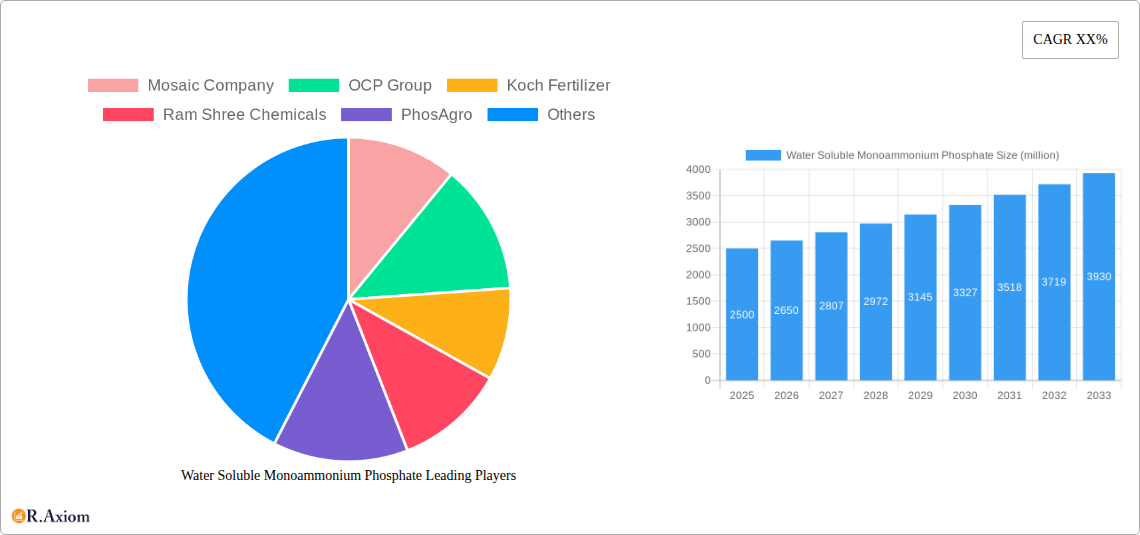
Water Soluble Monoammonium Phosphate Market Size (In Billion)

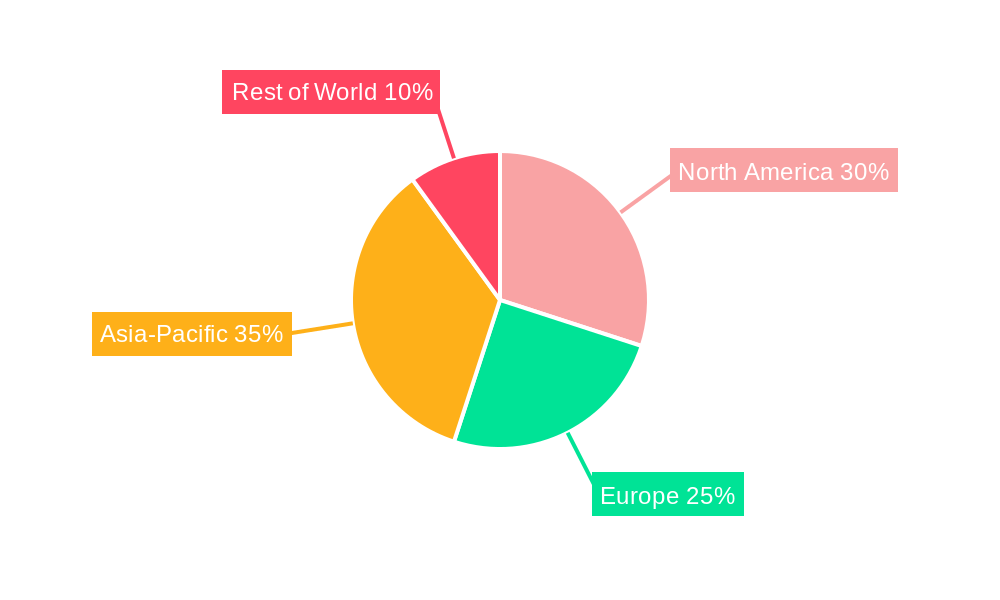
The market is segmented by application (e.g., field crops, horticulture, etc.) and geography. While precise regional market share data is unavailable, North America and Europe are expected to hold substantial shares due to their advanced agricultural practices and high adoption rates of advanced fertilization technologies. Asia-Pacific, driven by intensive agriculture and rising disposable incomes, is also poised for significant growth. However, fluctuating raw material prices (phosphate rock and ammonia), environmental regulations, and potential supply chain disruptions represent key challenges to market growth. Despite these restraints, the overall outlook for the water-soluble MAP market remains positive, with a projected Compound Annual Growth Rate (CAGR) of approximately 5-7% over the forecast period (2025-2033), resulting in a substantial increase in market value. Innovation in fertilizer technology, a focus on crop optimization, and increasing government support for sustainable agriculture will further contribute to this expansion.
Water Soluble Monoammonium Phosphate Company Market Share
Water Soluble Monoammonium Phosphate Market Report: 2019-2033
This comprehensive report provides an in-depth analysis of the global water soluble monoammonium phosphate (MAP) market, offering invaluable insights for stakeholders across the agricultural chemical industry. Covering the period from 2019 to 2033, with a focus on 2025, this report dissects market dynamics, competitive landscapes, and future growth trajectories. Key players, including Mosaic Company, OCP Group, Koch Fertilizer, and others, are meticulously analyzed to provide a holistic understanding of this vital market segment.
Water Soluble Monoammonium Phosphate Market Concentration & Innovation
This section analyzes the market concentration, highlighting the leading players and their market shares. We examine innovation drivers, such as the demand for high-efficiency fertilizers and sustainable agricultural practices. The regulatory landscape impacting MAP production and distribution is explored, along with an assessment of product substitutes and their market penetration. Furthermore, the report details end-user trends, focusing on shifts in farming practices and fertilizer application techniques. Finally, we delve into mergers and acquisitions (M&A) activity within the sector, including deal values and their impact on market consolidation.
- Market Concentration: The top 5 players account for approximately xx% of the global market share in 2025.
- Innovation Drivers: Development of slow-release MAP formulations, bio-based MAP alternatives, and precision fertilizer application technologies are key drivers.
- Regulatory Framework: Compliance with environmental regulations concerning phosphorus runoff and fertilizer usage significantly impacts the market.
- M&A Activity: Between 2019 and 2024, an estimated $xx million was invested in M&A deals within the MAP sector. This activity is expected to continue, driving further consolidation.
Water Soluble Monoammonium Phosphate Industry Trends & Insights
This section provides a detailed analysis of industry trends, including market growth drivers and technological disruptions. We examine evolving consumer preferences among farmers regarding fertilizer efficacy and sustainability. The competitive landscape is explored, focusing on pricing strategies, product differentiation, and market positioning of key players.
- Market Growth Drivers: Increasing global food demand, rising crop yields, and the adoption of advanced farming techniques are driving market growth.
- Technological Disruptions: The introduction of precision agriculture technologies and innovative fertilizer application methods are changing market dynamics.
- Consumer Preferences: Demand for high-quality, sustainable, and cost-effective MAP formulations is growing.
- Competitive Dynamics: Intense competition among major players is driving price optimization and continuous product improvement. The CAGR for the forecast period (2025-2033) is estimated to be xx%. Market penetration in developing economies is expected to reach xx% by 2033.
Dominant Markets & Segments in Water Soluble Monoammonium Phosphate
This section identifies the leading regions, countries, and segments within the water soluble MAP market. We perform an in-depth analysis of the factors driving market dominance in these areas, including economic policies, agricultural infrastructure, and farming practices.
- Dominant Region: Asia-Pacific is expected to remain the dominant region due to its vast agricultural land and expanding food production.
- Key Drivers (Asia-Pacific):
- Growing agricultural sector and rising demand for high-yielding crops.
- Government initiatives supporting agricultural modernization and fertilizer usage.
- Favorable climatic conditions in several key agricultural regions.
- Dominant Country: China and India are the leading consumers of water soluble MAP in the Asia-Pacific region. Detailed analysis of these markets, including specific market sizes for 2025, will be provided in the full report.
- Dominant Segment: The segment for high-analysis MAP formulations with enhanced nutrient delivery systems is experiencing significant growth.
Water Soluble Monoammonium Phosphate Product Developments
This section summarizes recent product innovations, highlighting advancements in formulation, application methods, and competitive advantages. We analyze technological trends that are shaping the future of MAP production and its integration into precision agriculture systems. The market fit of new products and their potential to disrupt existing market dynamics will be assessed.
Report Scope & Segmentation Analysis
This section details the market segmentation used in the report. The segments are defined by factors such as application (e.g., crops, horticulture), formulation (granular, liquid), and region. Each segment's growth projections, market sizes for the study period (2019-2033), and competitive dynamics are provided.
Key Drivers of Water Soluble Monoammonium Phosphate Growth
This section outlines the key factors contributing to the growth of the water soluble MAP market. This includes technological advancements in formulation and application, economic factors such as rising food prices and increased disposable income in developing countries, and supportive government policies. Specific examples of each driver will be included.
Challenges in the Water Soluble Monoammonium Phosphate Sector
This section addresses the challenges facing the water soluble MAP sector, including regulatory hurdles related to environmental protection, supply chain disruptions affecting raw material availability, and price volatility. The quantifiable impacts of these challenges on market growth will be discussed.
Emerging Opportunities in Water Soluble Monoammonium Phosphate
This section highlights emerging trends and opportunities, focusing on new markets, technological innovations in precision farming, and changes in consumer preferences towards sustainable agricultural practices.
Leading Players in the Water Soluble Monoammonium Phosphate Market
- Mosaic Company
- OCP Group
- Koch Fertilizer
- Ram Shree Chemicals
- PhosAgro
- Sichuan Hongda
- Hubei National Phosphate Fertilizer
- Xinjiang Zhongwo Chemical
- Yunnan Xiangfeng Industrial Group
- Yunnan Yuntianhua
Key Developments in Water Soluble Monoammonium Phosphate Industry
- [Year/Month]: Launch of a new slow-release MAP formulation by [Company Name].
- [Year/Month]: Acquisition of [Company A] by [Company B], leading to increased market share.
- [Year/Month]: Introduction of a new precision fertilizer application technology.
- [Year/Month]: Implementation of new environmental regulations impacting MAP production.
Strategic Outlook for Water Soluble Monoammonium Phosphate Market
The water soluble MAP market is poised for continued growth, driven by increasing global food demand and technological advancements in fertilizer production and application. Emerging markets in developing countries present significant growth opportunities. The focus on sustainable agriculture will further drive demand for high-efficiency, environmentally friendly MAP formulations. The market is expected to witness continued consolidation through M&A activities, leading to a more concentrated industry landscape.
Water Soluble Monoammonium Phosphate Segmentation
-
1. Application
- 1.1. Rice
- 1.2. Vegetable
- 1.3. Fruit Tree
- 1.4. Cotton
- 1.5. Others
-
2. Types
- 2.1. Total Nutrients Greater Than 68%
- 2.2. Total Nutrients Greater Than 72%
- 2.3. Total Nutrients Greater Than 73%
Water Soluble Monoammonium Phosphate Segmentation By Geography
-
1. North America
- 1.1. United States
- 1.2. Canada
- 1.3. Mexico
-
2. South America
- 2.1. Brazil
- 2.2. Argentina
- 2.3. Rest of South America
-
3. Europe
- 3.1. United Kingdom
- 3.2. Germany
- 3.3. France
- 3.4. Italy
- 3.5. Spain
- 3.6. Russia
- 3.7. Benelux
- 3.8. Nordics
- 3.9. Rest of Europe
-
4. Middle East & Africa
- 4.1. Turkey
- 4.2. Israel
- 4.3. GCC
- 4.4. North Africa
- 4.5. South Africa
- 4.6. Rest of Middle East & Africa
-
5. Asia Pacific
- 5.1. China
- 5.2. India
- 5.3. Japan
- 5.4. South Korea
- 5.5. ASEAN
- 5.6. Oceania
- 5.7. Rest of Asia Pacific
Water Soluble Monoammonium Phosphate Regional Market Share
Geographic Coverage of Water Soluble Monoammonium Phosphate
Water Soluble Monoammonium Phosphate REPORT HIGHLIGHTS
| Aspects | Details |
|---|---|
| Study Period | 2020-2034 |
| Base Year | 2025 |
| Estimated Year | 2026 |
| Forecast Period | 2026-2034 |
| Historical Period | 2020-2025 |
| Growth Rate | CAGR of XX% from 2020-2034 |
| Segmentation |
|
Table of Contents
- 1. Introduction
- 1.1. Research Scope
- 1.2. Market Segmentation
- 1.3. Research Methodology
- 1.4. Definitions and Assumptions
- 2. Executive Summary
- 2.1. Introduction
- 3. Market Dynamics
- 3.1. Introduction
- 3.2. Market Drivers
- 3.3. Market Restrains
- 3.4. Market Trends
- 4. Market Factor Analysis
- 4.1. Porters Five Forces
- 4.2. Supply/Value Chain
- 4.3. PESTEL analysis
- 4.4. Market Entropy
- 4.5. Patent/Trademark Analysis
- 5. Global Water Soluble Monoammonium Phosphate Analysis, Insights and Forecast, 2020-2032
- 5.1. Market Analysis, Insights and Forecast - by Application
- 5.1.1. Rice
- 5.1.2. Vegetable
- 5.1.3. Fruit Tree
- 5.1.4. Cotton
- 5.1.5. Others
- 5.2. Market Analysis, Insights and Forecast - by Types
- 5.2.1. Total Nutrients Greater Than 68%
- 5.2.2. Total Nutrients Greater Than 72%
- 5.2.3. Total Nutrients Greater Than 73%
- 5.3. Market Analysis, Insights and Forecast - by Region
- 5.3.1. North America
- 5.3.2. South America
- 5.3.3. Europe
- 5.3.4. Middle East & Africa
- 5.3.5. Asia Pacific
- 5.1. Market Analysis, Insights and Forecast - by Application
- 6. North America Water Soluble Monoammonium Phosphate Analysis, Insights and Forecast, 2020-2032
- 6.1. Market Analysis, Insights and Forecast - by Application
- 6.1.1. Rice
- 6.1.2. Vegetable
- 6.1.3. Fruit Tree
- 6.1.4. Cotton
- 6.1.5. Others
- 6.2. Market Analysis, Insights and Forecast - by Types
- 6.2.1. Total Nutrients Greater Than 68%
- 6.2.2. Total Nutrients Greater Than 72%
- 6.2.3. Total Nutrients Greater Than 73%
- 6.1. Market Analysis, Insights and Forecast - by Application
- 7. South America Water Soluble Monoammonium Phosphate Analysis, Insights and Forecast, 2020-2032
- 7.1. Market Analysis, Insights and Forecast - by Application
- 7.1.1. Rice
- 7.1.2. Vegetable
- 7.1.3. Fruit Tree
- 7.1.4. Cotton
- 7.1.5. Others
- 7.2. Market Analysis, Insights and Forecast - by Types
- 7.2.1. Total Nutrients Greater Than 68%
- 7.2.2. Total Nutrients Greater Than 72%
- 7.2.3. Total Nutrients Greater Than 73%
- 7.1. Market Analysis, Insights and Forecast - by Application
- 8. Europe Water Soluble Monoammonium Phosphate Analysis, Insights and Forecast, 2020-2032
- 8.1. Market Analysis, Insights and Forecast - by Application
- 8.1.1. Rice
- 8.1.2. Vegetable
- 8.1.3. Fruit Tree
- 8.1.4. Cotton
- 8.1.5. Others
- 8.2. Market Analysis, Insights and Forecast - by Types
- 8.2.1. Total Nutrients Greater Than 68%
- 8.2.2. Total Nutrients Greater Than 72%
- 8.2.3. Total Nutrients Greater Than 73%
- 8.1. Market Analysis, Insights and Forecast - by Application
- 9. Middle East & Africa Water Soluble Monoammonium Phosphate Analysis, Insights and Forecast, 2020-2032
- 9.1. Market Analysis, Insights and Forecast - by Application
- 9.1.1. Rice
- 9.1.2. Vegetable
- 9.1.3. Fruit Tree
- 9.1.4. Cotton
- 9.1.5. Others
- 9.2. Market Analysis, Insights and Forecast - by Types
- 9.2.1. Total Nutrients Greater Than 68%
- 9.2.2. Total Nutrients Greater Than 72%
- 9.2.3. Total Nutrients Greater Than 73%
- 9.1. Market Analysis, Insights and Forecast - by Application
- 10. Asia Pacific Water Soluble Monoammonium Phosphate Analysis, Insights and Forecast, 2020-2032
- 10.1. Market Analysis, Insights and Forecast - by Application
- 10.1.1. Rice
- 10.1.2. Vegetable
- 10.1.3. Fruit Tree
- 10.1.4. Cotton
- 10.1.5. Others
- 10.2. Market Analysis, Insights and Forecast - by Types
- 10.2.1. Total Nutrients Greater Than 68%
- 10.2.2. Total Nutrients Greater Than 72%
- 10.2.3. Total Nutrients Greater Than 73%
- 10.1. Market Analysis, Insights and Forecast - by Application
- 11. Competitive Analysis
- 11.1. Global Market Share Analysis 2025
- 11.2. Company Profiles
- 11.2.1 Mosaic Company
- 11.2.1.1. Overview
- 11.2.1.2. Products
- 11.2.1.3. SWOT Analysis
- 11.2.1.4. Recent Developments
- 11.2.1.5. Financials (Based on Availability)
- 11.2.2 OCP Group
- 11.2.2.1. Overview
- 11.2.2.2. Products
- 11.2.2.3. SWOT Analysis
- 11.2.2.4. Recent Developments
- 11.2.2.5. Financials (Based on Availability)
- 11.2.3 Koch Fertilizer
- 11.2.3.1. Overview
- 11.2.3.2. Products
- 11.2.3.3. SWOT Analysis
- 11.2.3.4. Recent Developments
- 11.2.3.5. Financials (Based on Availability)
- 11.2.4 Ram Shree Chemicals
- 11.2.4.1. Overview
- 11.2.4.2. Products
- 11.2.4.3. SWOT Analysis
- 11.2.4.4. Recent Developments
- 11.2.4.5. Financials (Based on Availability)
- 11.2.5 PhosAgro
- 11.2.5.1. Overview
- 11.2.5.2. Products
- 11.2.5.3. SWOT Analysis
- 11.2.5.4. Recent Developments
- 11.2.5.5. Financials (Based on Availability)
- 11.2.6 Sichuan Hongda
- 11.2.6.1. Overview
- 11.2.6.2. Products
- 11.2.6.3. SWOT Analysis
- 11.2.6.4. Recent Developments
- 11.2.6.5. Financials (Based on Availability)
- 11.2.7 Hubei National Phosphate Fertilizer
- 11.2.7.1. Overview
- 11.2.7.2. Products
- 11.2.7.3. SWOT Analysis
- 11.2.7.4. Recent Developments
- 11.2.7.5. Financials (Based on Availability)
- 11.2.8 Xinjiang Zhongwo Chemical
- 11.2.8.1. Overview
- 11.2.8.2. Products
- 11.2.8.3. SWOT Analysis
- 11.2.8.4. Recent Developments
- 11.2.8.5. Financials (Based on Availability)
- 11.2.9 Yunnan Xiangfeng Industrial Group
- 11.2.9.1. Overview
- 11.2.9.2. Products
- 11.2.9.3. SWOT Analysis
- 11.2.9.4. Recent Developments
- 11.2.9.5. Financials (Based on Availability)
- 11.2.10 Yunnan Yuntianhua
- 11.2.10.1. Overview
- 11.2.10.2. Products
- 11.2.10.3. SWOT Analysis
- 11.2.10.4. Recent Developments
- 11.2.10.5. Financials (Based on Availability)
- 11.2.1 Mosaic Company
List of Figures
- Figure 1: Global Water Soluble Monoammonium Phosphate Revenue Breakdown (million, %) by Region 2025 & 2033
- Figure 2: North America Water Soluble Monoammonium Phosphate Revenue (million), by Application 2025 & 2033
- Figure 3: North America Water Soluble Monoammonium Phosphate Revenue Share (%), by Application 2025 & 2033
- Figure 4: North America Water Soluble Monoammonium Phosphate Revenue (million), by Types 2025 & 2033
- Figure 5: North America Water Soluble Monoammonium Phosphate Revenue Share (%), by Types 2025 & 2033
- Figure 6: North America Water Soluble Monoammonium Phosphate Revenue (million), by Country 2025 & 2033
- Figure 7: North America Water Soluble Monoammonium Phosphate Revenue Share (%), by Country 2025 & 2033
- Figure 8: South America Water Soluble Monoammonium Phosphate Revenue (million), by Application 2025 & 2033
- Figure 9: South America Water Soluble Monoammonium Phosphate Revenue Share (%), by Application 2025 & 2033
- Figure 10: South America Water Soluble Monoammonium Phosphate Revenue (million), by Types 2025 & 2033
- Figure 11: South America Water Soluble Monoammonium Phosphate Revenue Share (%), by Types 2025 & 2033
- Figure 12: South America Water Soluble Monoammonium Phosphate Revenue (million), by Country 2025 & 2033
- Figure 13: South America Water Soluble Monoammonium Phosphate Revenue Share (%), by Country 2025 & 2033
- Figure 14: Europe Water Soluble Monoammonium Phosphate Revenue (million), by Application 2025 & 2033
- Figure 15: Europe Water Soluble Monoammonium Phosphate Revenue Share (%), by Application 2025 & 2033
- Figure 16: Europe Water Soluble Monoammonium Phosphate Revenue (million), by Types 2025 & 2033
- Figure 17: Europe Water Soluble Monoammonium Phosphate Revenue Share (%), by Types 2025 & 2033
- Figure 18: Europe Water Soluble Monoammonium Phosphate Revenue (million), by Country 2025 & 2033
- Figure 19: Europe Water Soluble Monoammonium Phosphate Revenue Share (%), by Country 2025 & 2033
- Figure 20: Middle East & Africa Water Soluble Monoammonium Phosphate Revenue (million), by Application 2025 & 2033
- Figure 21: Middle East & Africa Water Soluble Monoammonium Phosphate Revenue Share (%), by Application 2025 & 2033
- Figure 22: Middle East & Africa Water Soluble Monoammonium Phosphate Revenue (million), by Types 2025 & 2033
- Figure 23: Middle East & Africa Water Soluble Monoammonium Phosphate Revenue Share (%), by Types 2025 & 2033
- Figure 24: Middle East & Africa Water Soluble Monoammonium Phosphate Revenue (million), by Country 2025 & 2033
- Figure 25: Middle East & Africa Water Soluble Monoammonium Phosphate Revenue Share (%), by Country 2025 & 2033
- Figure 26: Asia Pacific Water Soluble Monoammonium Phosphate Revenue (million), by Application 2025 & 2033
- Figure 27: Asia Pacific Water Soluble Monoammonium Phosphate Revenue Share (%), by Application 2025 & 2033
- Figure 28: Asia Pacific Water Soluble Monoammonium Phosphate Revenue (million), by Types 2025 & 2033
- Figure 29: Asia Pacific Water Soluble Monoammonium Phosphate Revenue Share (%), by Types 2025 & 2033
- Figure 30: Asia Pacific Water Soluble Monoammonium Phosphate Revenue (million), by Country 2025 & 2033
- Figure 31: Asia Pacific Water Soluble Monoammonium Phosphate Revenue Share (%), by Country 2025 & 2033
List of Tables
- Table 1: Global Water Soluble Monoammonium Phosphate Revenue million Forecast, by Application 2020 & 2033
- Table 2: Global Water Soluble Monoammonium Phosphate Revenue million Forecast, by Types 2020 & 2033
- Table 3: Global Water Soluble Monoammonium Phosphate Revenue million Forecast, by Region 2020 & 2033
- Table 4: Global Water Soluble Monoammonium Phosphate Revenue million Forecast, by Application 2020 & 2033
- Table 5: Global Water Soluble Monoammonium Phosphate Revenue million Forecast, by Types 2020 & 2033
- Table 6: Global Water Soluble Monoammonium Phosphate Revenue million Forecast, by Country 2020 & 2033
- Table 7: United States Water Soluble Monoammonium Phosphate Revenue (million) Forecast, by Application 2020 & 2033
- Table 8: Canada Water Soluble Monoammonium Phosphate Revenue (million) Forecast, by Application 2020 & 2033
- Table 9: Mexico Water Soluble Monoammonium Phosphate Revenue (million) Forecast, by Application 2020 & 2033
- Table 10: Global Water Soluble Monoammonium Phosphate Revenue million Forecast, by Application 2020 & 2033
- Table 11: Global Water Soluble Monoammonium Phosphate Revenue million Forecast, by Types 2020 & 2033
- Table 12: Global Water Soluble Monoammonium Phosphate Revenue million Forecast, by Country 2020 & 2033
- Table 13: Brazil Water Soluble Monoammonium Phosphate Revenue (million) Forecast, by Application 2020 & 2033
- Table 14: Argentina Water Soluble Monoammonium Phosphate Revenue (million) Forecast, by Application 2020 & 2033
- Table 15: Rest of South America Water Soluble Monoammonium Phosphate Revenue (million) Forecast, by Application 2020 & 2033
- Table 16: Global Water Soluble Monoammonium Phosphate Revenue million Forecast, by Application 2020 & 2033
- Table 17: Global Water Soluble Monoammonium Phosphate Revenue million Forecast, by Types 2020 & 2033
- Table 18: Global Water Soluble Monoammonium Phosphate Revenue million Forecast, by Country 2020 & 2033
- Table 19: United Kingdom Water Soluble Monoammonium Phosphate Revenue (million) Forecast, by Application 2020 & 2033
- Table 20: Germany Water Soluble Monoammonium Phosphate Revenue (million) Forecast, by Application 2020 & 2033
- Table 21: France Water Soluble Monoammonium Phosphate Revenue (million) Forecast, by Application 2020 & 2033
- Table 22: Italy Water Soluble Monoammonium Phosphate Revenue (million) Forecast, by Application 2020 & 2033
- Table 23: Spain Water Soluble Monoammonium Phosphate Revenue (million) Forecast, by Application 2020 & 2033
- Table 24: Russia Water Soluble Monoammonium Phosphate Revenue (million) Forecast, by Application 2020 & 2033
- Table 25: Benelux Water Soluble Monoammonium Phosphate Revenue (million) Forecast, by Application 2020 & 2033
- Table 26: Nordics Water Soluble Monoammonium Phosphate Revenue (million) Forecast, by Application 2020 & 2033
- Table 27: Rest of Europe Water Soluble Monoammonium Phosphate Revenue (million) Forecast, by Application 2020 & 2033
- Table 28: Global Water Soluble Monoammonium Phosphate Revenue million Forecast, by Application 2020 & 2033
- Table 29: Global Water Soluble Monoammonium Phosphate Revenue million Forecast, by Types 2020 & 2033
- Table 30: Global Water Soluble Monoammonium Phosphate Revenue million Forecast, by Country 2020 & 2033
- Table 31: Turkey Water Soluble Monoammonium Phosphate Revenue (million) Forecast, by Application 2020 & 2033
- Table 32: Israel Water Soluble Monoammonium Phosphate Revenue (million) Forecast, by Application 2020 & 2033
- Table 33: GCC Water Soluble Monoammonium Phosphate Revenue (million) Forecast, by Application 2020 & 2033
- Table 34: North Africa Water Soluble Monoammonium Phosphate Revenue (million) Forecast, by Application 2020 & 2033
- Table 35: South Africa Water Soluble Monoammonium Phosphate Revenue (million) Forecast, by Application 2020 & 2033
- Table 36: Rest of Middle East & Africa Water Soluble Monoammonium Phosphate Revenue (million) Forecast, by Application 2020 & 2033
- Table 37: Global Water Soluble Monoammonium Phosphate Revenue million Forecast, by Application 2020 & 2033
- Table 38: Global Water Soluble Monoammonium Phosphate Revenue million Forecast, by Types 2020 & 2033
- Table 39: Global Water Soluble Monoammonium Phosphate Revenue million Forecast, by Country 2020 & 2033
- Table 40: China Water Soluble Monoammonium Phosphate Revenue (million) Forecast, by Application 2020 & 2033
- Table 41: India Water Soluble Monoammonium Phosphate Revenue (million) Forecast, by Application 2020 & 2033
- Table 42: Japan Water Soluble Monoammonium Phosphate Revenue (million) Forecast, by Application 2020 & 2033
- Table 43: South Korea Water Soluble Monoammonium Phosphate Revenue (million) Forecast, by Application 2020 & 2033
- Table 44: ASEAN Water Soluble Monoammonium Phosphate Revenue (million) Forecast, by Application 2020 & 2033
- Table 45: Oceania Water Soluble Monoammonium Phosphate Revenue (million) Forecast, by Application 2020 & 2033
- Table 46: Rest of Asia Pacific Water Soluble Monoammonium Phosphate Revenue (million) Forecast, by Application 2020 & 2033
Frequently Asked Questions
1. What is the projected Compound Annual Growth Rate (CAGR) of the Water Soluble Monoammonium Phosphate?
The projected CAGR is approximately XX%.
2. Which companies are prominent players in the Water Soluble Monoammonium Phosphate?
Key companies in the market include Mosaic Company, OCP Group, Koch Fertilizer, Ram Shree Chemicals, PhosAgro, Sichuan Hongda, Hubei National Phosphate Fertilizer, Xinjiang Zhongwo Chemical, Yunnan Xiangfeng Industrial Group, Yunnan Yuntianhua.
3. What are the main segments of the Water Soluble Monoammonium Phosphate?
The market segments include Application, Types.
4. Can you provide details about the market size?
The market size is estimated to be USD XXX million as of 2022.
5. What are some drivers contributing to market growth?
N/A
6. What are the notable trends driving market growth?
N/A
7. Are there any restraints impacting market growth?
N/A
8. Can you provide examples of recent developments in the market?
N/A
9. What pricing options are available for accessing the report?
Pricing options include single-user, multi-user, and enterprise licenses priced at USD 4900.00, USD 7350.00, and USD 9800.00 respectively.
10. Is the market size provided in terms of value or volume?
The market size is provided in terms of value, measured in million.
11. Are there any specific market keywords associated with the report?
Yes, the market keyword associated with the report is "Water Soluble Monoammonium Phosphate," which aids in identifying and referencing the specific market segment covered.
12. How do I determine which pricing option suits my needs best?
The pricing options vary based on user requirements and access needs. Individual users may opt for single-user licenses, while businesses requiring broader access may choose multi-user or enterprise licenses for cost-effective access to the report.
13. Are there any additional resources or data provided in the Water Soluble Monoammonium Phosphate report?
While the report offers comprehensive insights, it's advisable to review the specific contents or supplementary materials provided to ascertain if additional resources or data are available.
14. How can I stay updated on further developments or reports in the Water Soluble Monoammonium Phosphate?
To stay informed about further developments, trends, and reports in the Water Soluble Monoammonium Phosphate, consider subscribing to industry newsletters, following relevant companies and organizations, or regularly checking reputable industry news sources and publications.
Methodology
Step 1 - Identification of Relevant Samples Size from Population Database


Step 2 - Approaches for Defining Global Market Size (Value, Volume* & Price*)

Note*: In applicable scenarios
Step 3 - Data Sources
Primary Research
- Web Analytics
- Survey Reports
- Research Institute
- Latest Research Reports
- Opinion Leaders
Secondary Research
- Annual Reports
- White Paper
- Latest Press Release
- Industry Association
- Paid Database
- Investor Presentations

Step 4 - Data Triangulation
Involves using different sources of information in order to increase the validity of a study
These sources are likely to be stakeholders in a program - participants, other researchers, program staff, other community members, and so on.
Then we put all data in single framework & apply various statistical tools to find out the dynamic on the market.
During the analysis stage, feedback from the stakeholder groups would be compared to determine areas of agreement as well as areas of divergence