
Key Insights
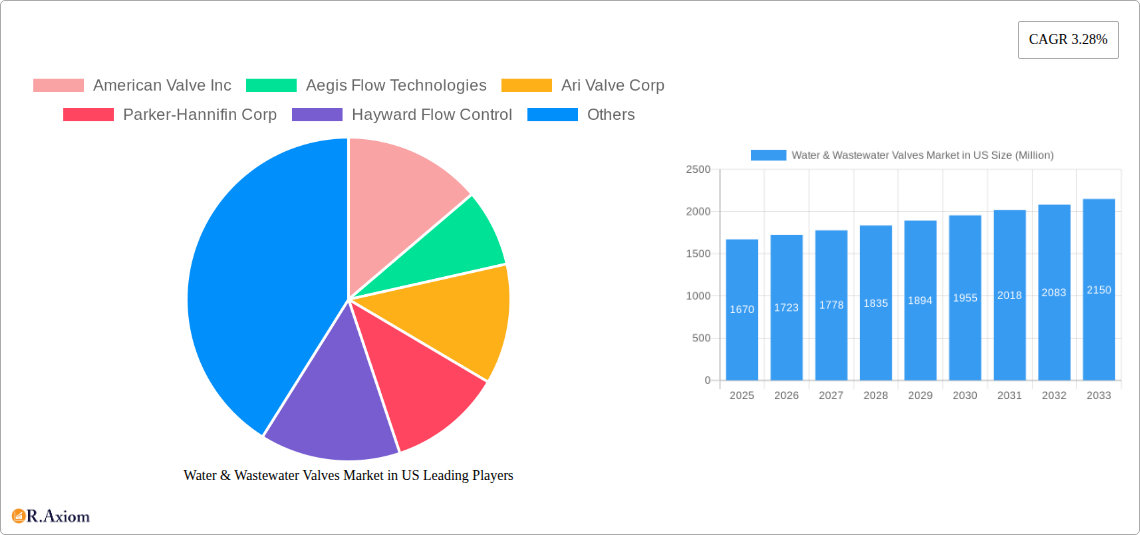
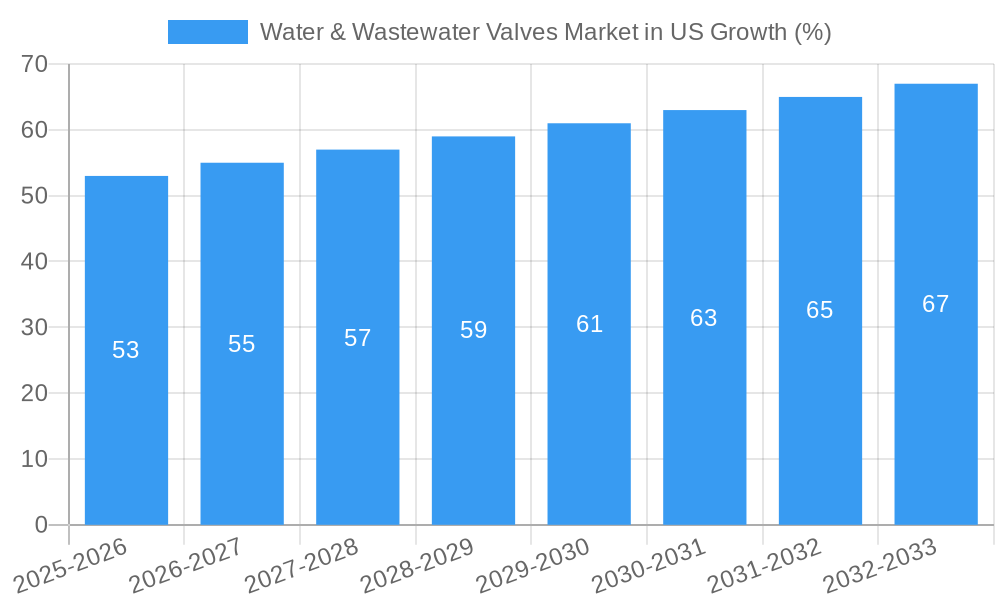
The US water and wastewater valves market, valued at $1.67 billion in 2025, is projected to experience steady growth, driven by increasing investments in water infrastructure upgrades and expansion of wastewater treatment facilities across the nation. A Compound Annual Growth Rate (CAGR) of 3.28% from 2025 to 2033 indicates a positive outlook, fueled by the aging infrastructure requiring replacements and renovations. The market is segmented by valve type (ball, butterfly, gate, globe, check, pressure relief, automatic control, strainer, and others), region (Northeast, Southwest, West, Southeast, Midwest), and wastewater application (water distribution and wastewater treatment). Growing concerns regarding water scarcity and stringent environmental regulations are further bolstering demand for efficient and reliable valve systems. Increased adoption of smart water management technologies and automation in water and wastewater treatment plants will drive demand for advanced control valves and automated valve systems, contributing to the market's growth. Competition is robust, with key players including American Valve Inc, Parker-Hannifin Corp, Flowserve Corporation, and others, constantly innovating to meet the evolving needs of the industry. The Midwest and Northeast regions, with their extensive existing infrastructure and population density, are expected to represent significant market shares.
The robust growth is anticipated to be slightly moderated by factors such as economic fluctuations impacting capital expenditure on infrastructure projects. However, government initiatives promoting sustainable water management and the long-term need for infrastructure maintenance are counterbalancing these restraints. Furthermore, technological advancements in valve design, improving efficiency and durability, contribute to the market's resilience. The market will see further segmentation within valve types, with increasing demand for specialized valves tailored to specific wastewater treatment processes. The focus on energy efficiency and reduced operational costs will also influence purchasing decisions, pushing the market towards more advanced and sustainable valve solutions. This continuous evolution of technology and regulatory pressures ensures the continued growth and adaptation of the US water and wastewater valves market.
This in-depth report provides a comprehensive analysis of the Water & Wastewater Valves market in the US, covering market size, segmentation, growth drivers, challenges, competitive landscape, and future outlook. The study period spans from 2019 to 2033, with 2025 as the base year and forecast period from 2025 to 2033. The report offers actionable insights for industry stakeholders, including manufacturers, distributors, investors, and regulatory bodies.
Water & Wastewater Valves Market in US Market Concentration & Innovation
The US water and wastewater valves market exhibits a moderately concentrated landscape, with several major players holding significant market share. While precise market share figures for each company remain proprietary information, key players like Parker-Hannifin Corp, Flowserve Corporation, and Emerson Electric Co., hold substantial positions due to their established brand reputation, extensive product portfolios, and robust distribution networks. Smaller, specialized companies like DeZURIK Inc and Cla-Val Company cater to niche segments, focusing on innovation and specific valve types. The market exhibits both organic growth through product innovation and inorganic growth via mergers and acquisitions (M&A). Recent M&A activity, though not publicly disclosed with precise valuations in many instances, indicates a trend towards consolidation and expansion into new technological areas.
- Innovation Drivers: Technological advancements, particularly in smart valves with remote monitoring and control capabilities, drive innovation. Regulatory mandates emphasizing water conservation and efficient wastewater treatment also push market players towards sustainable and technologically advanced solutions.
- Regulatory Frameworks: EPA regulations and state-level water quality standards significantly impact the market, driving demand for valves that meet stringent performance and safety requirements.
- Product Substitutes: While direct substitutes are limited, improvements in alternative piping materials and pumping technologies could subtly influence market demand.
- End-User Trends: The increasing focus on smart city infrastructure and the growing adoption of automated control systems are key drivers of market growth.
- M&A Activities: While exact deal values are often confidential, several acquisitions and mergers have occurred, consolidating market share and driving technological advancements.
Water & Wastewater Valves Market in US Industry Trends & Insights
The US water and wastewater valves market is experiencing robust growth, driven by several key factors. Aging infrastructure necessitates significant upgrades and replacements, fueling demand for new valves. Furthermore, increasing urbanization and population growth put pressure on existing water and wastewater systems, resulting in expansions and modernization projects. The market is also witnessing a technological shift towards smart valves and automated control systems, enhancing operational efficiency and reducing water loss. The Compound Annual Growth Rate (CAGR) for the forecast period (2025-2033) is estimated to be xx%, reflecting the continued investment in infrastructure development and technological upgrades. Market penetration of smart valves is gradually increasing, projected to reach xx% by 2033. Competitive dynamics are characterized by both price competition and differentiation based on technological capabilities and service offerings. Consumer preferences are shifting towards energy-efficient, reliable, and easily maintainable valves, leading manufacturers to prioritize these features in their product development.
Dominant Markets & Segments in Water & Wastewater Valves Market in US
The Northeast and West regions of the US represent the most significant market segments due to higher population density, aging infrastructure, and stringent environmental regulations. Within valve types, ball valves and butterfly valves dominate owing to their versatility and cost-effectiveness in various applications.
Key Drivers (By Region):
- Northeast: Aging infrastructure, stringent environmental regulations, higher population density.
- West: Rapid urbanization, water scarcity concerns, investments in water management infrastructure.
- Midwest: Agricultural irrigation, industrial applications.
- Southeast: Population growth, coastal infrastructure development.
- Southwest: Water scarcity, investments in water conservation technologies.
Key Drivers (By Type):
- Ball Valves: Versatility, cost-effectiveness, wide range of sizes and materials.
- Butterfly Valves: Suitable for large-diameter pipelines, cost-effective for throttling applications.
- Gate Valves: Primarily used for on/off applications.
- Globe Valves: Suitable for throttling and regulating flow.
- Check Valves: Prevent backflow in pipelines.
- Pressure Relief Valves: Ensure system safety by relieving excess pressure.
- Automatic Control Valves: Enhance operational efficiency and automation.
- Strainer Valves: Protect downstream equipment from debris.
Key Drivers (By Application):
- Water Distribution: Aging infrastructure requiring upgrades and replacements.
- Wastewater Treatment and Disposal: Growing need for efficient and reliable wastewater management systems.
Dominance analysis shows that ball valves and butterfly valves together account for approximately xx% of the total market value, showcasing their significant market share.
Water & Wastewater Valves Market in US Product Developments
Recent product innovations highlight a focus on smart technologies, enhanced durability, and improved efficiency. Manufacturers are integrating advanced sensors, data analytics, and remote monitoring capabilities into valves, enabling predictive maintenance and optimizing system performance. New materials and designs are improving valve lifespan and resistance to corrosion, while enhanced sealing mechanisms ensure leak-free operations. These innovations address market demands for reliable, efficient, and sustainable water and wastewater management solutions.
Report Scope & Segmentation Analysis
This report segments the US water and wastewater valves market by valve type (Ball Valves, Butterfly Valves, Gate Valves, Globe Valves, Check Valves, Pressure Relief Valves, Automatic Control Valves, Strainer Valves, and Others), region (Northeast, Southwest, West, Southeast, Midwest), and wastewater application (Water Distribution, Wastewater Treatment and Disposal). Each segment's growth projections are based on detailed market size estimations and an analysis of competitive dynamics within each segment. The projected market size for each segment varies significantly based on regional infrastructure investment, technological advancements, and regulatory changes. For example, the smart valve segment within the automatic control valves category is projected to experience the highest growth rate due to increased automation and smart city initiatives.
Key Drivers of Water & Wastewater Valves Market in US Growth
The market's growth is primarily driven by the increasing need to upgrade aging water infrastructure, stringent environmental regulations promoting water conservation, growing urbanization and population growth increasing demand for water and wastewater services, and the rising adoption of smart technologies enhancing operational efficiency and sustainability. Government initiatives promoting infrastructure investment further stimulate market growth.
Challenges in the Water & Wastewater Valves Market in US Sector
Challenges include the high initial cost of smart valve technologies, potential supply chain disruptions affecting valve component availability, and intense competition among established and emerging players. Regulatory compliance and obtaining necessary permits for infrastructure projects also pose obstacles. These factors can impact market growth and profitability, necessitating strategic planning and adaptation by market participants.
Emerging Opportunities in Water & Wastewater Valves Market in US
Emerging opportunities lie in the development and adoption of advanced materials for enhanced durability and corrosion resistance, the integration of advanced sensor technologies for predictive maintenance, the expansion into new markets (e.g., industrial water treatment), and the growing demand for energy-efficient valves. The increasing focus on sustainability and circular economy principles will further drive innovation and create new market opportunities.
Leading Players in the Water & Wastewater Valves Market in US Market
- American Valve Inc
- Aegis Flow Technologies
- Ari Valve Corp
- Parker-Hannifin Corp
- Hayward Flow Control
- Flowserve Corporation
- Bi-Torq Valve Automation
- U S Valve LLC
- DeZURIK Inc
- Baker Hughes
- Bray International Inc
- Emerson Electric Co
- CIRCOR International Inc
- Crane Co (Crane Fluid Systems)
- Flomatic Corporation (Boshart Industries Inc )
- Cla-Val Company
- AMERICAN Cast Iron Pipe Company
- Asahi/America Inc (Asahi Yukizai Corporation)
- BELIMO Aircontrols (USA) Inc
- Watts Water Technologies Inc
- Schlumberger Limited
- *List Not Exhaustive
Key Developments in Water & Wastewater Valves Market in US Industry
September 2022: DEZURIK announced the release of Extended Flange Urethane Lined Knife Gate Valves. This innovation offers a direct replacement for existing valves with the added benefit of preventing material discharge during cycling, enhancing efficiency and minimizing waste.
May 2022: Emerson introduced the TopWorx™ DX PST with HART 7. This smart valve technology provides valuable data and diagnostic information, facilitating predictive maintenance and digital transformation within water and wastewater management systems. This launch strengthens Emerson's position in the smart valve market segment.
Strategic Outlook for Water & Wastewater Valves Market in US Market
The US water and wastewater valves market is poised for continued growth, driven by aging infrastructure upgrades, technological advancements in smart valves, and the increasing focus on efficient water management. Opportunities for innovation and expansion exist in sustainable materials, enhanced automation, and the integration of digital technologies. Companies that effectively leverage these opportunities and adapt to the evolving regulatory landscape will be best positioned for success in this dynamic market.
Water & Wastewater Valves Market in US Segmentation
-
1. Type
- 1.1. Ball Valves
- 1.2. Butterfly Valves
- 1.3. Gate Valves
- 1.4. Globe Valves
- 1.5. Check Valves
- 1.6. Pressure
- 1.7. Automatic Control Valves
- 1.8. Strainer Valves and Others
-
2. Wastewater Application
- 2.1. Water Distribution
- 2.2. Wastewater Treatment and Disposal
Water & Wastewater Valves Market in US Segmentation By Geography
-
1. North America
- 1.1. United States
- 1.2. Canada
- 1.3. Mexico
-
2. South America
- 2.1. Brazil
- 2.2. Argentina
- 2.3. Rest of South America
-
3. Europe
- 3.1. United Kingdom
- 3.2. Germany
- 3.3. France
- 3.4. Italy
- 3.5. Spain
- 3.6. Russia
- 3.7. Benelux
- 3.8. Nordics
- 3.9. Rest of Europe
-
4. Middle East & Africa
- 4.1. Turkey
- 4.2. Israel
- 4.3. GCC
- 4.4. North Africa
- 4.5. South Africa
- 4.6. Rest of Middle East & Africa
-
5. Asia Pacific
- 5.1. China
- 5.2. India
- 5.3. Japan
- 5.4. South Korea
- 5.5. ASEAN
- 5.6. Oceania
- 5.7. Rest of Asia Pacific

Water & Wastewater Valves Market in US REPORT HIGHLIGHTS
| Aspects | Details |
|---|---|
| Study Period | 2019-2033 |
| Base Year | 2024 |
| Estimated Year | 2025 |
| Forecast Period | 2025-2033 |
| Historical Period | 2019-2024 |
| Growth Rate | CAGR of 3.28% from 2019-2033 |
| Segmentation |
|
Table of Contents
- 1. Introduction
- 1.1. Research Scope
- 1.2. Market Segmentation
- 1.3. Research Methodology
- 1.4. Definitions and Assumptions
- 2. Executive Summary
- 2.1. Introduction
- 3. Market Dynamics
- 3.1. Introduction
- 3.2. Market Drivers
- 3.2.1. The Need to Replace Aging Water and Wastewater Infrastructure Across the Nation and Supporting Government Loans
- 3.3. Market Restrains
- 3.3.1. Operational Challenges and High Levels of Competition Leading to Price Pressures for Manufacturers
- 3.4. Market Trends
- 3.4.1. The Need to Replace Aging Water and Wastewater Infrastructure Across the Nation and Supporting Government Loans
- 4. Market Factor Analysis
- 4.1. Porters Five Forces
- 4.2. Supply/Value Chain
- 4.3. PESTEL analysis
- 4.4. Market Entropy
- 4.5. Patent/Trademark Analysis
- 5. Global Water & Wastewater Valves Market in US Analysis, Insights and Forecast, 2019-2031
- 5.1. Market Analysis, Insights and Forecast - by Type
- 5.1.1. Ball Valves
- 5.1.2. Butterfly Valves
- 5.1.3. Gate Valves
- 5.1.4. Globe Valves
- 5.1.5. Check Valves
- 5.1.6. Pressure
- 5.1.7. Automatic Control Valves
- 5.1.8. Strainer Valves and Others
- 5.2. Market Analysis, Insights and Forecast - by Wastewater Application
- 5.2.1. Water Distribution
- 5.2.2. Wastewater Treatment and Disposal
- 5.3. Market Analysis, Insights and Forecast - by Region
- 5.3.1. North America
- 5.3.2. South America
- 5.3.3. Europe
- 5.3.4. Middle East & Africa
- 5.3.5. Asia Pacific
- 5.1. Market Analysis, Insights and Forecast - by Type
- 6. North America Water & Wastewater Valves Market in US Analysis, Insights and Forecast, 2019-2031
- 6.1. Market Analysis, Insights and Forecast - by Type
- 6.1.1. Ball Valves
- 6.1.2. Butterfly Valves
- 6.1.3. Gate Valves
- 6.1.4. Globe Valves
- 6.1.5. Check Valves
- 6.1.6. Pressure
- 6.1.7. Automatic Control Valves
- 6.1.8. Strainer Valves and Others
- 6.2. Market Analysis, Insights and Forecast - by Wastewater Application
- 6.2.1. Water Distribution
- 6.2.2. Wastewater Treatment and Disposal
- 6.1. Market Analysis, Insights and Forecast - by Type
- 7. South America Water & Wastewater Valves Market in US Analysis, Insights and Forecast, 2019-2031
- 7.1. Market Analysis, Insights and Forecast - by Type
- 7.1.1. Ball Valves
- 7.1.2. Butterfly Valves
- 7.1.3. Gate Valves
- 7.1.4. Globe Valves
- 7.1.5. Check Valves
- 7.1.6. Pressure
- 7.1.7. Automatic Control Valves
- 7.1.8. Strainer Valves and Others
- 7.2. Market Analysis, Insights and Forecast - by Wastewater Application
- 7.2.1. Water Distribution
- 7.2.2. Wastewater Treatment and Disposal
- 7.1. Market Analysis, Insights and Forecast - by Type
- 8. Europe Water & Wastewater Valves Market in US Analysis, Insights and Forecast, 2019-2031
- 8.1. Market Analysis, Insights and Forecast - by Type
- 8.1.1. Ball Valves
- 8.1.2. Butterfly Valves
- 8.1.3. Gate Valves
- 8.1.4. Globe Valves
- 8.1.5. Check Valves
- 8.1.6. Pressure
- 8.1.7. Automatic Control Valves
- 8.1.8. Strainer Valves and Others
- 8.2. Market Analysis, Insights and Forecast - by Wastewater Application
- 8.2.1. Water Distribution
- 8.2.2. Wastewater Treatment and Disposal
- 8.1. Market Analysis, Insights and Forecast - by Type
- 9. Middle East & Africa Water & Wastewater Valves Market in US Analysis, Insights and Forecast, 2019-2031
- 9.1. Market Analysis, Insights and Forecast - by Type
- 9.1.1. Ball Valves
- 9.1.2. Butterfly Valves
- 9.1.3. Gate Valves
- 9.1.4. Globe Valves
- 9.1.5. Check Valves
- 9.1.6. Pressure
- 9.1.7. Automatic Control Valves
- 9.1.8. Strainer Valves and Others
- 9.2. Market Analysis, Insights and Forecast - by Wastewater Application
- 9.2.1. Water Distribution
- 9.2.2. Wastewater Treatment and Disposal
- 9.1. Market Analysis, Insights and Forecast - by Type
- 10. Asia Pacific Water & Wastewater Valves Market in US Analysis, Insights and Forecast, 2019-2031
- 10.1. Market Analysis, Insights and Forecast - by Type
- 10.1.1. Ball Valves
- 10.1.2. Butterfly Valves
- 10.1.3. Gate Valves
- 10.1.4. Globe Valves
- 10.1.5. Check Valves
- 10.1.6. Pressure
- 10.1.7. Automatic Control Valves
- 10.1.8. Strainer Valves and Others
- 10.2. Market Analysis, Insights and Forecast - by Wastewater Application
- 10.2.1. Water Distribution
- 10.2.2. Wastewater Treatment and Disposal
- 10.1. Market Analysis, Insights and Forecast - by Type
- 11. Northeast Water & Wastewater Valves Market in US Analysis, Insights and Forecast, 2019-2031
- 12. Southeast Water & Wastewater Valves Market in US Analysis, Insights and Forecast, 2019-2031
- 13. Midwest Water & Wastewater Valves Market in US Analysis, Insights and Forecast, 2019-2031
- 14. Southwest Water & Wastewater Valves Market in US Analysis, Insights and Forecast, 2019-2031
- 15. West Water & Wastewater Valves Market in US Analysis, Insights and Forecast, 2019-2031
- 16. Competitive Analysis
- 16.1. Global Market Share Analysis 2024
- 16.2. Company Profiles
- 16.2.1 American Valve Inc
- 16.2.1.1. Overview
- 16.2.1.2. Products
- 16.2.1.3. SWOT Analysis
- 16.2.1.4. Recent Developments
- 16.2.1.5. Financials (Based on Availability)
- 16.2.2 Aegis Flow Technologies
- 16.2.2.1. Overview
- 16.2.2.2. Products
- 16.2.2.3. SWOT Analysis
- 16.2.2.4. Recent Developments
- 16.2.2.5. Financials (Based on Availability)
- 16.2.3 Ari Valve Corp
- 16.2.3.1. Overview
- 16.2.3.2. Products
- 16.2.3.3. SWOT Analysis
- 16.2.3.4. Recent Developments
- 16.2.3.5. Financials (Based on Availability)
- 16.2.4 Parker-Hannifin Corp
- 16.2.4.1. Overview
- 16.2.4.2. Products
- 16.2.4.3. SWOT Analysis
- 16.2.4.4. Recent Developments
- 16.2.4.5. Financials (Based on Availability)
- 16.2.5 Hayward Flow Control
- 16.2.5.1. Overview
- 16.2.5.2. Products
- 16.2.5.3. SWOT Analysis
- 16.2.5.4. Recent Developments
- 16.2.5.5. Financials (Based on Availability)
- 16.2.6 Flowserve Corporation
- 16.2.6.1. Overview
- 16.2.6.2. Products
- 16.2.6.3. SWOT Analysis
- 16.2.6.4. Recent Developments
- 16.2.6.5. Financials (Based on Availability)
- 16.2.7 Bi-Torq Valve Automation
- 16.2.7.1. Overview
- 16.2.7.2. Products
- 16.2.7.3. SWOT Analysis
- 16.2.7.4. Recent Developments
- 16.2.7.5. Financials (Based on Availability)
- 16.2.8 U S Valve LLC
- 16.2.8.1. Overview
- 16.2.8.2. Products
- 16.2.8.3. SWOT Analysis
- 16.2.8.4. Recent Developments
- 16.2.8.5. Financials (Based on Availability)
- 16.2.9 DeZURIK Inc
- 16.2.9.1. Overview
- 16.2.9.2. Products
- 16.2.9.3. SWOT Analysis
- 16.2.9.4. Recent Developments
- 16.2.9.5. Financials (Based on Availability)
- 16.2.10 Baker Hughes
- 16.2.10.1. Overview
- 16.2.10.2. Products
- 16.2.10.3. SWOT Analysis
- 16.2.10.4. Recent Developments
- 16.2.10.5. Financials (Based on Availability)
- 16.2.11 Bray International Inc
- 16.2.11.1. Overview
- 16.2.11.2. Products
- 16.2.11.3. SWOT Analysis
- 16.2.11.4. Recent Developments
- 16.2.11.5. Financials (Based on Availability)
- 16.2.12 Emerson Electric Co
- 16.2.12.1. Overview
- 16.2.12.2. Products
- 16.2.12.3. SWOT Analysis
- 16.2.12.4. Recent Developments
- 16.2.12.5. Financials (Based on Availability)
- 16.2.13 CIRCOR International Inc
- 16.2.13.1. Overview
- 16.2.13.2. Products
- 16.2.13.3. SWOT Analysis
- 16.2.13.4. Recent Developments
- 16.2.13.5. Financials (Based on Availability)
- 16.2.14 Crane Co (Crane Fluid Systems)
- 16.2.14.1. Overview
- 16.2.14.2. Products
- 16.2.14.3. SWOT Analysis
- 16.2.14.4. Recent Developments
- 16.2.14.5. Financials (Based on Availability)
- 16.2.15 Flomatic Corporation (Boshart Industries Inc )
- 16.2.15.1. Overview
- 16.2.15.2. Products
- 16.2.15.3. SWOT Analysis
- 16.2.15.4. Recent Developments
- 16.2.15.5. Financials (Based on Availability)
- 16.2.16 Cla-Val Company
- 16.2.16.1. Overview
- 16.2.16.2. Products
- 16.2.16.3. SWOT Analysis
- 16.2.16.4. Recent Developments
- 16.2.16.5. Financials (Based on Availability)
- 16.2.17 AMERICAN Cast Iron Pipe Company
- 16.2.17.1. Overview
- 16.2.17.2. Products
- 16.2.17.3. SWOT Analysis
- 16.2.17.4. Recent Developments
- 16.2.17.5. Financials (Based on Availability)
- 16.2.18 Asahi/America Inc (Asahi Yukizai Corporation)
- 16.2.18.1. Overview
- 16.2.18.2. Products
- 16.2.18.3. SWOT Analysis
- 16.2.18.4. Recent Developments
- 16.2.18.5. Financials (Based on Availability)
- 16.2.19 BELIMO Aircontrols (USA) Inc
- 16.2.19.1. Overview
- 16.2.19.2. Products
- 16.2.19.3. SWOT Analysis
- 16.2.19.4. Recent Developments
- 16.2.19.5. Financials (Based on Availability)
- 16.2.20 Watts Water Technologies Inc
- 16.2.20.1. Overview
- 16.2.20.2. Products
- 16.2.20.3. SWOT Analysis
- 16.2.20.4. Recent Developments
- 16.2.20.5. Financials (Based on Availability)
- 16.2.21 Schlumberger Limited*List Not Exhaustive
- 16.2.21.1. Overview
- 16.2.21.2. Products
- 16.2.21.3. SWOT Analysis
- 16.2.21.4. Recent Developments
- 16.2.21.5. Financials (Based on Availability)
- 16.2.1 American Valve Inc
List of Figures
- Figure 1: Global Water & Wastewater Valves Market in US Revenue Breakdown (Million, %) by Region 2024 & 2032
- Figure 2: United states Water & Wastewater Valves Market in US Revenue (Million), by Country 2024 & 2032
- Figure 3: United states Water & Wastewater Valves Market in US Revenue Share (%), by Country 2024 & 2032
- Figure 4: North America Water & Wastewater Valves Market in US Revenue (Million), by Type 2024 & 2032
- Figure 5: North America Water & Wastewater Valves Market in US Revenue Share (%), by Type 2024 & 2032
- Figure 6: North America Water & Wastewater Valves Market in US Revenue (Million), by Wastewater Application 2024 & 2032
- Figure 7: North America Water & Wastewater Valves Market in US Revenue Share (%), by Wastewater Application 2024 & 2032
- Figure 8: North America Water & Wastewater Valves Market in US Revenue (Million), by Country 2024 & 2032
- Figure 9: North America Water & Wastewater Valves Market in US Revenue Share (%), by Country 2024 & 2032
- Figure 10: South America Water & Wastewater Valves Market in US Revenue (Million), by Type 2024 & 2032
- Figure 11: South America Water & Wastewater Valves Market in US Revenue Share (%), by Type 2024 & 2032
- Figure 12: South America Water & Wastewater Valves Market in US Revenue (Million), by Wastewater Application 2024 & 2032
- Figure 13: South America Water & Wastewater Valves Market in US Revenue Share (%), by Wastewater Application 2024 & 2032
- Figure 14: South America Water & Wastewater Valves Market in US Revenue (Million), by Country 2024 & 2032
- Figure 15: South America Water & Wastewater Valves Market in US Revenue Share (%), by Country 2024 & 2032
- Figure 16: Europe Water & Wastewater Valves Market in US Revenue (Million), by Type 2024 & 2032
- Figure 17: Europe Water & Wastewater Valves Market in US Revenue Share (%), by Type 2024 & 2032
- Figure 18: Europe Water & Wastewater Valves Market in US Revenue (Million), by Wastewater Application 2024 & 2032
- Figure 19: Europe Water & Wastewater Valves Market in US Revenue Share (%), by Wastewater Application 2024 & 2032
- Figure 20: Europe Water & Wastewater Valves Market in US Revenue (Million), by Country 2024 & 2032
- Figure 21: Europe Water & Wastewater Valves Market in US Revenue Share (%), by Country 2024 & 2032
- Figure 22: Middle East & Africa Water & Wastewater Valves Market in US Revenue (Million), by Type 2024 & 2032
- Figure 23: Middle East & Africa Water & Wastewater Valves Market in US Revenue Share (%), by Type 2024 & 2032
- Figure 24: Middle East & Africa Water & Wastewater Valves Market in US Revenue (Million), by Wastewater Application 2024 & 2032
- Figure 25: Middle East & Africa Water & Wastewater Valves Market in US Revenue Share (%), by Wastewater Application 2024 & 2032
- Figure 26: Middle East & Africa Water & Wastewater Valves Market in US Revenue (Million), by Country 2024 & 2032
- Figure 27: Middle East & Africa Water & Wastewater Valves Market in US Revenue Share (%), by Country 2024 & 2032
- Figure 28: Asia Pacific Water & Wastewater Valves Market in US Revenue (Million), by Type 2024 & 2032
- Figure 29: Asia Pacific Water & Wastewater Valves Market in US Revenue Share (%), by Type 2024 & 2032
- Figure 30: Asia Pacific Water & Wastewater Valves Market in US Revenue (Million), by Wastewater Application 2024 & 2032
- Figure 31: Asia Pacific Water & Wastewater Valves Market in US Revenue Share (%), by Wastewater Application 2024 & 2032
- Figure 32: Asia Pacific Water & Wastewater Valves Market in US Revenue (Million), by Country 2024 & 2032
- Figure 33: Asia Pacific Water & Wastewater Valves Market in US Revenue Share (%), by Country 2024 & 2032
List of Tables
- Table 1: Global Water & Wastewater Valves Market in US Revenue Million Forecast, by Region 2019 & 2032
- Table 2: Global Water & Wastewater Valves Market in US Revenue Million Forecast, by Type 2019 & 2032
- Table 3: Global Water & Wastewater Valves Market in US Revenue Million Forecast, by Wastewater Application 2019 & 2032
- Table 4: Global Water & Wastewater Valves Market in US Revenue Million Forecast, by Region 2019 & 2032
- Table 5: Global Water & Wastewater Valves Market in US Revenue Million Forecast, by Country 2019 & 2032
- Table 6: Northeast Water & Wastewater Valves Market in US Revenue (Million) Forecast, by Application 2019 & 2032
- Table 7: Southeast Water & Wastewater Valves Market in US Revenue (Million) Forecast, by Application 2019 & 2032
- Table 8: Midwest Water & Wastewater Valves Market in US Revenue (Million) Forecast, by Application 2019 & 2032
- Table 9: Southwest Water & Wastewater Valves Market in US Revenue (Million) Forecast, by Application 2019 & 2032
- Table 10: West Water & Wastewater Valves Market in US Revenue (Million) Forecast, by Application 2019 & 2032
- Table 11: Global Water & Wastewater Valves Market in US Revenue Million Forecast, by Type 2019 & 2032
- Table 12: Global Water & Wastewater Valves Market in US Revenue Million Forecast, by Wastewater Application 2019 & 2032
- Table 13: Global Water & Wastewater Valves Market in US Revenue Million Forecast, by Country 2019 & 2032
- Table 14: United States Water & Wastewater Valves Market in US Revenue (Million) Forecast, by Application 2019 & 2032
- Table 15: Canada Water & Wastewater Valves Market in US Revenue (Million) Forecast, by Application 2019 & 2032
- Table 16: Mexico Water & Wastewater Valves Market in US Revenue (Million) Forecast, by Application 2019 & 2032
- Table 17: Global Water & Wastewater Valves Market in US Revenue Million Forecast, by Type 2019 & 2032
- Table 18: Global Water & Wastewater Valves Market in US Revenue Million Forecast, by Wastewater Application 2019 & 2032
- Table 19: Global Water & Wastewater Valves Market in US Revenue Million Forecast, by Country 2019 & 2032
- Table 20: Brazil Water & Wastewater Valves Market in US Revenue (Million) Forecast, by Application 2019 & 2032
- Table 21: Argentina Water & Wastewater Valves Market in US Revenue (Million) Forecast, by Application 2019 & 2032
- Table 22: Rest of South America Water & Wastewater Valves Market in US Revenue (Million) Forecast, by Application 2019 & 2032
- Table 23: Global Water & Wastewater Valves Market in US Revenue Million Forecast, by Type 2019 & 2032
- Table 24: Global Water & Wastewater Valves Market in US Revenue Million Forecast, by Wastewater Application 2019 & 2032
- Table 25: Global Water & Wastewater Valves Market in US Revenue Million Forecast, by Country 2019 & 2032
- Table 26: United Kingdom Water & Wastewater Valves Market in US Revenue (Million) Forecast, by Application 2019 & 2032
- Table 27: Germany Water & Wastewater Valves Market in US Revenue (Million) Forecast, by Application 2019 & 2032
- Table 28: France Water & Wastewater Valves Market in US Revenue (Million) Forecast, by Application 2019 & 2032
- Table 29: Italy Water & Wastewater Valves Market in US Revenue (Million) Forecast, by Application 2019 & 2032
- Table 30: Spain Water & Wastewater Valves Market in US Revenue (Million) Forecast, by Application 2019 & 2032
- Table 31: Russia Water & Wastewater Valves Market in US Revenue (Million) Forecast, by Application 2019 & 2032
- Table 32: Benelux Water & Wastewater Valves Market in US Revenue (Million) Forecast, by Application 2019 & 2032
- Table 33: Nordics Water & Wastewater Valves Market in US Revenue (Million) Forecast, by Application 2019 & 2032
- Table 34: Rest of Europe Water & Wastewater Valves Market in US Revenue (Million) Forecast, by Application 2019 & 2032
- Table 35: Global Water & Wastewater Valves Market in US Revenue Million Forecast, by Type 2019 & 2032
- Table 36: Global Water & Wastewater Valves Market in US Revenue Million Forecast, by Wastewater Application 2019 & 2032
- Table 37: Global Water & Wastewater Valves Market in US Revenue Million Forecast, by Country 2019 & 2032
- Table 38: Turkey Water & Wastewater Valves Market in US Revenue (Million) Forecast, by Application 2019 & 2032
- Table 39: Israel Water & Wastewater Valves Market in US Revenue (Million) Forecast, by Application 2019 & 2032
- Table 40: GCC Water & Wastewater Valves Market in US Revenue (Million) Forecast, by Application 2019 & 2032
- Table 41: North Africa Water & Wastewater Valves Market in US Revenue (Million) Forecast, by Application 2019 & 2032
- Table 42: South Africa Water & Wastewater Valves Market in US Revenue (Million) Forecast, by Application 2019 & 2032
- Table 43: Rest of Middle East & Africa Water & Wastewater Valves Market in US Revenue (Million) Forecast, by Application 2019 & 2032
- Table 44: Global Water & Wastewater Valves Market in US Revenue Million Forecast, by Type 2019 & 2032
- Table 45: Global Water & Wastewater Valves Market in US Revenue Million Forecast, by Wastewater Application 2019 & 2032
- Table 46: Global Water & Wastewater Valves Market in US Revenue Million Forecast, by Country 2019 & 2032
- Table 47: China Water & Wastewater Valves Market in US Revenue (Million) Forecast, by Application 2019 & 2032
- Table 48: India Water & Wastewater Valves Market in US Revenue (Million) Forecast, by Application 2019 & 2032
- Table 49: Japan Water & Wastewater Valves Market in US Revenue (Million) Forecast, by Application 2019 & 2032
- Table 50: South Korea Water & Wastewater Valves Market in US Revenue (Million) Forecast, by Application 2019 & 2032
- Table 51: ASEAN Water & Wastewater Valves Market in US Revenue (Million) Forecast, by Application 2019 & 2032
- Table 52: Oceania Water & Wastewater Valves Market in US Revenue (Million) Forecast, by Application 2019 & 2032
- Table 53: Rest of Asia Pacific Water & Wastewater Valves Market in US Revenue (Million) Forecast, by Application 2019 & 2032
Frequently Asked Questions
1. What is the projected Compound Annual Growth Rate (CAGR) of the Water & Wastewater Valves Market in US?
The projected CAGR is approximately 3.28%.
2. Which companies are prominent players in the Water & Wastewater Valves Market in US?
Key companies in the market include American Valve Inc, Aegis Flow Technologies, Ari Valve Corp, Parker-Hannifin Corp, Hayward Flow Control, Flowserve Corporation, Bi-Torq Valve Automation, U S Valve LLC, DeZURIK Inc, Baker Hughes, Bray International Inc, Emerson Electric Co, CIRCOR International Inc, Crane Co (Crane Fluid Systems), Flomatic Corporation (Boshart Industries Inc ), Cla-Val Company, AMERICAN Cast Iron Pipe Company, Asahi/America Inc (Asahi Yukizai Corporation), BELIMO Aircontrols (USA) Inc, Watts Water Technologies Inc, Schlumberger Limited*List Not Exhaustive.
3. What are the main segments of the Water & Wastewater Valves Market in US?
The market segments include Type, Wastewater Application.
4. Can you provide details about the market size?
The market size is estimated to be USD 1.67 Million as of 2022.
5. What are some drivers contributing to market growth?
The Need to Replace Aging Water and Wastewater Infrastructure Across the Nation and Supporting Government Loans.
6. What are the notable trends driving market growth?
The Need to Replace Aging Water and Wastewater Infrastructure Across the Nation and Supporting Government Loans.
7. Are there any restraints impacting market growth?
Operational Challenges and High Levels of Competition Leading to Price Pressures for Manufacturers.
8. Can you provide examples of recent developments in the market?
September 2022 - DEZURIK announced the release of Extended Flange Urethane Lined Knife Gate Valves. The KUL-EF Extended Flange is a direct dimensional replacement for long-body style slurry push-through valves, but it has the added advantage of not discharging any material while cycling.
9. What pricing options are available for accessing the report?
Pricing options include single-user, multi-user, and enterprise licenses priced at USD 3800, USD 4500, and USD 5800 respectively.
10. Is the market size provided in terms of value or volume?
The market size is provided in terms of value, measured in Million.
11. Are there any specific market keywords associated with the report?
Yes, the market keyword associated with the report is "Water & Wastewater Valves Market in US," which aids in identifying and referencing the specific market segment covered.
12. How do I determine which pricing option suits my needs best?
The pricing options vary based on user requirements and access needs. Individual users may opt for single-user licenses, while businesses requiring broader access may choose multi-user or enterprise licenses for cost-effective access to the report.
13. Are there any additional resources or data provided in the Water & Wastewater Valves Market in US report?
While the report offers comprehensive insights, it's advisable to review the specific contents or supplementary materials provided to ascertain if additional resources or data are available.
14. How can I stay updated on further developments or reports in the Water & Wastewater Valves Market in US?
To stay informed about further developments, trends, and reports in the Water & Wastewater Valves Market in US, consider subscribing to industry newsletters, following relevant companies and organizations, or regularly checking reputable industry news sources and publications.
Methodology
Step 1 - Identification of Relevant Samples Size from Population Database


Step 2 - Approaches for Defining Global Market Size (Value, Volume* & Price*)

Note*: In applicable scenarios
Step 3 - Data Sources
Primary Research
- Web Analytics
- Survey Reports
- Research Institute
- Latest Research Reports
- Opinion Leaders
Secondary Research
- Annual Reports
- White Paper
- Latest Press Release
- Industry Association
- Paid Database
- Investor Presentations

Step 4 - Data Triangulation
Involves using different sources of information in order to increase the validity of a study
These sources are likely to be stakeholders in a program - participants, other researchers, program staff, other community members, and so on.
Then we put all data in single framework & apply various statistical tools to find out the dynamic on the market.
During the analysis stage, feedback from the stakeholder groups would be compared to determine areas of agreement as well as areas of divergence


