
Key Insights
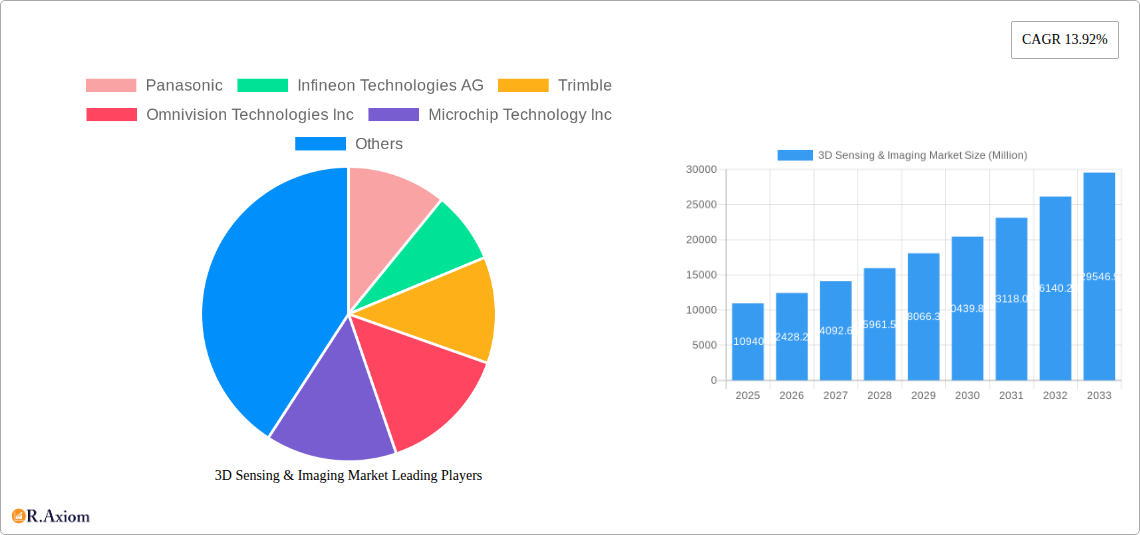
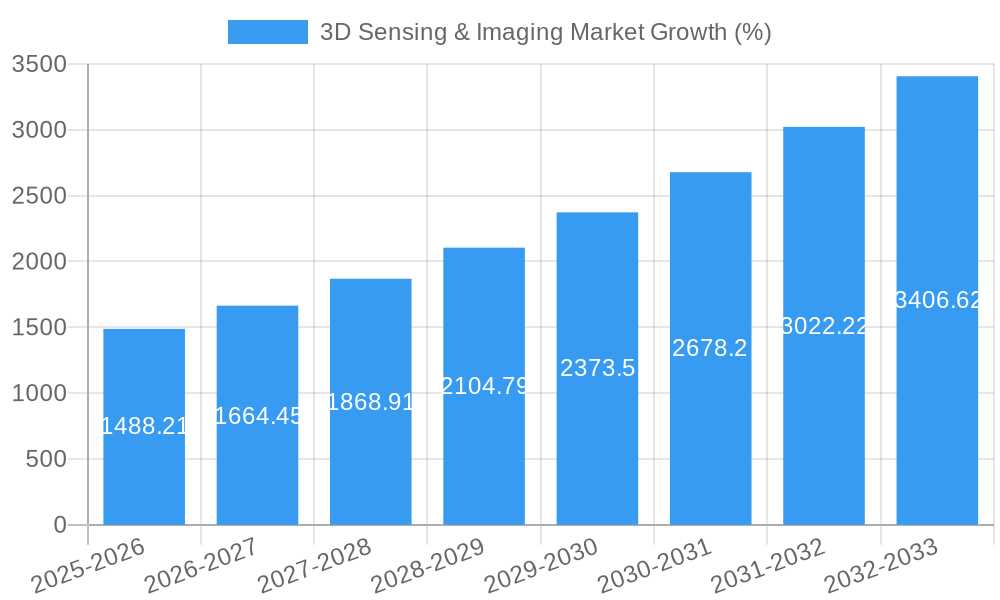
The 3D sensing and imaging market is experiencing robust growth, projected to reach a market size of $10.94 billion in 2025 and expanding at a Compound Annual Growth Rate (CAGR) of 13.92% from 2025 to 2033. This significant expansion is driven by increasing demand across diverse sectors. The consumer electronics industry, fueled by the proliferation of smartphones with advanced depth-sensing capabilities and augmented reality applications, is a major contributor. The automotive sector's adoption of advanced driver-assistance systems (ADAS) and autonomous driving technologies further propels market growth, requiring sophisticated 3D sensing for object recognition and navigation. The healthcare industry benefits from improved diagnostic imaging and minimally invasive surgical procedures enabled by 3D sensing technologies, while aerospace and defense leverage it for enhanced surveillance and navigation systems. Technological advancements, including improvements in time-of-flight, structured light, and ultrasound technologies, are continuously enhancing the accuracy, resolution, and affordability of 3D sensing solutions, further fueling market expansion. Hardware components constitute a larger segment of the market, reflecting the need for advanced sensors and processing units. Wireless connectivity is becoming increasingly prevalent, driven by the demand for portable and mobile 3D sensing applications.
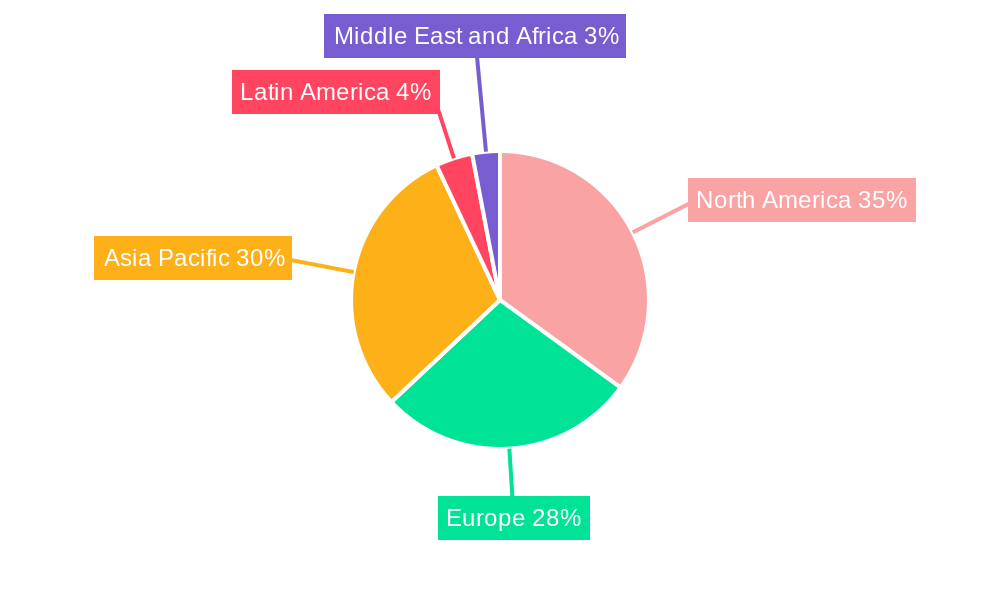
Market restraints include the high initial investment costs associated with implementing 3D sensing technologies, particularly in industries with stringent regulatory requirements. However, ongoing technological advancements and the decreasing cost of components are steadily mitigating this barrier. The market is segmented by end-user industry (consumer electronics, automotive, healthcare, etc.), component (hardware, software, services), technology (ultrasound, structured light, etc.), type (position, image, temperature sensors, etc.), and connectivity (wired, wireless). Key players like Panasonic, Infineon, Trimble, and others are actively contributing to innovation and market expansion through continuous research and development, strategic partnerships, and the introduction of cutting-edge 3D sensing solutions. The Asia-Pacific region, with its burgeoning electronics manufacturing and rapidly growing adoption of smart technologies, is anticipated to hold a significant market share, followed by North America and Europe.
3D Sensing & Imaging Market: A Comprehensive Report (2019-2033)
This detailed report provides a comprehensive analysis of the 3D Sensing & Imaging market, offering invaluable insights for stakeholders across the value chain. The study period covers 2019-2033, with 2025 as the base and estimated year, and a forecast period of 2025-2033. The report meticulously examines market dynamics, technological advancements, competitive landscapes, and future growth projections, providing actionable intelligence for informed decision-making.
3D Sensing & Imaging Market Market Concentration & Innovation
The 3D sensing and imaging market is characterized by a moderately concentrated landscape, with several key players holding significant market share. While a precise market share breakdown for each company requires extensive proprietary data analysis (values withheld here due to confidentiality), companies like Panasonic, Infineon Technologies AG, and STMicroelectronics are prominent, indicating a high level of competition. However, the market also presents opportunities for smaller, specialized firms focusing on niche technologies or applications.
Innovation is a crucial driver, fueled by advancements in Time-of-Flight (ToF), structured light, and stereoscopic vision technologies. The regulatory landscape varies across different regions, influencing market entry and product approvals, particularly in sectors like automotive and healthcare, where safety and regulatory compliance are paramount. Product substitution occurs through continuous technological improvements; for instance, ToF sensors are gradually replacing older technologies in certain applications. Mergers and acquisitions (M&A) activity has been moderately active, with deal values varying significantly depending on the target company's size and technology portfolio. Examples include xx Million in deals during 2022, mostly driven by consolidation within specific technology areas. End-user trends, such as the increasing demand for advanced driver-assistance systems (ADAS) in the automotive industry and the growing adoption of 3D imaging in consumer electronics, significantly impact market growth.
3D Sensing & Imaging Market Industry Trends & Insights
The 3D sensing and imaging market exhibits robust growth, driven by escalating demand across diverse sectors. The Compound Annual Growth Rate (CAGR) for the period 2025-2033 is projected to be xx%, fueled by several key factors. Technological disruptions, such as the miniaturization of sensors and the development of more sophisticated algorithms, are continuously improving the performance and affordability of 3D sensing solutions. Consumer preferences are shifting towards products integrating advanced features enabled by 3D sensing, particularly in mobile devices, gaming consoles, and augmented/virtual reality (AR/VR) applications. Market penetration is steadily increasing across various end-user industries, driven by rising adoption in areas like autonomous driving, medical imaging, and security surveillance. Competitive dynamics are shaped by intense R&D activities, strategic partnerships, and product differentiation strategies. The market is witnessing a shift towards integrated solutions, where hardware, software, and services are combined to offer comprehensive offerings to end-users.
Dominant Markets & Segments in 3D Sensing & Imaging Market
Dominant Regions/Segments:
Leading Region: North America currently holds a significant market share due to robust technological advancements, strong R&D investments, and high adoption rates across various end-user industries. Asia Pacific is experiencing rapid growth, driven by increasing consumer electronics production and industrial automation.
Dominant End-user Industry: The automotive sector is currently a major driver, fuelled by the demand for ADAS and autonomous driving features. The consumer electronics market is also experiencing substantial growth, propelled by the integration of 3D sensing in smartphones, tablets, and gaming devices.
Dominant Component: Hardware constitutes the largest market share, as it is the foundational element of 3D sensing systems. However, the software and services segments are experiencing faster growth due to the increasing complexity of 3D sensing applications.
Dominant Technology: Time-of-Flight (ToF) technology currently holds a significant market share, owing to its cost-effectiveness and ability to provide accurate depth information. Structured light technology also maintains a strong presence, particularly in applications requiring high accuracy and detail.
Dominant Type: Image sensors are the dominant type of sensor used in 3D sensing systems, due to their versatility and ability to capture rich depth data. Proximity sensors are also experiencing significant growth, particularly in the consumer electronics sector.
Dominant Connectivity: Wireless network connectivity is gaining traction due to its flexibility and ability to enable remote monitoring and control of 3D sensing systems. Wired network connectivity still holds a significant share in applications demanding high bandwidth and low latency.
Key Drivers for Dominance:
- Economic policies that promote technological innovation and investment in advanced technologies.
- Strong infrastructure to support the manufacturing and deployment of 3D sensing systems.
- Presence of major technology companies fostering competition and innovation.
3D Sensing & Imaging Market Product Developments
Recent years have witnessed significant advancements in 3D sensing technology, with a focus on improving accuracy, resolution, and power efficiency. New products are emerging with smaller form factors, enhanced functionalities, and improved integration capabilities. The market is experiencing a trend toward miniaturization and integration of multiple sensing modalities within a single device, leading to more compact and versatile solutions. These advancements cater to growing demands in diverse sectors, including smartphones, automotive, and healthcare. Competitive advantages are increasingly based on superior performance, cost-effectiveness, and unique features tailored to specific applications.
Report Scope & Segmentation Analysis
This report offers a granular segmentation of the 3D sensing and imaging market along various dimensions:
End-user Industry: Consumer Electronics (projected xx Million by 2033), Automotive (xx Million), Healthcare (xx Million), Aerospace & Defense (xx Million), Security & Surveillance (xx Million), Media and Entertainment (xx Million), Other End-user Industries (xx Million). Each segment presents unique growth dynamics and competitive landscapes.
Component: Hardware (xx Million), Software (xx Million), Services (xx Million) – growth varies based on technological developments and adoption rates.
Technology: Ultrasound, Structured Light, Time of Flight, Stereoscopic Vision, Other Technologies – market shares shift based on technological advancements and cost factors.
Type: Position Sensor, Image Sensor, Temperature Sensor, Accelerometer Sensor, Proximity Sensors, Others – each sensor type caters to specific applications with varying growth potential.
Connectivity: Wired Network Connectivity, Wireless Network Connectivity – market growth influenced by the expanding adoption of wireless technologies.
Key Drivers of 3D Sensing & Imaging Market Growth
The market's growth is propelled by several factors, including:
- Technological advancements: Miniaturization, improved accuracy, and lower costs are expanding the applications of 3D sensing.
- Increased demand in automotive: The push for autonomous vehicles and advanced driver-assistance systems drives high adoption rates.
- Consumer electronics integration: 3D sensing features are becoming increasingly popular in smartphones and other devices.
- Favorable regulatory environment: In some regions, supportive government policies are fostering innovation and investment.
Challenges in the 3D Sensing & Imaging Market Sector
Despite the positive growth outlook, the market faces challenges:
- High initial investment costs: Developing and deploying 3D sensing systems can require significant capital investment.
- Complex integration: Integrating 3D sensors into existing systems can be complex and require specialized expertise.
- Data security and privacy concerns: The increasing use of 3D sensing raises concerns about data security and privacy, requiring robust solutions.
- Supply chain disruptions: The global supply chain can experience interruptions, impacting the availability of essential components.
Emerging Opportunities in 3D Sensing & Imaging Market
Significant opportunities exist in:
- Expanding applications: 3D sensing is finding new applications in robotics, healthcare, and industrial automation.
- New technologies: Advancements in AI and machine learning are enhancing the capabilities of 3D sensing systems.
- Emerging markets: Developing economies are showing increasing interest in 3D sensing technologies, creating new market opportunities.
Leading Players in the 3D Sensing & Imaging Market Market
- Panasonic
- Infineon Technologies AG
- Trimble
- Omnivision Technologies Inc
- Microchip Technology Inc
- GE Healthcare
- Lockheed Martin
- Adobe
- STMicroelectronics
- Sick AG
- Faro
- Texas Instruments Incorporated
- Autodesk
- Keyence
- Dassault Systèmes
- Qualcomm Inc
Key Developments in 3D Sensing & Imaging Market Industry
- December 2021: LIPS Corporation launched new LIPSedge 3D structured light cameras, targeting smart factories and healthcare.
- January 2022: Pmdtechnologies AG unveiled the flexx2 3D time-of-flight development kit, enhancing depth-sensing performance.
- March 2022: LIPS Corporation and Newsight Imaging partnered to develop eTOF-based 3D vision systems for Industry 4.0.
Strategic Outlook for 3D Sensing & Imaging Market Market
The 3D sensing and imaging market is poised for continued expansion, driven by technological advancements, increasing demand from diverse sectors, and favorable regulatory environments. Opportunities abound in emerging applications, particularly in areas such as autonomous vehicles, robotics, and healthcare. Companies that can successfully navigate technological challenges and adapt to evolving market needs are well-positioned for significant growth. The market is predicted to witness significant expansion, especially in regions with rapid technological advancements and supportive government policies.
3D Sensing & Imaging Market Segmentation
-
1. Component
- 1.1. Hardware
- 1.2. Software
- 1.3. Services
-
2. Technology
- 2.1. Ultrasound
- 2.2. Structured Light
- 2.3. Time of Flight
- 2.4. Stereoscopic Vision
- 2.5. Other Technologies
-
3. Type
- 3.1. Position Sensor
- 3.2. Image Sensor
- 3.3. Temperature Sensor
- 3.4. Accelerometer Sensor
- 3.5. Proximity Sensor
- 3.6. Other Types
-
4. Connectivity
- 4.1. Wired Network Connectivity
- 4.2. Wireless Network Connectivity
-
5. End-user Industry
- 5.1. Consumer Electronics
- 5.2. Automotive
- 5.3. Healthcare
- 5.4. Aerospace and Defense
- 5.5. Security and Surveillance
- 5.6. Media and Entertainment
- 5.7. Other End-user Industries
3D Sensing & Imaging Market Segmentation By Geography
- 1. North America
- 2. Europe
- 3. Asia Pacific
- 4. Middle East and Africa
- 5. Latin America
3D Sensing & Imaging Market REPORT HIGHLIGHTS
| Aspects | Details |
|---|---|
| Study Period | 2019-2033 |
| Base Year | 2024 |
| Estimated Year | 2025 |
| Forecast Period | 2025-2033 |
| Historical Period | 2019-2024 |
| Growth Rate | CAGR of 13.92% from 2019-2033 |
| Segmentation |
|
Table of Contents
- 1. Introduction
- 1.1. Research Scope
- 1.2. Market Segmentation
- 1.3. Research Methodology
- 1.4. Definitions and Assumptions
- 2. Executive Summary
- 2.1. Introduction
- 3. Market Dynamics
- 3.1. Introduction
- 3.2. Market Drivers
- 3.2.1. Integration of Optical and Electronic Components in Miniaturized Electronics Devices; Rising Demand for 3D-Enabled Devices in Consumer Electronics; Growing Penetration of Image Sensors in Automobiles; Growing Requirement of Security and Surveillance Systems
- 3.3. Market Restrains
- 3.3.1. High Manufacturing Cost of Image Sensors; Limited Integration With Other Devices; High Cost Required for the Maintenance of these Devices
- 3.4. Market Trends
- 3.4.1. Automotive Sector Expected to Drive Market Growth
- 4. Market Factor Analysis
- 4.1. Porters Five Forces
- 4.2. Supply/Value Chain
- 4.3. PESTEL analysis
- 4.4. Market Entropy
- 4.5. Patent/Trademark Analysis
- 5. Global 3D Sensing & Imaging Market Analysis, Insights and Forecast, 2019-2031
- 5.1. Market Analysis, Insights and Forecast - by Component
- 5.1.1. Hardware
- 5.1.2. Software
- 5.1.3. Services
- 5.2. Market Analysis, Insights and Forecast - by Technology
- 5.2.1. Ultrasound
- 5.2.2. Structured Light
- 5.2.3. Time of Flight
- 5.2.4. Stereoscopic Vision
- 5.2.5. Other Technologies
- 5.3. Market Analysis, Insights and Forecast - by Type
- 5.3.1. Position Sensor
- 5.3.2. Image Sensor
- 5.3.3. Temperature Sensor
- 5.3.4. Accelerometer Sensor
- 5.3.5. Proximity Sensor
- 5.3.6. Other Types
- 5.4. Market Analysis, Insights and Forecast - by Connectivity
- 5.4.1. Wired Network Connectivity
- 5.4.2. Wireless Network Connectivity
- 5.5. Market Analysis, Insights and Forecast - by End-user Industry
- 5.5.1. Consumer Electronics
- 5.5.2. Automotive
- 5.5.3. Healthcare
- 5.5.4. Aerospace and Defense
- 5.5.5. Security and Surveillance
- 5.5.6. Media and Entertainment
- 5.5.7. Other End-user Industries
- 5.6. Market Analysis, Insights and Forecast - by Region
- 5.6.1. North America
- 5.6.2. Europe
- 5.6.3. Asia Pacific
- 5.6.4. Middle East and Africa
- 5.6.5. Latin America
- 5.1. Market Analysis, Insights and Forecast - by Component
- 6. North America 3D Sensing & Imaging Market Analysis, Insights and Forecast, 2019-2031
- 6.1. Market Analysis, Insights and Forecast - by Component
- 6.1.1. Hardware
- 6.1.2. Software
- 6.1.3. Services
- 6.2. Market Analysis, Insights and Forecast - by Technology
- 6.2.1. Ultrasound
- 6.2.2. Structured Light
- 6.2.3. Time of Flight
- 6.2.4. Stereoscopic Vision
- 6.2.5. Other Technologies
- 6.3. Market Analysis, Insights and Forecast - by Type
- 6.3.1. Position Sensor
- 6.3.2. Image Sensor
- 6.3.3. Temperature Sensor
- 6.3.4. Accelerometer Sensor
- 6.3.5. Proximity Sensor
- 6.3.6. Other Types
- 6.4. Market Analysis, Insights and Forecast - by Connectivity
- 6.4.1. Wired Network Connectivity
- 6.4.2. Wireless Network Connectivity
- 6.5. Market Analysis, Insights and Forecast - by End-user Industry
- 6.5.1. Consumer Electronics
- 6.5.2. Automotive
- 6.5.3. Healthcare
- 6.5.4. Aerospace and Defense
- 6.5.5. Security and Surveillance
- 6.5.6. Media and Entertainment
- 6.5.7. Other End-user Industries
- 6.1. Market Analysis, Insights and Forecast - by Component
- 7. Europe 3D Sensing & Imaging Market Analysis, Insights and Forecast, 2019-2031
- 7.1. Market Analysis, Insights and Forecast - by Component
- 7.1.1. Hardware
- 7.1.2. Software
- 7.1.3. Services
- 7.2. Market Analysis, Insights and Forecast - by Technology
- 7.2.1. Ultrasound
- 7.2.2. Structured Light
- 7.2.3. Time of Flight
- 7.2.4. Stereoscopic Vision
- 7.2.5. Other Technologies
- 7.3. Market Analysis, Insights and Forecast - by Type
- 7.3.1. Position Sensor
- 7.3.2. Image Sensor
- 7.3.3. Temperature Sensor
- 7.3.4. Accelerometer Sensor
- 7.3.5. Proximity Sensor
- 7.3.6. Other Types
- 7.4. Market Analysis, Insights and Forecast - by Connectivity
- 7.4.1. Wired Network Connectivity
- 7.4.2. Wireless Network Connectivity
- 7.5. Market Analysis, Insights and Forecast - by End-user Industry
- 7.5.1. Consumer Electronics
- 7.5.2. Automotive
- 7.5.3. Healthcare
- 7.5.4. Aerospace and Defense
- 7.5.5. Security and Surveillance
- 7.5.6. Media and Entertainment
- 7.5.7. Other End-user Industries
- 7.1. Market Analysis, Insights and Forecast - by Component
- 8. Asia Pacific 3D Sensing & Imaging Market Analysis, Insights and Forecast, 2019-2031
- 8.1. Market Analysis, Insights and Forecast - by Component
- 8.1.1. Hardware
- 8.1.2. Software
- 8.1.3. Services
- 8.2. Market Analysis, Insights and Forecast - by Technology
- 8.2.1. Ultrasound
- 8.2.2. Structured Light
- 8.2.3. Time of Flight
- 8.2.4. Stereoscopic Vision
- 8.2.5. Other Technologies
- 8.3. Market Analysis, Insights and Forecast - by Type
- 8.3.1. Position Sensor
- 8.3.2. Image Sensor
- 8.3.3. Temperature Sensor
- 8.3.4. Accelerometer Sensor
- 8.3.5. Proximity Sensor
- 8.3.6. Other Types
- 8.4. Market Analysis, Insights and Forecast - by Connectivity
- 8.4.1. Wired Network Connectivity
- 8.4.2. Wireless Network Connectivity
- 8.5. Market Analysis, Insights and Forecast - by End-user Industry
- 8.5.1. Consumer Electronics
- 8.5.2. Automotive
- 8.5.3. Healthcare
- 8.5.4. Aerospace and Defense
- 8.5.5. Security and Surveillance
- 8.5.6. Media and Entertainment
- 8.5.7. Other End-user Industries
- 8.1. Market Analysis, Insights and Forecast - by Component
- 9. Middle East and Africa 3D Sensing & Imaging Market Analysis, Insights and Forecast, 2019-2031
- 9.1. Market Analysis, Insights and Forecast - by Component
- 9.1.1. Hardware
- 9.1.2. Software
- 9.1.3. Services
- 9.2. Market Analysis, Insights and Forecast - by Technology
- 9.2.1. Ultrasound
- 9.2.2. Structured Light
- 9.2.3. Time of Flight
- 9.2.4. Stereoscopic Vision
- 9.2.5. Other Technologies
- 9.3. Market Analysis, Insights and Forecast - by Type
- 9.3.1. Position Sensor
- 9.3.2. Image Sensor
- 9.3.3. Temperature Sensor
- 9.3.4. Accelerometer Sensor
- 9.3.5. Proximity Sensor
- 9.3.6. Other Types
- 9.4. Market Analysis, Insights and Forecast - by Connectivity
- 9.4.1. Wired Network Connectivity
- 9.4.2. Wireless Network Connectivity
- 9.5. Market Analysis, Insights and Forecast - by End-user Industry
- 9.5.1. Consumer Electronics
- 9.5.2. Automotive
- 9.5.3. Healthcare
- 9.5.4. Aerospace and Defense
- 9.5.5. Security and Surveillance
- 9.5.6. Media and Entertainment
- 9.5.7. Other End-user Industries
- 9.1. Market Analysis, Insights and Forecast - by Component
- 10. Latin America 3D Sensing & Imaging Market Analysis, Insights and Forecast, 2019-2031
- 10.1. Market Analysis, Insights and Forecast - by Component
- 10.1.1. Hardware
- 10.1.2. Software
- 10.1.3. Services
- 10.2. Market Analysis, Insights and Forecast - by Technology
- 10.2.1. Ultrasound
- 10.2.2. Structured Light
- 10.2.3. Time of Flight
- 10.2.4. Stereoscopic Vision
- 10.2.5. Other Technologies
- 10.3. Market Analysis, Insights and Forecast - by Type
- 10.3.1. Position Sensor
- 10.3.2. Image Sensor
- 10.3.3. Temperature Sensor
- 10.3.4. Accelerometer Sensor
- 10.3.5. Proximity Sensor
- 10.3.6. Other Types
- 10.4. Market Analysis, Insights and Forecast - by Connectivity
- 10.4.1. Wired Network Connectivity
- 10.4.2. Wireless Network Connectivity
- 10.5. Market Analysis, Insights and Forecast - by End-user Industry
- 10.5.1. Consumer Electronics
- 10.5.2. Automotive
- 10.5.3. Healthcare
- 10.5.4. Aerospace and Defense
- 10.5.5. Security and Surveillance
- 10.5.6. Media and Entertainment
- 10.5.7. Other End-user Industries
- 10.1. Market Analysis, Insights and Forecast - by Component
- 11. North America 3D Sensing & Imaging Market Analysis, Insights and Forecast, 2019-2031
- 11.1. Market Analysis, Insights and Forecast - By Country/Sub-region
- 11.1.1.
- 12. Europe 3D Sensing & Imaging Market Analysis, Insights and Forecast, 2019-2031
- 12.1. Market Analysis, Insights and Forecast - By Country/Sub-region
- 12.1.1.
- 13. Asia Pacific 3D Sensing & Imaging Market Analysis, Insights and Forecast, 2019-2031
- 13.1. Market Analysis, Insights and Forecast - By Country/Sub-region
- 13.1.1.
- 14. Latin America 3D Sensing & Imaging Market Analysis, Insights and Forecast, 2019-2031
- 14.1. Market Analysis, Insights and Forecast - By Country/Sub-region
- 14.1.1.
- 15. Middle East and Africa 3D Sensing & Imaging Market Analysis, Insights and Forecast, 2019-2031
- 15.1. Market Analysis, Insights and Forecast - By Country/Sub-region
- 15.1.1.
- 16. Competitive Analysis
- 16.1. Global Market Share Analysis 2024
- 16.2. Company Profiles
- 16.2.1 Panasonic
- 16.2.1.1. Overview
- 16.2.1.2. Products
- 16.2.1.3. SWOT Analysis
- 16.2.1.4. Recent Developments
- 16.2.1.5. Financials (Based on Availability)
- 16.2.2 Infineon Technologies AG
- 16.2.2.1. Overview
- 16.2.2.2. Products
- 16.2.2.3. SWOT Analysis
- 16.2.2.4. Recent Developments
- 16.2.2.5. Financials (Based on Availability)
- 16.2.3 Trimble
- 16.2.3.1. Overview
- 16.2.3.2. Products
- 16.2.3.3. SWOT Analysis
- 16.2.3.4. Recent Developments
- 16.2.3.5. Financials (Based on Availability)
- 16.2.4 Omnivision Technologies Inc
- 16.2.4.1. Overview
- 16.2.4.2. Products
- 16.2.4.3. SWOT Analysis
- 16.2.4.4. Recent Developments
- 16.2.4.5. Financials (Based on Availability)
- 16.2.5 Microchip Technology Inc
- 16.2.5.1. Overview
- 16.2.5.2. Products
- 16.2.5.3. SWOT Analysis
- 16.2.5.4. Recent Developments
- 16.2.5.5. Financials (Based on Availability)
- 16.2.6 GE Healthcare
- 16.2.6.1. Overview
- 16.2.6.2. Products
- 16.2.6.3. SWOT Analysis
- 16.2.6.4. Recent Developments
- 16.2.6.5. Financials (Based on Availability)
- 16.2.7 Lockheed Martin
- 16.2.7.1. Overview
- 16.2.7.2. Products
- 16.2.7.3. SWOT Analysis
- 16.2.7.4. Recent Developments
- 16.2.7.5. Financials (Based on Availability)
- 16.2.8 Adobe
- 16.2.8.1. Overview
- 16.2.8.2. Products
- 16.2.8.3. SWOT Analysis
- 16.2.8.4. Recent Developments
- 16.2.8.5. Financials (Based on Availability)
- 16.2.9 STMicroelectronics
- 16.2.9.1. Overview
- 16.2.9.2. Products
- 16.2.9.3. SWOT Analysis
- 16.2.9.4. Recent Developments
- 16.2.9.5. Financials (Based on Availability)
- 16.2.10 Google
- 16.2.10.1. Overview
- 16.2.10.2. Products
- 16.2.10.3. SWOT Analysis
- 16.2.10.4. Recent Developments
- 16.2.10.5. Financials (Based on Availability)
- 16.2.11 Sick AG
- 16.2.11.1. Overview
- 16.2.11.2. Products
- 16.2.11.3. SWOT Analysis
- 16.2.11.4. Recent Developments
- 16.2.11.5. Financials (Based on Availability)
- 16.2.12 Faro
- 16.2.12.1. Overview
- 16.2.12.2. Products
- 16.2.12.3. SWOT Analysis
- 16.2.12.4. Recent Developments
- 16.2.12.5. Financials (Based on Availability)
- 16.2.13 Texas Instruments Incorporated
- 16.2.13.1. Overview
- 16.2.13.2. Products
- 16.2.13.3. SWOT Analysis
- 16.2.13.4. Recent Developments
- 16.2.13.5. Financials (Based on Availability)
- 16.2.14 Autodesk
- 16.2.14.1. Overview
- 16.2.14.2. Products
- 16.2.14.3. SWOT Analysis
- 16.2.14.4. Recent Developments
- 16.2.14.5. Financials (Based on Availability)
- 16.2.15 Keyence
- 16.2.15.1. Overview
- 16.2.15.2. Products
- 16.2.15.3. SWOT Analysis
- 16.2.15.4. Recent Developments
- 16.2.15.5. Financials (Based on Availability)
- 16.2.16 Dassault Systems*List Not Exhaustive
- 16.2.16.1. Overview
- 16.2.16.2. Products
- 16.2.16.3. SWOT Analysis
- 16.2.16.4. Recent Developments
- 16.2.16.5. Financials (Based on Availability)
- 16.2.17 Qualcomm Inc
- 16.2.17.1. Overview
- 16.2.17.2. Products
- 16.2.17.3. SWOT Analysis
- 16.2.17.4. Recent Developments
- 16.2.17.5. Financials (Based on Availability)
- 16.2.1 Panasonic
List of Figures
- Figure 1: Global 3D Sensing & Imaging Market Revenue Breakdown (Million, %) by Region 2024 & 2032
- Figure 2: North America 3D Sensing & Imaging Market Revenue (Million), by Country 2024 & 2032
- Figure 3: North America 3D Sensing & Imaging Market Revenue Share (%), by Country 2024 & 2032
- Figure 4: Europe 3D Sensing & Imaging Market Revenue (Million), by Country 2024 & 2032
- Figure 5: Europe 3D Sensing & Imaging Market Revenue Share (%), by Country 2024 & 2032
- Figure 6: Asia Pacific 3D Sensing & Imaging Market Revenue (Million), by Country 2024 & 2032
- Figure 7: Asia Pacific 3D Sensing & Imaging Market Revenue Share (%), by Country 2024 & 2032
- Figure 8: Latin America 3D Sensing & Imaging Market Revenue (Million), by Country 2024 & 2032
- Figure 9: Latin America 3D Sensing & Imaging Market Revenue Share (%), by Country 2024 & 2032
- Figure 10: Middle East and Africa 3D Sensing & Imaging Market Revenue (Million), by Country 2024 & 2032
- Figure 11: Middle East and Africa 3D Sensing & Imaging Market Revenue Share (%), by Country 2024 & 2032
- Figure 12: North America 3D Sensing & Imaging Market Revenue (Million), by Component 2024 & 2032
- Figure 13: North America 3D Sensing & Imaging Market Revenue Share (%), by Component 2024 & 2032
- Figure 14: North America 3D Sensing & Imaging Market Revenue (Million), by Technology 2024 & 2032
- Figure 15: North America 3D Sensing & Imaging Market Revenue Share (%), by Technology 2024 & 2032
- Figure 16: North America 3D Sensing & Imaging Market Revenue (Million), by Type 2024 & 2032
- Figure 17: North America 3D Sensing & Imaging Market Revenue Share (%), by Type 2024 & 2032
- Figure 18: North America 3D Sensing & Imaging Market Revenue (Million), by Connectivity 2024 & 2032
- Figure 19: North America 3D Sensing & Imaging Market Revenue Share (%), by Connectivity 2024 & 2032
- Figure 20: North America 3D Sensing & Imaging Market Revenue (Million), by End-user Industry 2024 & 2032
- Figure 21: North America 3D Sensing & Imaging Market Revenue Share (%), by End-user Industry 2024 & 2032
- Figure 22: North America 3D Sensing & Imaging Market Revenue (Million), by Country 2024 & 2032
- Figure 23: North America 3D Sensing & Imaging Market Revenue Share (%), by Country 2024 & 2032
- Figure 24: Europe 3D Sensing & Imaging Market Revenue (Million), by Component 2024 & 2032
- Figure 25: Europe 3D Sensing & Imaging Market Revenue Share (%), by Component 2024 & 2032
- Figure 26: Europe 3D Sensing & Imaging Market Revenue (Million), by Technology 2024 & 2032
- Figure 27: Europe 3D Sensing & Imaging Market Revenue Share (%), by Technology 2024 & 2032
- Figure 28: Europe 3D Sensing & Imaging Market Revenue (Million), by Type 2024 & 2032
- Figure 29: Europe 3D Sensing & Imaging Market Revenue Share (%), by Type 2024 & 2032
- Figure 30: Europe 3D Sensing & Imaging Market Revenue (Million), by Connectivity 2024 & 2032
- Figure 31: Europe 3D Sensing & Imaging Market Revenue Share (%), by Connectivity 2024 & 2032
- Figure 32: Europe 3D Sensing & Imaging Market Revenue (Million), by End-user Industry 2024 & 2032
- Figure 33: Europe 3D Sensing & Imaging Market Revenue Share (%), by End-user Industry 2024 & 2032
- Figure 34: Europe 3D Sensing & Imaging Market Revenue (Million), by Country 2024 & 2032
- Figure 35: Europe 3D Sensing & Imaging Market Revenue Share (%), by Country 2024 & 2032
- Figure 36: Asia Pacific 3D Sensing & Imaging Market Revenue (Million), by Component 2024 & 2032
- Figure 37: Asia Pacific 3D Sensing & Imaging Market Revenue Share (%), by Component 2024 & 2032
- Figure 38: Asia Pacific 3D Sensing & Imaging Market Revenue (Million), by Technology 2024 & 2032
- Figure 39: Asia Pacific 3D Sensing & Imaging Market Revenue Share (%), by Technology 2024 & 2032
- Figure 40: Asia Pacific 3D Sensing & Imaging Market Revenue (Million), by Type 2024 & 2032
- Figure 41: Asia Pacific 3D Sensing & Imaging Market Revenue Share (%), by Type 2024 & 2032
- Figure 42: Asia Pacific 3D Sensing & Imaging Market Revenue (Million), by Connectivity 2024 & 2032
- Figure 43: Asia Pacific 3D Sensing & Imaging Market Revenue Share (%), by Connectivity 2024 & 2032
- Figure 44: Asia Pacific 3D Sensing & Imaging Market Revenue (Million), by End-user Industry 2024 & 2032
- Figure 45: Asia Pacific 3D Sensing & Imaging Market Revenue Share (%), by End-user Industry 2024 & 2032
- Figure 46: Asia Pacific 3D Sensing & Imaging Market Revenue (Million), by Country 2024 & 2032
- Figure 47: Asia Pacific 3D Sensing & Imaging Market Revenue Share (%), by Country 2024 & 2032
- Figure 48: Middle East and Africa 3D Sensing & Imaging Market Revenue (Million), by Component 2024 & 2032
- Figure 49: Middle East and Africa 3D Sensing & Imaging Market Revenue Share (%), by Component 2024 & 2032
- Figure 50: Middle East and Africa 3D Sensing & Imaging Market Revenue (Million), by Technology 2024 & 2032
- Figure 51: Middle East and Africa 3D Sensing & Imaging Market Revenue Share (%), by Technology 2024 & 2032
- Figure 52: Middle East and Africa 3D Sensing & Imaging Market Revenue (Million), by Type 2024 & 2032
- Figure 53: Middle East and Africa 3D Sensing & Imaging Market Revenue Share (%), by Type 2024 & 2032
- Figure 54: Middle East and Africa 3D Sensing & Imaging Market Revenue (Million), by Connectivity 2024 & 2032
- Figure 55: Middle East and Africa 3D Sensing & Imaging Market Revenue Share (%), by Connectivity 2024 & 2032
- Figure 56: Middle East and Africa 3D Sensing & Imaging Market Revenue (Million), by End-user Industry 2024 & 2032
- Figure 57: Middle East and Africa 3D Sensing & Imaging Market Revenue Share (%), by End-user Industry 2024 & 2032
- Figure 58: Middle East and Africa 3D Sensing & Imaging Market Revenue (Million), by Country 2024 & 2032
- Figure 59: Middle East and Africa 3D Sensing & Imaging Market Revenue Share (%), by Country 2024 & 2032
- Figure 60: Latin America 3D Sensing & Imaging Market Revenue (Million), by Component 2024 & 2032
- Figure 61: Latin America 3D Sensing & Imaging Market Revenue Share (%), by Component 2024 & 2032
- Figure 62: Latin America 3D Sensing & Imaging Market Revenue (Million), by Technology 2024 & 2032
- Figure 63: Latin America 3D Sensing & Imaging Market Revenue Share (%), by Technology 2024 & 2032
- Figure 64: Latin America 3D Sensing & Imaging Market Revenue (Million), by Type 2024 & 2032
- Figure 65: Latin America 3D Sensing & Imaging Market Revenue Share (%), by Type 2024 & 2032
- Figure 66: Latin America 3D Sensing & Imaging Market Revenue (Million), by Connectivity 2024 & 2032
- Figure 67: Latin America 3D Sensing & Imaging Market Revenue Share (%), by Connectivity 2024 & 2032
- Figure 68: Latin America 3D Sensing & Imaging Market Revenue (Million), by End-user Industry 2024 & 2032
- Figure 69: Latin America 3D Sensing & Imaging Market Revenue Share (%), by End-user Industry 2024 & 2032
- Figure 70: Latin America 3D Sensing & Imaging Market Revenue (Million), by Country 2024 & 2032
- Figure 71: Latin America 3D Sensing & Imaging Market Revenue Share (%), by Country 2024 & 2032
List of Tables
- Table 1: Global 3D Sensing & Imaging Market Revenue Million Forecast, by Region 2019 & 2032
- Table 2: Global 3D Sensing & Imaging Market Revenue Million Forecast, by Component 2019 & 2032
- Table 3: Global 3D Sensing & Imaging Market Revenue Million Forecast, by Technology 2019 & 2032
- Table 4: Global 3D Sensing & Imaging Market Revenue Million Forecast, by Type 2019 & 2032
- Table 5: Global 3D Sensing & Imaging Market Revenue Million Forecast, by Connectivity 2019 & 2032
- Table 6: Global 3D Sensing & Imaging Market Revenue Million Forecast, by End-user Industry 2019 & 2032
- Table 7: Global 3D Sensing & Imaging Market Revenue Million Forecast, by Region 2019 & 2032
- Table 8: Global 3D Sensing & Imaging Market Revenue Million Forecast, by Country 2019 & 2032
- Table 9: 3D Sensing & Imaging Market Revenue (Million) Forecast, by Application 2019 & 2032
- Table 10: Global 3D Sensing & Imaging Market Revenue Million Forecast, by Country 2019 & 2032
- Table 11: 3D Sensing & Imaging Market Revenue (Million) Forecast, by Application 2019 & 2032
- Table 12: Global 3D Sensing & Imaging Market Revenue Million Forecast, by Country 2019 & 2032
- Table 13: 3D Sensing & Imaging Market Revenue (Million) Forecast, by Application 2019 & 2032
- Table 14: Global 3D Sensing & Imaging Market Revenue Million Forecast, by Country 2019 & 2032
- Table 15: 3D Sensing & Imaging Market Revenue (Million) Forecast, by Application 2019 & 2032
- Table 16: Global 3D Sensing & Imaging Market Revenue Million Forecast, by Country 2019 & 2032
- Table 17: 3D Sensing & Imaging Market Revenue (Million) Forecast, by Application 2019 & 2032
- Table 18: Global 3D Sensing & Imaging Market Revenue Million Forecast, by Component 2019 & 2032
- Table 19: Global 3D Sensing & Imaging Market Revenue Million Forecast, by Technology 2019 & 2032
- Table 20: Global 3D Sensing & Imaging Market Revenue Million Forecast, by Type 2019 & 2032
- Table 21: Global 3D Sensing & Imaging Market Revenue Million Forecast, by Connectivity 2019 & 2032
- Table 22: Global 3D Sensing & Imaging Market Revenue Million Forecast, by End-user Industry 2019 & 2032
- Table 23: Global 3D Sensing & Imaging Market Revenue Million Forecast, by Country 2019 & 2032
- Table 24: Global 3D Sensing & Imaging Market Revenue Million Forecast, by Component 2019 & 2032
- Table 25: Global 3D Sensing & Imaging Market Revenue Million Forecast, by Technology 2019 & 2032
- Table 26: Global 3D Sensing & Imaging Market Revenue Million Forecast, by Type 2019 & 2032
- Table 27: Global 3D Sensing & Imaging Market Revenue Million Forecast, by Connectivity 2019 & 2032
- Table 28: Global 3D Sensing & Imaging Market Revenue Million Forecast, by End-user Industry 2019 & 2032
- Table 29: Global 3D Sensing & Imaging Market Revenue Million Forecast, by Country 2019 & 2032
- Table 30: Global 3D Sensing & Imaging Market Revenue Million Forecast, by Component 2019 & 2032
- Table 31: Global 3D Sensing & Imaging Market Revenue Million Forecast, by Technology 2019 & 2032
- Table 32: Global 3D Sensing & Imaging Market Revenue Million Forecast, by Type 2019 & 2032
- Table 33: Global 3D Sensing & Imaging Market Revenue Million Forecast, by Connectivity 2019 & 2032
- Table 34: Global 3D Sensing & Imaging Market Revenue Million Forecast, by End-user Industry 2019 & 2032
- Table 35: Global 3D Sensing & Imaging Market Revenue Million Forecast, by Country 2019 & 2032
- Table 36: Global 3D Sensing & Imaging Market Revenue Million Forecast, by Component 2019 & 2032
- Table 37: Global 3D Sensing & Imaging Market Revenue Million Forecast, by Technology 2019 & 2032
- Table 38: Global 3D Sensing & Imaging Market Revenue Million Forecast, by Type 2019 & 2032
- Table 39: Global 3D Sensing & Imaging Market Revenue Million Forecast, by Connectivity 2019 & 2032
- Table 40: Global 3D Sensing & Imaging Market Revenue Million Forecast, by End-user Industry 2019 & 2032
- Table 41: Global 3D Sensing & Imaging Market Revenue Million Forecast, by Country 2019 & 2032
- Table 42: Global 3D Sensing & Imaging Market Revenue Million Forecast, by Component 2019 & 2032
- Table 43: Global 3D Sensing & Imaging Market Revenue Million Forecast, by Technology 2019 & 2032
- Table 44: Global 3D Sensing & Imaging Market Revenue Million Forecast, by Type 2019 & 2032
- Table 45: Global 3D Sensing & Imaging Market Revenue Million Forecast, by Connectivity 2019 & 2032
- Table 46: Global 3D Sensing & Imaging Market Revenue Million Forecast, by End-user Industry 2019 & 2032
- Table 47: Global 3D Sensing & Imaging Market Revenue Million Forecast, by Country 2019 & 2032
Frequently Asked Questions
1. What is the projected Compound Annual Growth Rate (CAGR) of the 3D Sensing & Imaging Market?
The projected CAGR is approximately 13.92%.
2. Which companies are prominent players in the 3D Sensing & Imaging Market?
Key companies in the market include Panasonic, Infineon Technologies AG, Trimble, Omnivision Technologies Inc, Microchip Technology Inc, GE Healthcare, Lockheed Martin, Adobe, STMicroelectronics, Google, Sick AG, Faro, Texas Instruments Incorporated, Autodesk, Keyence, Dassault Systems*List Not Exhaustive, Qualcomm Inc.
3. What are the main segments of the 3D Sensing & Imaging Market?
The market segments include Component, Technology, Type, Connectivity, End-user Industry.
4. Can you provide details about the market size?
The market size is estimated to be USD 10.94 Million as of 2022.
5. What are some drivers contributing to market growth?
Integration of Optical and Electronic Components in Miniaturized Electronics Devices; Rising Demand for 3D-Enabled Devices in Consumer Electronics; Growing Penetration of Image Sensors in Automobiles; Growing Requirement of Security and Surveillance Systems.
6. What are the notable trends driving market growth?
Automotive Sector Expected to Drive Market Growth.
7. Are there any restraints impacting market growth?
High Manufacturing Cost of Image Sensors; Limited Integration With Other Devices; High Cost Required for the Maintenance of these Devices.
8. Can you provide examples of recent developments in the market?
March 2022 - LIPS Corporation and Newsight Imaging signed a Memorandum of Understanding (MoU) to develop, promote, and facilitate eTOF (enhanced-Time-Of-Flight) based 3D vision systems for industry 4.0 usage-cases and AIoT.
9. What pricing options are available for accessing the report?
Pricing options include single-user, multi-user, and enterprise licenses priced at USD 4750, USD 5250, and USD 8750 respectively.
10. Is the market size provided in terms of value or volume?
The market size is provided in terms of value, measured in Million.
11. Are there any specific market keywords associated with the report?
Yes, the market keyword associated with the report is "3D Sensing & Imaging Market," which aids in identifying and referencing the specific market segment covered.
12. How do I determine which pricing option suits my needs best?
The pricing options vary based on user requirements and access needs. Individual users may opt for single-user licenses, while businesses requiring broader access may choose multi-user or enterprise licenses for cost-effective access to the report.
13. Are there any additional resources or data provided in the 3D Sensing & Imaging Market report?
While the report offers comprehensive insights, it's advisable to review the specific contents or supplementary materials provided to ascertain if additional resources or data are available.
14. How can I stay updated on further developments or reports in the 3D Sensing & Imaging Market?
To stay informed about further developments, trends, and reports in the 3D Sensing & Imaging Market, consider subscribing to industry newsletters, following relevant companies and organizations, or regularly checking reputable industry news sources and publications.
Methodology
Step 1 - Identification of Relevant Samples Size from Population Database


Step 2 - Approaches for Defining Global Market Size (Value, Volume* & Price*)

Note*: In applicable scenarios
Step 3 - Data Sources
Primary Research
- Web Analytics
- Survey Reports
- Research Institute
- Latest Research Reports
- Opinion Leaders
Secondary Research
- Annual Reports
- White Paper
- Latest Press Release
- Industry Association
- Paid Database
- Investor Presentations

Step 4 - Data Triangulation
Involves using different sources of information in order to increase the validity of a study
These sources are likely to be stakeholders in a program - participants, other researchers, program staff, other community members, and so on.
Then we put all data in single framework & apply various statistical tools to find out the dynamic on the market.
During the analysis stage, feedback from the stakeholder groups would be compared to determine areas of agreement as well as areas of divergence


