
Key Insights
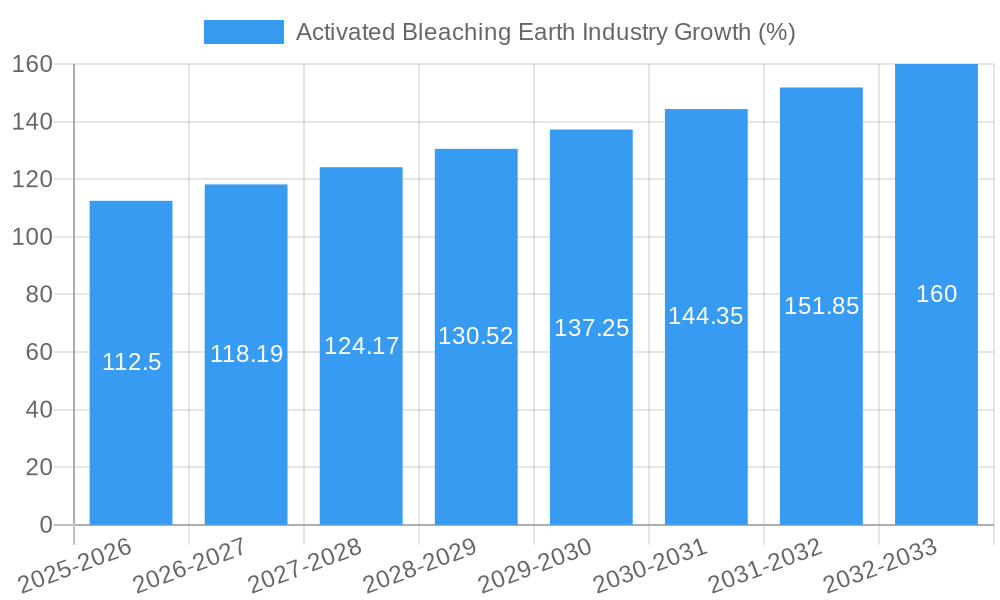
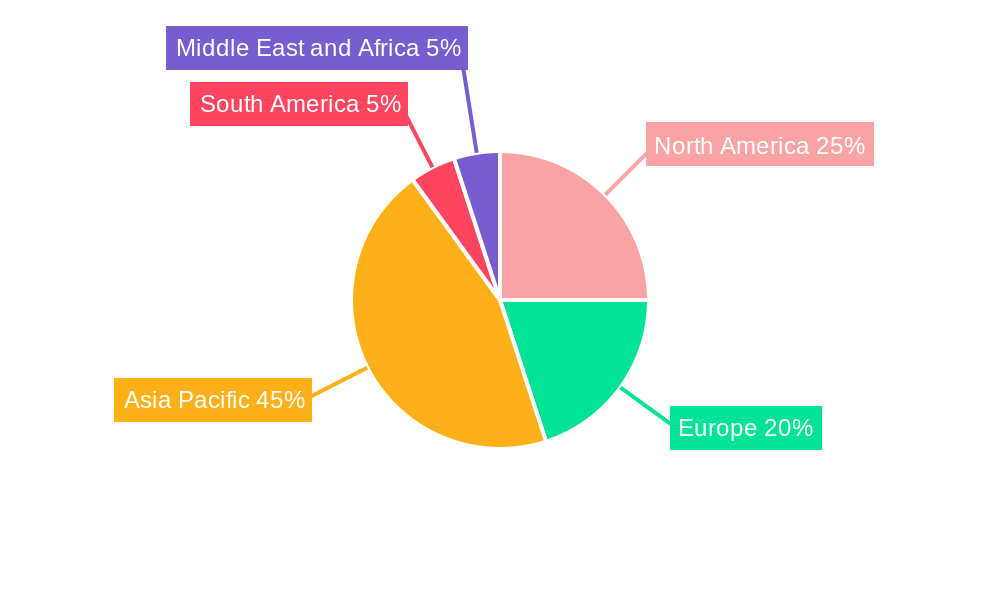
The Activated Bleaching Earth (ABE) industry is experiencing robust growth, driven by increasing demand from the edible oil and fats sector, particularly in developing economies with expanding populations and rising consumption of processed foods. The market's Compound Annual Growth Rate (CAGR) exceeding 4.50% signifies a consistently expanding market. Key drivers include the ABE's effectiveness in refining oils and fats, improving product quality, and extending shelf life. Furthermore, the growing biodiesel industry presents a significant opportunity for ABE application, contributing to the overall market expansion. While the market is fragmented with numerous players ranging from large multinationals to smaller regional producers, consolidation may occur as larger companies seek to enhance their market share and supply chain efficiencies. Regional variations exist, with Asia-Pacific, particularly China and India, expected to dominate the market due to their substantial edible oil consumption and growing industrial sectors. However, North America and Europe are also significant markets with established refining processes and consumer demand for high-quality products. Challenges include fluctuating raw material prices and environmental concerns regarding the sustainable sourcing and disposal of ABE.
The industry's segmentation showcases the dominance of the edible oil and fats application, which accounts for a considerable portion of total demand. Mineral oil and lubricants represent another significant segment, driven by the need for purification and decolorization processes. "Other Applications" including chemical processing and biodiesel production contribute to the overall market value, albeit at smaller scale compared to the main application segments. The competitive landscape is diverse, with both established international players and regional manufacturers vying for market share. Future growth will likely be influenced by technological advancements in ABE production, greater emphasis on sustainable practices, and the increasing adoption of ABE in emerging applications within the chemical and biofuel industries. Further market research is needed to pinpoint precise market size and segment breakdowns, but the provided data suggests a positive and expanding future for the activated bleaching earth industry.
Activated Bleaching Earth Industry: A Comprehensive Market Report (2019-2033)
This in-depth report provides a comprehensive analysis of the Activated Bleaching Earth industry, encompassing market size, growth projections, competitive landscape, and key industry trends from 2019 to 2033. The report leverages extensive primary and secondary research to deliver actionable insights for industry stakeholders, including manufacturers, investors, and regulatory bodies. The base year for this report is 2025, with a forecast period extending to 2033, offering a detailed perspective on the future of this dynamic market. The total market value is predicted to reach xx Million by 2033.
Activated Bleaching Earth Industry Market Concentration & Innovation
The Activated Bleaching Earth market exhibits a moderately concentrated structure, with key players holding significant market share. Clariant, Shell Plc (including EcoOils Limited), and Ashapura Perfoclay Limited (APL) are among the leading companies, collectively commanding an estimated xx% of the global market in 2025. Market concentration is influenced by factors such as economies of scale in production, established brand recognition, and access to advanced technologies.
Innovation in the industry is driven by the increasing demand for sustainable and efficient bleaching solutions. Key areas of innovation include the development of:
- Improved bleaching earth formulations: Enhanced adsorptive capacity, reduced processing time, and improved environmental performance are key priorities.
- Advanced processing technologies: This includes innovations in refining, activation, and product handling to enhance efficiency and cost-effectiveness.
- Sustainable sourcing and recycling: Growing environmental concerns are pushing companies to explore sustainable sourcing of raw materials and implement responsible recycling practices.
Regulatory frameworks, particularly those concerning environmental protection and waste management, significantly shape industry practices. Product substitutes, such as activated carbon, pose competitive pressure; however, the cost-effectiveness and established performance of bleaching earth maintain its dominant position. M&A activities, such as Shell's acquisition of EcoOils in November 2022 (valued at xx Million), underscore the industry's consolidation and the strategic pursuit of sustainable solutions. This deal signifies a growing focus on recycling spent bleaching earth oil for biofuel production, altering the market landscape.
Activated Bleaching Earth Industry Industry Trends & Insights
The Activated Bleaching Earth market is poised for significant growth, driven by robust demand from various sectors. The global market is estimated to reach xx Million in 2025, exhibiting a CAGR of xx% during the forecast period (2025-2033). This growth is fueled by several factors:
- Rising demand for refined oils: The expanding edible oil and fats industry, particularly in developing economies, fuels significant demand.
- Growth of the biofuel sector: Spent bleaching earth oil is an increasingly important feedstock for biofuel production, contributing to market expansion.
- Technological advancements: Continuous improvements in bleaching earth formulations and processing technologies are enhancing efficiency and effectiveness.
- Stringent regulatory norms: The growing focus on food safety and environmental sustainability is driving the adoption of high-quality bleaching earth.
However, price fluctuations in raw materials, particularly clay minerals, and intense competition from substitute materials pose challenges to market growth. Market penetration is highest in regions with established edible oil and fats processing industries and supportive government policies. The competitive dynamics are characterized by intense competition among established players and the emergence of new, innovative companies.
Dominant Markets & Segments in Activated Bleaching Earth Industry
The Edible Oil and Fats segment constitutes the largest application segment, holding approximately xx% of the market share in 2025. This dominance is attributable to the extensive use of bleaching earth in the refining of vegetable oils and fats to remove impurities and improve color and odor. Key drivers of growth in this segment include:
- Rising global consumption of edible oils: Driven by population growth and changing dietary habits.
- Increased demand for high-quality refined oils: Growing consumer awareness of food safety and quality.
- Government regulations: Stringent regulations regarding food safety and purity are increasing the adoption of bleaching earth.
The Mineral Oil and Lubricants segment represents a significant, albeit smaller, portion of the market. Growth in this segment is driven by the increasing demand for high-quality lubricants and the need for efficient refining processes.
Other Applications (Chemical, Biodiesel, etc.) segment is also witnessing steady growth driven by the increasing demand for biofuels and the need for efficient purification in chemical industries. The market is projected to reach xx Million by 2033.
The Asia-Pacific region is expected to remain the dominant market, fueled by robust economic growth, increasing edible oil consumption, and the presence of major producers. India and China are major contributors to this regional dominance. Strong government support for the edible oil industry in several countries further contributes to the regional market dominance.
Activated Bleaching Earth Industry Product Developments
Recent product innovations focus on improving the efficiency and sustainability of bleaching earth. This includes the development of formulations with enhanced adsorptive capacities, leading to reduced usage and waste. Improved processing technologies, including automation and precise control, enhance product quality and minimize environmental impact. These innovations provide competitive advantages through cost reduction, superior performance, and adherence to stringent environmental regulations. The market is witnessing a shift towards more sustainable and environmentally friendly products, aligning with global trends towards responsible manufacturing and consumption.
Report Scope & Segmentation Analysis
This report segments the Activated Bleaching Earth market based on application:
Edible Oil and Fats: This segment accounts for the largest share, driven by the rising demand for refined oils globally. Market size is projected to reach xx Million by 2033, growing at a CAGR of xx%. Competition is intense, with several major players vying for market share.
Mineral Oil and Lubricants: This segment contributes significantly to the overall market, fueled by growing demand in various industries. It is projected to reach xx Million by 2033. The market is characterized by a smaller number of specialized players.
Other Applications (Chemical, Biodiesel, etc.): This segment is experiencing rapid growth due to the rising adoption of biofuels and the need for efficient purification in chemical processes. Market size is expected to reach xx Million by 2033, exhibiting a CAGR of xx%. This segment is characterized by both established players and emerging companies.
Key Drivers of Activated Bleaching Earth Industry Growth
Several factors contribute to the growth of the Activated Bleaching Earth industry:
- Rising demand for refined edible oils: Population growth and changing dietary habits are key factors.
- Expansion of the biofuel industry: The use of spent bleaching earth oil as biofuel feedstock is a significant driver.
- Technological advancements: Innovations in bleaching earth formulations and processing technologies are improving efficiency.
- Stringent regulatory frameworks: Regulations related to food safety and environmental protection are impacting market growth positively.
Challenges in the Activated Bleaching Earth Industry Sector
Several factors pose challenges to the industry's growth:
- Fluctuations in raw material prices: The cost of clay minerals, a primary raw material, can significantly impact profitability.
- Intense competition: Competition from substitute materials, such as activated carbon, exerts pressure on pricing and market share.
- Environmental regulations: Adherence to strict environmental regulations necessitates investment in sustainable practices and technologies, leading to increased operational costs. The industry faces increasing pressure to minimize its environmental footprint.
Emerging Opportunities in Activated Bleaching Earth Industry
Several opportunities exist for growth within the Activated Bleaching Earth industry:
- Expansion into new geographic markets: Untapped potential exists in developing economies with growing demand for refined oils.
- Development of innovative products: Formulations with enhanced performance characteristics and sustainability features offer significant opportunities.
- Strategic partnerships and collaborations: Collaborations with players in the biofuel and chemical industries can open new avenues for growth.
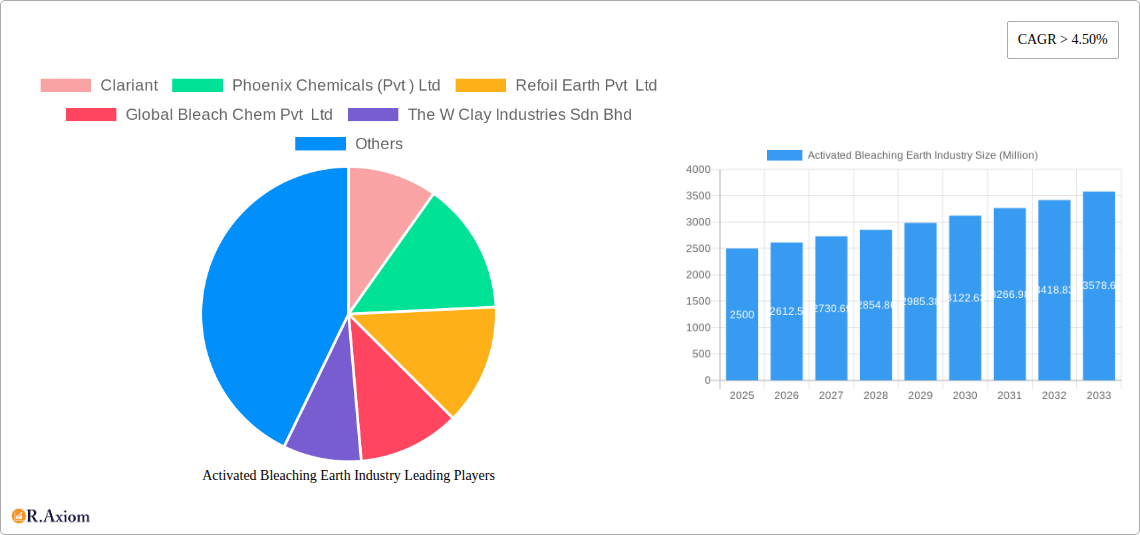
Leading Players in the Activated Bleaching Earth Industry Market
- Clariant
- Phoenix Chemicals (Pvt ) Ltd
- Refoil Earth Pvt Ltd
- Global Bleach Chem Pvt Ltd
- The W Clay Industries Sdn Bhd
- Hrp Industries
- Ashapura Perfoclay Limited (APL)
- Shell Plc (ecooils Limited)
- Taiko Group of Companies (Taiko Bleaching Earth Sdn Bhd )
- Oil-dri Corporation of America
- Musim Mas Holdings Pte Ltd
- Indian Clay And Mineral Co
Key Developments in Activated Bleaching Earth Industry Industry
- November 2022: Shell PLC acquired EcoOils Limited, a waste oil recycling company, enhancing its low-carbon fuel production capabilities and creating a new market for spent bleaching earth oil as a biofuel feedstock. This acquisition significantly impacted market dynamics, creating new opportunities for spent bleaching earth oil utilization and potentially altering the supply-demand balance for traditional bleaching earth applications.
Strategic Outlook for Activated Bleaching Earth Industry Market
The Activated Bleaching Earth market is poised for continued growth, driven by factors such as rising demand for refined oils, expansion of the biofuel sector, and technological advancements. Opportunities exist for players who can successfully navigate the challenges of raw material price volatility, intense competition, and environmental regulations. Companies focusing on innovation, sustainability, and strategic partnerships are best positioned to capitalize on the market's future potential. The increasing emphasis on sustainability will continue to shape industry practices, presenting opportunities for companies that develop environmentally friendly products and processes.
Activated Bleaching Earth Industry Segmentation
-
1. Application
- 1.1. Edible Oil and Fats
- 1.2. Mineral Oil and Lubricants
- 1.3. Other Applications (Chemical, Biodiesel, etc.)
Activated Bleaching Earth Industry Segmentation By Geography
-
1. Asia Pacific
- 1.1. China
- 1.2. India
- 1.3. Japan
- 1.4. South Korea
- 1.5. Rest of Asia Pacific
-
2. North America
- 2.1. United States
- 2.2. Canada
- 2.3. Mexico
-
3. Europe
- 3.1. Germany
- 3.2. United Kingdom
- 3.3. Italy
- 3.4. France
- 3.5. Rest of Europe
-
4. South America
- 4.1. Brazil
- 4.2. Argentina
- 4.3. Rest of South America
-
5. Middle East and Africa
- 5.1. Saudi Arabia
- 5.2. South Africa
- 5.3. Rest of Middle East and Africa
Activated Bleaching Earth Industry REPORT HIGHLIGHTS
| Aspects | Details |
|---|---|
| Study Period | 2019-2033 |
| Base Year | 2024 |
| Estimated Year | 2025 |
| Forecast Period | 2025-2033 |
| Historical Period | 2019-2024 |
| Growth Rate | CAGR of > 4.50% from 2019-2033 |
| Segmentation |
|
Table of Contents
- 1. Introduction
- 1.1. Research Scope
- 1.2. Market Segmentation
- 1.3. Research Methodology
- 1.4. Definitions and Assumptions
- 2. Executive Summary
- 2.1. Introduction
- 3. Market Dynamics
- 3.1. Introduction
- 3.2. Market Drivers
- 3.2.1. Growing Demand for Edible Oils
- 3.3. Market Restrains
- 3.3.1. Presence of Alternative Products and Technologies
- 3.4. Market Trends
- 3.4.1. Increasing Demand for Edible Oil & Fats
- 4. Market Factor Analysis
- 4.1. Porters Five Forces
- 4.2. Supply/Value Chain
- 4.3. PESTEL analysis
- 4.4. Market Entropy
- 4.5. Patent/Trademark Analysis
- 5. Global Activated Bleaching Earth Industry Analysis, Insights and Forecast, 2019-2031
- 5.1. Market Analysis, Insights and Forecast - by Application
- 5.1.1. Edible Oil and Fats
- 5.1.2. Mineral Oil and Lubricants
- 5.1.3. Other Applications (Chemical, Biodiesel, etc.)
- 5.2. Market Analysis, Insights and Forecast - by Region
- 5.2.1. Asia Pacific
- 5.2.2. North America
- 5.2.3. Europe
- 5.2.4. South America
- 5.2.5. Middle East and Africa
- 5.1. Market Analysis, Insights and Forecast - by Application
- 6. Asia Pacific Activated Bleaching Earth Industry Analysis, Insights and Forecast, 2019-2031
- 6.1. Market Analysis, Insights and Forecast - by Application
- 6.1.1. Edible Oil and Fats
- 6.1.2. Mineral Oil and Lubricants
- 6.1.3. Other Applications (Chemical, Biodiesel, etc.)
- 6.1. Market Analysis, Insights and Forecast - by Application
- 7. North America Activated Bleaching Earth Industry Analysis, Insights and Forecast, 2019-2031
- 7.1. Market Analysis, Insights and Forecast - by Application
- 7.1.1. Edible Oil and Fats
- 7.1.2. Mineral Oil and Lubricants
- 7.1.3. Other Applications (Chemical, Biodiesel, etc.)
- 7.1. Market Analysis, Insights and Forecast - by Application
- 8. Europe Activated Bleaching Earth Industry Analysis, Insights and Forecast, 2019-2031
- 8.1. Market Analysis, Insights and Forecast - by Application
- 8.1.1. Edible Oil and Fats
- 8.1.2. Mineral Oil and Lubricants
- 8.1.3. Other Applications (Chemical, Biodiesel, etc.)
- 8.1. Market Analysis, Insights and Forecast - by Application
- 9. South America Activated Bleaching Earth Industry Analysis, Insights and Forecast, 2019-2031
- 9.1. Market Analysis, Insights and Forecast - by Application
- 9.1.1. Edible Oil and Fats
- 9.1.2. Mineral Oil and Lubricants
- 9.1.3. Other Applications (Chemical, Biodiesel, etc.)
- 9.1. Market Analysis, Insights and Forecast - by Application
- 10. Middle East and Africa Activated Bleaching Earth Industry Analysis, Insights and Forecast, 2019-2031
- 10.1. Market Analysis, Insights and Forecast - by Application
- 10.1.1. Edible Oil and Fats
- 10.1.2. Mineral Oil and Lubricants
- 10.1.3. Other Applications (Chemical, Biodiesel, etc.)
- 10.1. Market Analysis, Insights and Forecast - by Application
- 11. Asia Pacific Activated Bleaching Earth Industry Analysis, Insights and Forecast, 2019-2031
- 11.1. Market Analysis, Insights and Forecast - By Country/Sub-region
- 11.1.1 China
- 11.1.2 India
- 11.1.3 Japan
- 11.1.4 South Korea
- 11.1.5 Rest of Asia Pacific
- 12. North America Activated Bleaching Earth Industry Analysis, Insights and Forecast, 2019-2031
- 12.1. Market Analysis, Insights and Forecast - By Country/Sub-region
- 12.1.1 United States
- 12.1.2 Canada
- 12.1.3 Mexico
- 13. Europe Activated Bleaching Earth Industry Analysis, Insights and Forecast, 2019-2031
- 13.1. Market Analysis, Insights and Forecast - By Country/Sub-region
- 13.1.1 Germany
- 13.1.2 United Kingdom
- 13.1.3 Italy
- 13.1.4 France
- 13.1.5 Rest of Europe
- 14. South America Activated Bleaching Earth Industry Analysis, Insights and Forecast, 2019-2031
- 14.1. Market Analysis, Insights and Forecast - By Country/Sub-region
- 14.1.1 Brazil
- 14.1.2 Argentina
- 14.1.3 Rest of South America
- 15. Middle East and Africa Activated Bleaching Earth Industry Analysis, Insights and Forecast, 2019-2031
- 15.1. Market Analysis, Insights and Forecast - By Country/Sub-region
- 15.1.1 Saudi Arabia
- 15.1.2 South Africa
- 15.1.3 Rest of Middle East and Africa
- 16. Competitive Analysis
- 16.1. Global Market Share Analysis 2024
- 16.2. Company Profiles
- 16.2.1 Clariant
- 16.2.1.1. Overview
- 16.2.1.2. Products
- 16.2.1.3. SWOT Analysis
- 16.2.1.4. Recent Developments
- 16.2.1.5. Financials (Based on Availability)
- 16.2.2 Phoenix Chemicals (Pvt ) Ltd
- 16.2.2.1. Overview
- 16.2.2.2. Products
- 16.2.2.3. SWOT Analysis
- 16.2.2.4. Recent Developments
- 16.2.2.5. Financials (Based on Availability)
- 16.2.3 Refoil Earth Pvt Ltd
- 16.2.3.1. Overview
- 16.2.3.2. Products
- 16.2.3.3. SWOT Analysis
- 16.2.3.4. Recent Developments
- 16.2.3.5. Financials (Based on Availability)
- 16.2.4 Global Bleach Chem Pvt Ltd
- 16.2.4.1. Overview
- 16.2.4.2. Products
- 16.2.4.3. SWOT Analysis
- 16.2.4.4. Recent Developments
- 16.2.4.5. Financials (Based on Availability)
- 16.2.5 The W Clay Industries Sdn Bhd
- 16.2.5.1. Overview
- 16.2.5.2. Products
- 16.2.5.3. SWOT Analysis
- 16.2.5.4. Recent Developments
- 16.2.5.5. Financials (Based on Availability)
- 16.2.6 Hrp Industries
- 16.2.6.1. Overview
- 16.2.6.2. Products
- 16.2.6.3. SWOT Analysis
- 16.2.6.4. Recent Developments
- 16.2.6.5. Financials (Based on Availability)
- 16.2.7 Ashapura Perfoclay Limited (APL)
- 16.2.7.1. Overview
- 16.2.7.2. Products
- 16.2.7.3. SWOT Analysis
- 16.2.7.4. Recent Developments
- 16.2.7.5. Financials (Based on Availability)
- 16.2.8 Shell Plc (ecooils Limited)
- 16.2.8.1. Overview
- 16.2.8.2. Products
- 16.2.8.3. SWOT Analysis
- 16.2.8.4. Recent Developments
- 16.2.8.5. Financials (Based on Availability)
- 16.2.9 Taiko Group of Companies (Taiko Bleaching Earth Sdn Bhd )
- 16.2.9.1. Overview
- 16.2.9.2. Products
- 16.2.9.3. SWOT Analysis
- 16.2.9.4. Recent Developments
- 16.2.9.5. Financials (Based on Availability)
- 16.2.10 Oil-dri Corporation of America
- 16.2.10.1. Overview
- 16.2.10.2. Products
- 16.2.10.3. SWOT Analysis
- 16.2.10.4. Recent Developments
- 16.2.10.5. Financials (Based on Availability)
- 16.2.11 Musim Mas Holdings Pte Ltd
- 16.2.11.1. Overview
- 16.2.11.2. Products
- 16.2.11.3. SWOT Analysis
- 16.2.11.4. Recent Developments
- 16.2.11.5. Financials (Based on Availability)
- 16.2.12 Indian Clay And Mineral Co
- 16.2.12.1. Overview
- 16.2.12.2. Products
- 16.2.12.3. SWOT Analysis
- 16.2.12.4. Recent Developments
- 16.2.12.5. Financials (Based on Availability)
- 16.2.1 Clariant
List of Figures
- Figure 1: Global Activated Bleaching Earth Industry Revenue Breakdown (Million, %) by Region 2024 & 2032
- Figure 2: Global Activated Bleaching Earth Industry Volume Breakdown (K Tons, %) by Region 2024 & 2032
- Figure 3: Asia Pacific Activated Bleaching Earth Industry Revenue (Million), by Country 2024 & 2032
- Figure 4: Asia Pacific Activated Bleaching Earth Industry Volume (K Tons), by Country 2024 & 2032
- Figure 5: Asia Pacific Activated Bleaching Earth Industry Revenue Share (%), by Country 2024 & 2032
- Figure 6: Asia Pacific Activated Bleaching Earth Industry Volume Share (%), by Country 2024 & 2032
- Figure 7: North America Activated Bleaching Earth Industry Revenue (Million), by Country 2024 & 2032
- Figure 8: North America Activated Bleaching Earth Industry Volume (K Tons), by Country 2024 & 2032
- Figure 9: North America Activated Bleaching Earth Industry Revenue Share (%), by Country 2024 & 2032
- Figure 10: North America Activated Bleaching Earth Industry Volume Share (%), by Country 2024 & 2032
- Figure 11: Europe Activated Bleaching Earth Industry Revenue (Million), by Country 2024 & 2032
- Figure 12: Europe Activated Bleaching Earth Industry Volume (K Tons), by Country 2024 & 2032
- Figure 13: Europe Activated Bleaching Earth Industry Revenue Share (%), by Country 2024 & 2032
- Figure 14: Europe Activated Bleaching Earth Industry Volume Share (%), by Country 2024 & 2032
- Figure 15: South America Activated Bleaching Earth Industry Revenue (Million), by Country 2024 & 2032
- Figure 16: South America Activated Bleaching Earth Industry Volume (K Tons), by Country 2024 & 2032
- Figure 17: South America Activated Bleaching Earth Industry Revenue Share (%), by Country 2024 & 2032
- Figure 18: South America Activated Bleaching Earth Industry Volume Share (%), by Country 2024 & 2032
- Figure 19: Middle East and Africa Activated Bleaching Earth Industry Revenue (Million), by Country 2024 & 2032
- Figure 20: Middle East and Africa Activated Bleaching Earth Industry Volume (K Tons), by Country 2024 & 2032
- Figure 21: Middle East and Africa Activated Bleaching Earth Industry Revenue Share (%), by Country 2024 & 2032
- Figure 22: Middle East and Africa Activated Bleaching Earth Industry Volume Share (%), by Country 2024 & 2032
- Figure 23: Asia Pacific Activated Bleaching Earth Industry Revenue (Million), by Application 2024 & 2032
- Figure 24: Asia Pacific Activated Bleaching Earth Industry Volume (K Tons), by Application 2024 & 2032
- Figure 25: Asia Pacific Activated Bleaching Earth Industry Revenue Share (%), by Application 2024 & 2032
- Figure 26: Asia Pacific Activated Bleaching Earth Industry Volume Share (%), by Application 2024 & 2032
- Figure 27: Asia Pacific Activated Bleaching Earth Industry Revenue (Million), by Country 2024 & 2032
- Figure 28: Asia Pacific Activated Bleaching Earth Industry Volume (K Tons), by Country 2024 & 2032
- Figure 29: Asia Pacific Activated Bleaching Earth Industry Revenue Share (%), by Country 2024 & 2032
- Figure 30: Asia Pacific Activated Bleaching Earth Industry Volume Share (%), by Country 2024 & 2032
- Figure 31: North America Activated Bleaching Earth Industry Revenue (Million), by Application 2024 & 2032
- Figure 32: North America Activated Bleaching Earth Industry Volume (K Tons), by Application 2024 & 2032
- Figure 33: North America Activated Bleaching Earth Industry Revenue Share (%), by Application 2024 & 2032
- Figure 34: North America Activated Bleaching Earth Industry Volume Share (%), by Application 2024 & 2032
- Figure 35: North America Activated Bleaching Earth Industry Revenue (Million), by Country 2024 & 2032
- Figure 36: North America Activated Bleaching Earth Industry Volume (K Tons), by Country 2024 & 2032
- Figure 37: North America Activated Bleaching Earth Industry Revenue Share (%), by Country 2024 & 2032
- Figure 38: North America Activated Bleaching Earth Industry Volume Share (%), by Country 2024 & 2032
- Figure 39: Europe Activated Bleaching Earth Industry Revenue (Million), by Application 2024 & 2032
- Figure 40: Europe Activated Bleaching Earth Industry Volume (K Tons), by Application 2024 & 2032
- Figure 41: Europe Activated Bleaching Earth Industry Revenue Share (%), by Application 2024 & 2032
- Figure 42: Europe Activated Bleaching Earth Industry Volume Share (%), by Application 2024 & 2032
- Figure 43: Europe Activated Bleaching Earth Industry Revenue (Million), by Country 2024 & 2032
- Figure 44: Europe Activated Bleaching Earth Industry Volume (K Tons), by Country 2024 & 2032
- Figure 45: Europe Activated Bleaching Earth Industry Revenue Share (%), by Country 2024 & 2032
- Figure 46: Europe Activated Bleaching Earth Industry Volume Share (%), by Country 2024 & 2032
- Figure 47: South America Activated Bleaching Earth Industry Revenue (Million), by Application 2024 & 2032
- Figure 48: South America Activated Bleaching Earth Industry Volume (K Tons), by Application 2024 & 2032
- Figure 49: South America Activated Bleaching Earth Industry Revenue Share (%), by Application 2024 & 2032
- Figure 50: South America Activated Bleaching Earth Industry Volume Share (%), by Application 2024 & 2032
- Figure 51: South America Activated Bleaching Earth Industry Revenue (Million), by Country 2024 & 2032
- Figure 52: South America Activated Bleaching Earth Industry Volume (K Tons), by Country 2024 & 2032
- Figure 53: South America Activated Bleaching Earth Industry Revenue Share (%), by Country 2024 & 2032
- Figure 54: South America Activated Bleaching Earth Industry Volume Share (%), by Country 2024 & 2032
- Figure 55: Middle East and Africa Activated Bleaching Earth Industry Revenue (Million), by Application 2024 & 2032
- Figure 56: Middle East and Africa Activated Bleaching Earth Industry Volume (K Tons), by Application 2024 & 2032
- Figure 57: Middle East and Africa Activated Bleaching Earth Industry Revenue Share (%), by Application 2024 & 2032
- Figure 58: Middle East and Africa Activated Bleaching Earth Industry Volume Share (%), by Application 2024 & 2032
- Figure 59: Middle East and Africa Activated Bleaching Earth Industry Revenue (Million), by Country 2024 & 2032
- Figure 60: Middle East and Africa Activated Bleaching Earth Industry Volume (K Tons), by Country 2024 & 2032
- Figure 61: Middle East and Africa Activated Bleaching Earth Industry Revenue Share (%), by Country 2024 & 2032
- Figure 62: Middle East and Africa Activated Bleaching Earth Industry Volume Share (%), by Country 2024 & 2032
List of Tables
- Table 1: Global Activated Bleaching Earth Industry Revenue Million Forecast, by Region 2019 & 2032
- Table 2: Global Activated Bleaching Earth Industry Volume K Tons Forecast, by Region 2019 & 2032
- Table 3: Global Activated Bleaching Earth Industry Revenue Million Forecast, by Application 2019 & 2032
- Table 4: Global Activated Bleaching Earth Industry Volume K Tons Forecast, by Application 2019 & 2032
- Table 5: Global Activated Bleaching Earth Industry Revenue Million Forecast, by Region 2019 & 2032
- Table 6: Global Activated Bleaching Earth Industry Volume K Tons Forecast, by Region 2019 & 2032
- Table 7: Global Activated Bleaching Earth Industry Revenue Million Forecast, by Country 2019 & 2032
- Table 8: Global Activated Bleaching Earth Industry Volume K Tons Forecast, by Country 2019 & 2032
- Table 9: China Activated Bleaching Earth Industry Revenue (Million) Forecast, by Application 2019 & 2032
- Table 10: China Activated Bleaching Earth Industry Volume (K Tons) Forecast, by Application 2019 & 2032
- Table 11: India Activated Bleaching Earth Industry Revenue (Million) Forecast, by Application 2019 & 2032
- Table 12: India Activated Bleaching Earth Industry Volume (K Tons) Forecast, by Application 2019 & 2032
- Table 13: Japan Activated Bleaching Earth Industry Revenue (Million) Forecast, by Application 2019 & 2032
- Table 14: Japan Activated Bleaching Earth Industry Volume (K Tons) Forecast, by Application 2019 & 2032
- Table 15: South Korea Activated Bleaching Earth Industry Revenue (Million) Forecast, by Application 2019 & 2032
- Table 16: South Korea Activated Bleaching Earth Industry Volume (K Tons) Forecast, by Application 2019 & 2032
- Table 17: Rest of Asia Pacific Activated Bleaching Earth Industry Revenue (Million) Forecast, by Application 2019 & 2032
- Table 18: Rest of Asia Pacific Activated Bleaching Earth Industry Volume (K Tons) Forecast, by Application 2019 & 2032
- Table 19: Global Activated Bleaching Earth Industry Revenue Million Forecast, by Country 2019 & 2032
- Table 20: Global Activated Bleaching Earth Industry Volume K Tons Forecast, by Country 2019 & 2032
- Table 21: United States Activated Bleaching Earth Industry Revenue (Million) Forecast, by Application 2019 & 2032
- Table 22: United States Activated Bleaching Earth Industry Volume (K Tons) Forecast, by Application 2019 & 2032
- Table 23: Canada Activated Bleaching Earth Industry Revenue (Million) Forecast, by Application 2019 & 2032
- Table 24: Canada Activated Bleaching Earth Industry Volume (K Tons) Forecast, by Application 2019 & 2032
- Table 25: Mexico Activated Bleaching Earth Industry Revenue (Million) Forecast, by Application 2019 & 2032
- Table 26: Mexico Activated Bleaching Earth Industry Volume (K Tons) Forecast, by Application 2019 & 2032
- Table 27: Global Activated Bleaching Earth Industry Revenue Million Forecast, by Country 2019 & 2032
- Table 28: Global Activated Bleaching Earth Industry Volume K Tons Forecast, by Country 2019 & 2032
- Table 29: Germany Activated Bleaching Earth Industry Revenue (Million) Forecast, by Application 2019 & 2032
- Table 30: Germany Activated Bleaching Earth Industry Volume (K Tons) Forecast, by Application 2019 & 2032
- Table 31: United Kingdom Activated Bleaching Earth Industry Revenue (Million) Forecast, by Application 2019 & 2032
- Table 32: United Kingdom Activated Bleaching Earth Industry Volume (K Tons) Forecast, by Application 2019 & 2032
- Table 33: Italy Activated Bleaching Earth Industry Revenue (Million) Forecast, by Application 2019 & 2032
- Table 34: Italy Activated Bleaching Earth Industry Volume (K Tons) Forecast, by Application 2019 & 2032
- Table 35: France Activated Bleaching Earth Industry Revenue (Million) Forecast, by Application 2019 & 2032
- Table 36: France Activated Bleaching Earth Industry Volume (K Tons) Forecast, by Application 2019 & 2032
- Table 37: Rest of Europe Activated Bleaching Earth Industry Revenue (Million) Forecast, by Application 2019 & 2032
- Table 38: Rest of Europe Activated Bleaching Earth Industry Volume (K Tons) Forecast, by Application 2019 & 2032
- Table 39: Global Activated Bleaching Earth Industry Revenue Million Forecast, by Country 2019 & 2032
- Table 40: Global Activated Bleaching Earth Industry Volume K Tons Forecast, by Country 2019 & 2032
- Table 41: Brazil Activated Bleaching Earth Industry Revenue (Million) Forecast, by Application 2019 & 2032
- Table 42: Brazil Activated Bleaching Earth Industry Volume (K Tons) Forecast, by Application 2019 & 2032
- Table 43: Argentina Activated Bleaching Earth Industry Revenue (Million) Forecast, by Application 2019 & 2032
- Table 44: Argentina Activated Bleaching Earth Industry Volume (K Tons) Forecast, by Application 2019 & 2032
- Table 45: Rest of South America Activated Bleaching Earth Industry Revenue (Million) Forecast, by Application 2019 & 2032
- Table 46: Rest of South America Activated Bleaching Earth Industry Volume (K Tons) Forecast, by Application 2019 & 2032
- Table 47: Global Activated Bleaching Earth Industry Revenue Million Forecast, by Country 2019 & 2032
- Table 48: Global Activated Bleaching Earth Industry Volume K Tons Forecast, by Country 2019 & 2032
- Table 49: Saudi Arabia Activated Bleaching Earth Industry Revenue (Million) Forecast, by Application 2019 & 2032
- Table 50: Saudi Arabia Activated Bleaching Earth Industry Volume (K Tons) Forecast, by Application 2019 & 2032
- Table 51: South Africa Activated Bleaching Earth Industry Revenue (Million) Forecast, by Application 2019 & 2032
- Table 52: South Africa Activated Bleaching Earth Industry Volume (K Tons) Forecast, by Application 2019 & 2032
- Table 53: Rest of Middle East and Africa Activated Bleaching Earth Industry Revenue (Million) Forecast, by Application 2019 & 2032
- Table 54: Rest of Middle East and Africa Activated Bleaching Earth Industry Volume (K Tons) Forecast, by Application 2019 & 2032
- Table 55: Global Activated Bleaching Earth Industry Revenue Million Forecast, by Application 2019 & 2032
- Table 56: Global Activated Bleaching Earth Industry Volume K Tons Forecast, by Application 2019 & 2032
- Table 57: Global Activated Bleaching Earth Industry Revenue Million Forecast, by Country 2019 & 2032
- Table 58: Global Activated Bleaching Earth Industry Volume K Tons Forecast, by Country 2019 & 2032
- Table 59: China Activated Bleaching Earth Industry Revenue (Million) Forecast, by Application 2019 & 2032
- Table 60: China Activated Bleaching Earth Industry Volume (K Tons) Forecast, by Application 2019 & 2032
- Table 61: India Activated Bleaching Earth Industry Revenue (Million) Forecast, by Application 2019 & 2032
- Table 62: India Activated Bleaching Earth Industry Volume (K Tons) Forecast, by Application 2019 & 2032
- Table 63: Japan Activated Bleaching Earth Industry Revenue (Million) Forecast, by Application 2019 & 2032
- Table 64: Japan Activated Bleaching Earth Industry Volume (K Tons) Forecast, by Application 2019 & 2032
- Table 65: South Korea Activated Bleaching Earth Industry Revenue (Million) Forecast, by Application 2019 & 2032
- Table 66: South Korea Activated Bleaching Earth Industry Volume (K Tons) Forecast, by Application 2019 & 2032
- Table 67: Rest of Asia Pacific Activated Bleaching Earth Industry Revenue (Million) Forecast, by Application 2019 & 2032
- Table 68: Rest of Asia Pacific Activated Bleaching Earth Industry Volume (K Tons) Forecast, by Application 2019 & 2032
- Table 69: Global Activated Bleaching Earth Industry Revenue Million Forecast, by Application 2019 & 2032
- Table 70: Global Activated Bleaching Earth Industry Volume K Tons Forecast, by Application 2019 & 2032
- Table 71: Global Activated Bleaching Earth Industry Revenue Million Forecast, by Country 2019 & 2032
- Table 72: Global Activated Bleaching Earth Industry Volume K Tons Forecast, by Country 2019 & 2032
- Table 73: United States Activated Bleaching Earth Industry Revenue (Million) Forecast, by Application 2019 & 2032
- Table 74: United States Activated Bleaching Earth Industry Volume (K Tons) Forecast, by Application 2019 & 2032
- Table 75: Canada Activated Bleaching Earth Industry Revenue (Million) Forecast, by Application 2019 & 2032
- Table 76: Canada Activated Bleaching Earth Industry Volume (K Tons) Forecast, by Application 2019 & 2032
- Table 77: Mexico Activated Bleaching Earth Industry Revenue (Million) Forecast, by Application 2019 & 2032
- Table 78: Mexico Activated Bleaching Earth Industry Volume (K Tons) Forecast, by Application 2019 & 2032
- Table 79: Global Activated Bleaching Earth Industry Revenue Million Forecast, by Application 2019 & 2032
- Table 80: Global Activated Bleaching Earth Industry Volume K Tons Forecast, by Application 2019 & 2032
- Table 81: Global Activated Bleaching Earth Industry Revenue Million Forecast, by Country 2019 & 2032
- Table 82: Global Activated Bleaching Earth Industry Volume K Tons Forecast, by Country 2019 & 2032
- Table 83: Germany Activated Bleaching Earth Industry Revenue (Million) Forecast, by Application 2019 & 2032
- Table 84: Germany Activated Bleaching Earth Industry Volume (K Tons) Forecast, by Application 2019 & 2032
- Table 85: United Kingdom Activated Bleaching Earth Industry Revenue (Million) Forecast, by Application 2019 & 2032
- Table 86: United Kingdom Activated Bleaching Earth Industry Volume (K Tons) Forecast, by Application 2019 & 2032
- Table 87: Italy Activated Bleaching Earth Industry Revenue (Million) Forecast, by Application 2019 & 2032
- Table 88: Italy Activated Bleaching Earth Industry Volume (K Tons) Forecast, by Application 2019 & 2032
- Table 89: France Activated Bleaching Earth Industry Revenue (Million) Forecast, by Application 2019 & 2032
- Table 90: France Activated Bleaching Earth Industry Volume (K Tons) Forecast, by Application 2019 & 2032
- Table 91: Rest of Europe Activated Bleaching Earth Industry Revenue (Million) Forecast, by Application 2019 & 2032
- Table 92: Rest of Europe Activated Bleaching Earth Industry Volume (K Tons) Forecast, by Application 2019 & 2032
- Table 93: Global Activated Bleaching Earth Industry Revenue Million Forecast, by Application 2019 & 2032
- Table 94: Global Activated Bleaching Earth Industry Volume K Tons Forecast, by Application 2019 & 2032
- Table 95: Global Activated Bleaching Earth Industry Revenue Million Forecast, by Country 2019 & 2032
- Table 96: Global Activated Bleaching Earth Industry Volume K Tons Forecast, by Country 2019 & 2032
- Table 97: Brazil Activated Bleaching Earth Industry Revenue (Million) Forecast, by Application 2019 & 2032
- Table 98: Brazil Activated Bleaching Earth Industry Volume (K Tons) Forecast, by Application 2019 & 2032
- Table 99: Argentina Activated Bleaching Earth Industry Revenue (Million) Forecast, by Application 2019 & 2032
- Table 100: Argentina Activated Bleaching Earth Industry Volume (K Tons) Forecast, by Application 2019 & 2032
- Table 101: Rest of South America Activated Bleaching Earth Industry Revenue (Million) Forecast, by Application 2019 & 2032
- Table 102: Rest of South America Activated Bleaching Earth Industry Volume (K Tons) Forecast, by Application 2019 & 2032
- Table 103: Global Activated Bleaching Earth Industry Revenue Million Forecast, by Application 2019 & 2032
- Table 104: Global Activated Bleaching Earth Industry Volume K Tons Forecast, by Application 2019 & 2032
- Table 105: Global Activated Bleaching Earth Industry Revenue Million Forecast, by Country 2019 & 2032
- Table 106: Global Activated Bleaching Earth Industry Volume K Tons Forecast, by Country 2019 & 2032
- Table 107: Saudi Arabia Activated Bleaching Earth Industry Revenue (Million) Forecast, by Application 2019 & 2032
- Table 108: Saudi Arabia Activated Bleaching Earth Industry Volume (K Tons) Forecast, by Application 2019 & 2032
- Table 109: South Africa Activated Bleaching Earth Industry Revenue (Million) Forecast, by Application 2019 & 2032
- Table 110: South Africa Activated Bleaching Earth Industry Volume (K Tons) Forecast, by Application 2019 & 2032
- Table 111: Rest of Middle East and Africa Activated Bleaching Earth Industry Revenue (Million) Forecast, by Application 2019 & 2032
- Table 112: Rest of Middle East and Africa Activated Bleaching Earth Industry Volume (K Tons) Forecast, by Application 2019 & 2032
Frequently Asked Questions
1. What is the projected Compound Annual Growth Rate (CAGR) of the Activated Bleaching Earth Industry?
The projected CAGR is approximately > 4.50%.
2. Which companies are prominent players in the Activated Bleaching Earth Industry?
Key companies in the market include Clariant, Phoenix Chemicals (Pvt ) Ltd, Refoil Earth Pvt Ltd, Global Bleach Chem Pvt Ltd, The W Clay Industries Sdn Bhd, Hrp Industries, Ashapura Perfoclay Limited (APL), Shell Plc (ecooils Limited), Taiko Group of Companies (Taiko Bleaching Earth Sdn Bhd ), Oil-dri Corporation of America, Musim Mas Holdings Pte Ltd, Indian Clay And Mineral Co.
3. What are the main segments of the Activated Bleaching Earth Industry?
The market segments include Application.
4. Can you provide details about the market size?
The market size is estimated to be USD XX Million as of 2022.
5. What are some drivers contributing to market growth?
Growing Demand for Edible Oils.
6. What are the notable trends driving market growth?
Increasing Demand for Edible Oil & Fats.
7. Are there any restraints impacting market growth?
Presence of Alternative Products and Technologies.
8. Can you provide examples of recent developments in the market?
November 2022: Shell Eastern Petroleum (Pte) Ltd, a wholly-owned subsidiary of Shell PLC (Shell), acquired EcoOilsLimited (EcoOils), a waste oil recycling company. This acquisition is part of Shell's goal to enhance the production of low-carbon transportation fuels, particularly sustainable aviation fuel. EcoOilsMalaysia's subsidiaries and 90% of its Indonesian subsidiary will be acquired. EcoOilsuse recycling technology prevents waste from going to landfills and produces spent bleaching earth oil, an internationally recognized biofuels feedstock that can be used to produce low-carbon fuels.
9. What pricing options are available for accessing the report?
Pricing options include single-user, multi-user, and enterprise licenses priced at USD 4750, USD 5250, and USD 8750 respectively.
10. Is the market size provided in terms of value or volume?
The market size is provided in terms of value, measured in Million and volume, measured in K Tons.
11. Are there any specific market keywords associated with the report?
Yes, the market keyword associated with the report is "Activated Bleaching Earth Industry," which aids in identifying and referencing the specific market segment covered.
12. How do I determine which pricing option suits my needs best?
The pricing options vary based on user requirements and access needs. Individual users may opt for single-user licenses, while businesses requiring broader access may choose multi-user or enterprise licenses for cost-effective access to the report.
13. Are there any additional resources or data provided in the Activated Bleaching Earth Industry report?
While the report offers comprehensive insights, it's advisable to review the specific contents or supplementary materials provided to ascertain if additional resources or data are available.
14. How can I stay updated on further developments or reports in the Activated Bleaching Earth Industry?
To stay informed about further developments, trends, and reports in the Activated Bleaching Earth Industry, consider subscribing to industry newsletters, following relevant companies and organizations, or regularly checking reputable industry news sources and publications.
Methodology
Step 1 - Identification of Relevant Samples Size from Population Database


Step 2 - Approaches for Defining Global Market Size (Value, Volume* & Price*)

Note*: In applicable scenarios
Step 3 - Data Sources
Primary Research
- Web Analytics
- Survey Reports
- Research Institute
- Latest Research Reports
- Opinion Leaders
Secondary Research
- Annual Reports
- White Paper
- Latest Press Release
- Industry Association
- Paid Database
- Investor Presentations

Step 4 - Data Triangulation
Involves using different sources of information in order to increase the validity of a study
These sources are likely to be stakeholders in a program - participants, other researchers, program staff, other community members, and so on.
Then we put all data in single framework & apply various statistical tools to find out the dynamic on the market.
During the analysis stage, feedback from the stakeholder groups would be compared to determine areas of agreement as well as areas of divergence


