
Key Insights
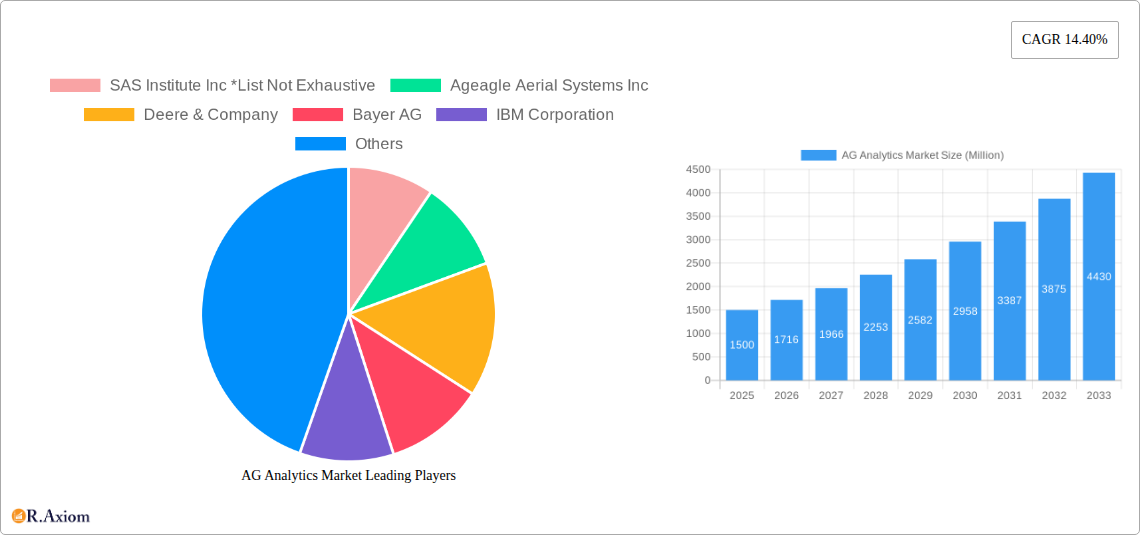
The global agricultural analytics market is experiencing robust growth, driven by the increasing need for precision farming techniques and data-driven decision-making among farmers. The market's Compound Annual Growth Rate (CAGR) of 14.40% from 2019 to 2024 signifies a significant upward trajectory. This growth is fueled by several key factors. Firstly, the adoption of advanced technologies such as IoT sensors, drones, and satellite imagery is providing farmers with unprecedented access to real-time data on soil conditions, crop health, and livestock performance. This data empowers farmers to optimize resource utilization, improve yields, and reduce operational costs. Secondly, the increasing prevalence of cloud-based solutions is making agricultural analytics more accessible and affordable for farmers of all sizes, particularly those in developing economies. Finally, government initiatives promoting sustainable agriculture and precision farming are further stimulating market expansion. The market segmentation reveals a strong demand across various deployment types (on-premise and cloud), farm sizes (small & medium, large), component types (solutions and services), and analytics types (farm and livestock). Companies such as SAS Institute, Deere & Company, and IBM are leading the innovation and adoption of these technologies, contributing significantly to the overall market growth.
The market's future growth will likely be influenced by several factors. Continued advancements in data analytics techniques, such as artificial intelligence and machine learning, will lead to even more sophisticated and insightful solutions. The increasing integration of agricultural analytics with other farm management systems will also enhance efficiency and decision-making. However, challenges remain, including the high initial investment costs for some technologies, the need for reliable internet connectivity in certain regions, and the need for sufficient training and education to ensure effective adoption by farmers. Despite these hurdles, the long-term outlook for the agricultural analytics market remains positive, with continued expansion projected throughout the forecast period (2025-2033). The various segments are expected to witness substantial growth, driven by the diverse needs of different farming operations and technological advancements.
This in-depth report provides a comprehensive analysis of the AG Analytics Market, offering valuable insights for stakeholders across the agricultural technology landscape. Covering the period from 2019 to 2033, with a focus on 2025, this report delves into market dynamics, segmentation, key players, and future growth potential. The study utilizes rigorous research methodologies and incorporates substantial data to present a clear and actionable picture of this rapidly evolving market.
AG Analytics Market Concentration & Innovation
The AG Analytics market exhibits a moderately concentrated landscape, with several major players holding significant market share. However, the market is also characterized by a high degree of innovation, driven by advancements in data analytics, artificial intelligence (AI), and the Internet of Things (IoT).
Key players such as SAS Institute Inc, Deere & Company, and IBM Corporation, hold a combined market share estimated at xx%, influencing market pricing and technological directions. The market also witnesses a significant number of smaller, specialized companies focusing on niche applications or technologies.
Mergers and acquisitions (M&A) activity has been relatively robust, with deal values exceeding xx Million in the past five years, demonstrating consolidation and growth strategies among key players. For example, the acquisition of [Company A] by [Company B] in [Year] significantly altered market dynamics by expanding [Company B]'s product portfolio and geographical reach.
Regulatory frameworks, particularly concerning data privacy and security in agriculture, are becoming increasingly important and impact market growth. The presence of substitute technologies, such as traditional farming methods, poses a challenge to market expansion, though the increasing adoption of data-driven approaches gradually undermines their relevance. End-user trends, like the growing demand for precision agriculture and sustainable farming practices, are driving the demand for sophisticated AG analytics solutions.
AG Analytics Market Industry Trends & Insights
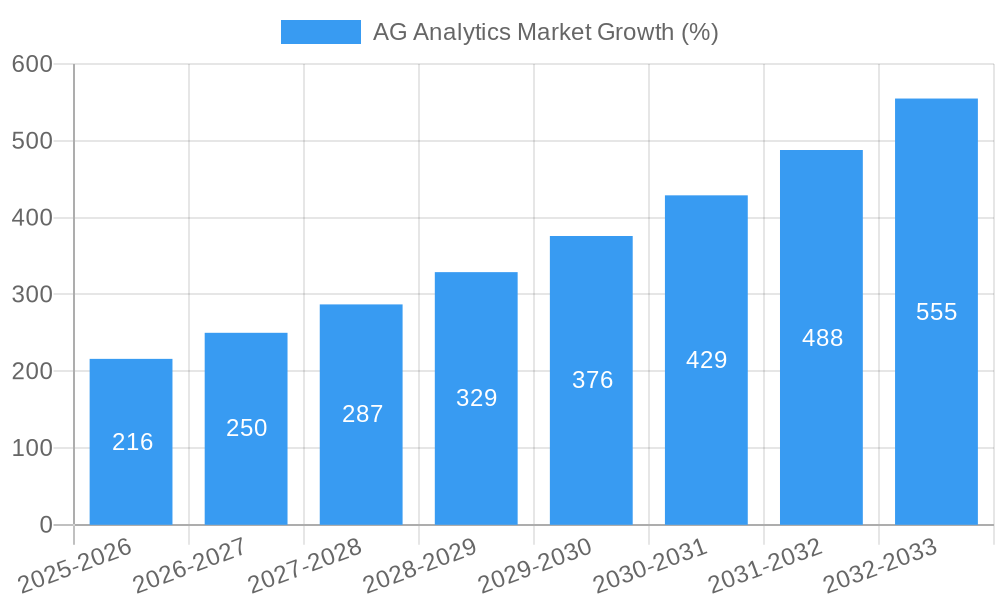
The global AG Analytics market is experiencing robust growth, projected to reach xx Million by 2033, exhibiting a Compound Annual Growth Rate (CAGR) of xx% during the forecast period (2025-2033). This growth is fueled by several key factors, including increasing adoption of precision agriculture techniques by farmers of all sizes, the rising need for enhanced resource management (water, fertilizers, pesticides), and the expanding accessibility of affordable sensor technologies and cloud computing platforms.
Technological advancements, such as the integration of AI and machine learning (ML) algorithms in AG analytics platforms, are revolutionizing data analysis, enabling more accurate predictions and insights. This leads to improved decision-making, optimized resource allocation, and increased farm productivity. Furthermore, consumer preferences are shifting towards sustainably produced food, thereby driving demand for solutions that enhance resource efficiency and reduce environmental impact. The competitive landscape is dynamic, with both established players and new entrants vying for market share through product innovation and strategic partnerships. Market penetration of AG analytics solutions is still relatively low in some regions, suggesting significant untapped potential for growth in the coming years.
Dominant Markets & Segments in AG Analytics Market
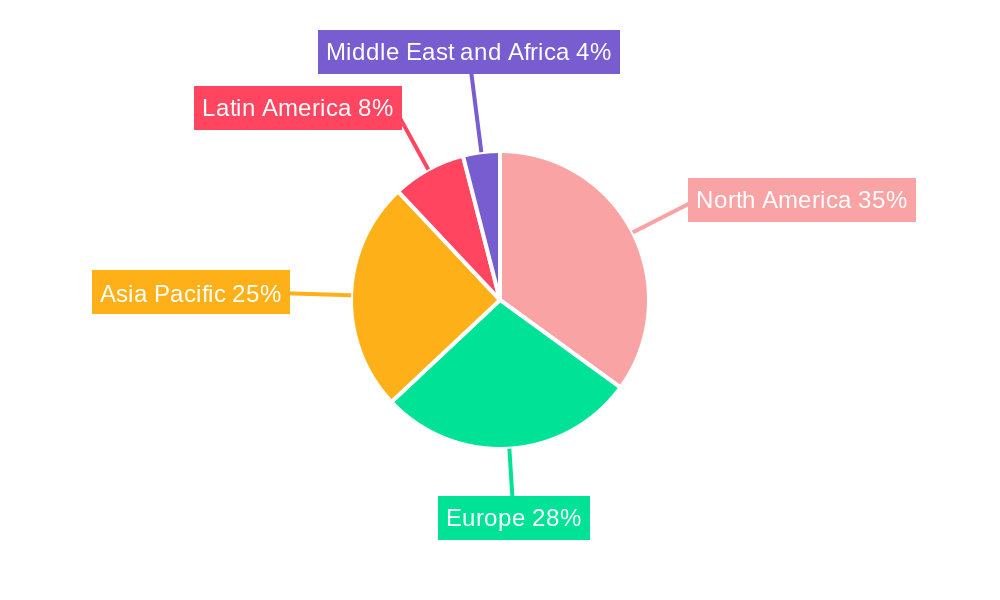
North America currently dominates the AG Analytics market, driven by factors such as high technology adoption rates, well-established agricultural infrastructure, and supportive government policies. Within the market segmentation:
- Deployment Type: Cloud-based solutions are witnessing faster growth than on-premise deployments due to scalability and cost-effectiveness.
- Farm Size: Large farms are currently the primary adopters of AG analytics due to higher investment capacity and the potential for significant return on investment (ROI). However, the market for small and medium farms is expanding rapidly as technology becomes more affordable and accessible.
- Component Type: Solutions (software and hardware platforms) currently hold a larger market share compared to services (consulting and implementation), but the services segment is showing promising growth potential.
- Type: Farm analytics currently constitutes a larger market segment compared to livestock analytics, but livestock analytics is expected to witness significant growth due to the increasing focus on animal welfare and efficiency improvements in animal husbandry.
The dominance of North America is primarily attributed to early technology adoption, strong agricultural research infrastructure, and the presence of major technology providers. However, other regions, particularly Europe and Asia-Pacific, are witnessing increasing adoption rates, propelled by government initiatives, rising farm income levels, and growing awareness of the benefits of precision agriculture.
AG Analytics Market Product Developments
Recent product innovations include the development of more sophisticated AI-powered analytics platforms that offer predictive capabilities, personalized recommendations, and integration with various farm management systems. New applications are emerging, focusing on areas such as disease prediction, yield optimization, and environmental monitoring. The key competitive advantages lie in the accuracy and reliability of analytical insights, the user-friendliness of the platforms, and the integration with existing farm operations. Technological trends favor cloud-based, scalable solutions with strong data security features.
Report Scope & Segmentation Analysis
This report segments the AG Analytics market based on deployment type (on-premise, cloud), farm size (small and medium farms, large farms), component type (solutions, services), and type (farm analytics, livestock analytics). Each segment's growth projections, market sizes, and competitive dynamics are analyzed in detail. For instance, the cloud-based segment is expected to grow at a faster rate due to its scalability and accessibility, while the solutions segment is anticipated to maintain a larger market share compared to services in the near term. Similarly, large farms are currently dominating the market, but the small and medium farms segment is expected to grow at a faster pace, driven by increasing technology adoption and affordability.
Key Drivers of AG Analytics Market Growth
Several factors drive the growth of the AG Analytics market. Technological advancements, particularly in AI and IoT, enable more accurate data collection and analysis, leading to enhanced efficiency and decision-making. Economic incentives, such as government subsidies and grants, encourage farmers to adopt advanced technologies. Stringent environmental regulations also push the adoption of sustainable farming practices, which heavily rely on data-driven insights. For example, the European Union's Common Agricultural Policy promotes precision farming through various financial schemes.
Challenges in the AG Analytics Market Sector
The AG Analytics market faces challenges such as the high initial investment costs associated with implementing AG analytics systems, the need for reliable internet connectivity in rural areas, and the complexity of integrating various data sources from disparate farm management systems. Data security and privacy concerns also pose significant obstacles to wider adoption. The lack of skilled workforce capable of implementing and interpreting the complex analytics can also hinder market growth. These factors can collectively limit the market penetration rate, especially in developing economies.
Emerging Opportunities in AG Analytics Market
Emerging opportunities lie in the development of AI-powered solutions for crop disease prediction and pest management. Expanding into new markets, such as developing economies with large agricultural sectors and limited access to advanced technologies, presents substantial opportunities. The integration of AG analytics with blockchain technology can improve data security and transparency. The development of more user-friendly platforms tailored to small and medium farmers can unlock significant untapped market potential.
Leading Players in the AG Analytics Market Market
- SAS Institute Inc
- Ageagle Aerial Systems Inc
- Deere & Company
- Bayer AG
- IBM Corporation
- Conservis Corporation
- PrecisionHawk Inc
- Trimble Inc
- Vistex Inc
- Iteris Inc
- Agrivi
Key Developments in AG Analytics Market Industry
- Jan 2023: Company A launched a new AI-powered platform for crop yield prediction.
- May 2022: Company B acquired Company C, expanding its market reach and product portfolio.
- Oct 2021: New regulations on data privacy in the agricultural sector were implemented in [country].
- Feb 2020: A major technological breakthrough in sensor technology improved data accuracy.
(Note: Further specific development details would need to be added based on actual market events.)
Strategic Outlook for AG Analytics Market Market
The AG Analytics market is poised for substantial growth, driven by continued technological advancements, increasing demand for precision agriculture, and supportive government policies. The market presents attractive opportunities for both established players and new entrants. Strategic partnerships, product innovation, and a focus on user experience will be critical for success in this competitive yet rapidly expanding market. The focus on sustainability and data security will also play a crucial role in driving future growth.
AG Analytics Market Segmentation
-
1. Component Type
- 1.1. Solutions
- 1.2. Services
-
2. Type
- 2.1. Farm Analytics
- 2.2. Livestock Analytics
-
3. Deployment Type
- 3.1. On-Premise
- 3.2. Cloud
-
4. Farm Size
- 4.1. Small and Medium Farms
- 4.2. Large Farms
AG Analytics Market Segmentation By Geography
- 1. North America
- 2. Europe
- 3. Asia Pacific
- 4. Latin America
- 5. Middle East and Africa
AG Analytics Market REPORT HIGHLIGHTS
| Aspects | Details |
|---|---|
| Study Period | 2019-2033 |
| Base Year | 2024 |
| Estimated Year | 2025 |
| Forecast Period | 2025-2033 |
| Historical Period | 2019-2024 |
| Growth Rate | CAGR of 14.40% from 2019-2033 |
| Segmentation |
|
Table of Contents
- 1. Introduction
- 1.1. Research Scope
- 1.2. Market Segmentation
- 1.3. Research Methodology
- 1.4. Definitions and Assumptions
- 2. Executive Summary
- 2.1. Introduction
- 3. Market Dynamics
- 3.1. Introduction
- 3.2. Market Drivers
- 3.2.1. ; Rising Usage of Cutting-edge Technology-based Solutions for Farming
- 3.3. Market Restrains
- 3.3.1. ; High Capital Cost and Complexity Regarding System Upgrades
- 3.4. Market Trends
- 3.4.1. Farm Analytics is Expected to Grow at a Significant Rate Over the Forecast Period
- 4. Market Factor Analysis
- 4.1. Porters Five Forces
- 4.2. Supply/Value Chain
- 4.3. PESTEL analysis
- 4.4. Market Entropy
- 4.5. Patent/Trademark Analysis
- 5. Global AG Analytics Market Analysis, Insights and Forecast, 2019-2031
- 5.1. Market Analysis, Insights and Forecast - by Component Type
- 5.1.1. Solutions
- 5.1.2. Services
- 5.2. Market Analysis, Insights and Forecast - by Type
- 5.2.1. Farm Analytics
- 5.2.2. Livestock Analytics
- 5.3. Market Analysis, Insights and Forecast - by Deployment Type
- 5.3.1. On-Premise
- 5.3.2. Cloud
- 5.4. Market Analysis, Insights and Forecast - by Farm Size
- 5.4.1. Small and Medium Farms
- 5.4.2. Large Farms
- 5.5. Market Analysis, Insights and Forecast - by Region
- 5.5.1. North America
- 5.5.2. Europe
- 5.5.3. Asia Pacific
- 5.5.4. Latin America
- 5.5.5. Middle East and Africa
- 5.1. Market Analysis, Insights and Forecast - by Component Type
- 6. North America AG Analytics Market Analysis, Insights and Forecast, 2019-2031
- 6.1. Market Analysis, Insights and Forecast - by Component Type
- 6.1.1. Solutions
- 6.1.2. Services
- 6.2. Market Analysis, Insights and Forecast - by Type
- 6.2.1. Farm Analytics
- 6.2.2. Livestock Analytics
- 6.3. Market Analysis, Insights and Forecast - by Deployment Type
- 6.3.1. On-Premise
- 6.3.2. Cloud
- 6.4. Market Analysis, Insights and Forecast - by Farm Size
- 6.4.1. Small and Medium Farms
- 6.4.2. Large Farms
- 6.1. Market Analysis, Insights and Forecast - by Component Type
- 7. Europe AG Analytics Market Analysis, Insights and Forecast, 2019-2031
- 7.1. Market Analysis, Insights and Forecast - by Component Type
- 7.1.1. Solutions
- 7.1.2. Services
- 7.2. Market Analysis, Insights and Forecast - by Type
- 7.2.1. Farm Analytics
- 7.2.2. Livestock Analytics
- 7.3. Market Analysis, Insights and Forecast - by Deployment Type
- 7.3.1. On-Premise
- 7.3.2. Cloud
- 7.4. Market Analysis, Insights and Forecast - by Farm Size
- 7.4.1. Small and Medium Farms
- 7.4.2. Large Farms
- 7.1. Market Analysis, Insights and Forecast - by Component Type
- 8. Asia Pacific AG Analytics Market Analysis, Insights and Forecast, 2019-2031
- 8.1. Market Analysis, Insights and Forecast - by Component Type
- 8.1.1. Solutions
- 8.1.2. Services
- 8.2. Market Analysis, Insights and Forecast - by Type
- 8.2.1. Farm Analytics
- 8.2.2. Livestock Analytics
- 8.3. Market Analysis, Insights and Forecast - by Deployment Type
- 8.3.1. On-Premise
- 8.3.2. Cloud
- 8.4. Market Analysis, Insights and Forecast - by Farm Size
- 8.4.1. Small and Medium Farms
- 8.4.2. Large Farms
- 8.1. Market Analysis, Insights and Forecast - by Component Type
- 9. Latin America AG Analytics Market Analysis, Insights and Forecast, 2019-2031
- 9.1. Market Analysis, Insights and Forecast - by Component Type
- 9.1.1. Solutions
- 9.1.2. Services
- 9.2. Market Analysis, Insights and Forecast - by Type
- 9.2.1. Farm Analytics
- 9.2.2. Livestock Analytics
- 9.3. Market Analysis, Insights and Forecast - by Deployment Type
- 9.3.1. On-Premise
- 9.3.2. Cloud
- 9.4. Market Analysis, Insights and Forecast - by Farm Size
- 9.4.1. Small and Medium Farms
- 9.4.2. Large Farms
- 9.1. Market Analysis, Insights and Forecast - by Component Type
- 10. Middle East and Africa AG Analytics Market Analysis, Insights and Forecast, 2019-2031
- 10.1. Market Analysis, Insights and Forecast - by Component Type
- 10.1.1. Solutions
- 10.1.2. Services
- 10.2. Market Analysis, Insights and Forecast - by Type
- 10.2.1. Farm Analytics
- 10.2.2. Livestock Analytics
- 10.3. Market Analysis, Insights and Forecast - by Deployment Type
- 10.3.1. On-Premise
- 10.3.2. Cloud
- 10.4. Market Analysis, Insights and Forecast - by Farm Size
- 10.4.1. Small and Medium Farms
- 10.4.2. Large Farms
- 10.1. Market Analysis, Insights and Forecast - by Component Type
- 11. North America AG Analytics Market Analysis, Insights and Forecast, 2019-2031
- 11.1. Market Analysis, Insights and Forecast - By Country/Sub-region
- 11.1.1.
- 12. Europe AG Analytics Market Analysis, Insights and Forecast, 2019-2031
- 12.1. Market Analysis, Insights and Forecast - By Country/Sub-region
- 12.1.1.
- 13. Asia Pacific AG Analytics Market Analysis, Insights and Forecast, 2019-2031
- 13.1. Market Analysis, Insights and Forecast - By Country/Sub-region
- 13.1.1.
- 14. Latin America AG Analytics Market Analysis, Insights and Forecast, 2019-2031
- 14.1. Market Analysis, Insights and Forecast - By Country/Sub-region
- 14.1.1.
- 15. Middle East and Africa AG Analytics Market Analysis, Insights and Forecast, 2019-2031
- 15.1. Market Analysis, Insights and Forecast - By Country/Sub-region
- 15.1.1.
- 16. Competitive Analysis
- 16.1. Global Market Share Analysis 2024
- 16.2. Company Profiles
- 16.2.1 SAS Institute Inc *List Not Exhaustive
- 16.2.1.1. Overview
- 16.2.1.2. Products
- 16.2.1.3. SWOT Analysis
- 16.2.1.4. Recent Developments
- 16.2.1.5. Financials (Based on Availability)
- 16.2.2 Ageagle Aerial Systems Inc
- 16.2.2.1. Overview
- 16.2.2.2. Products
- 16.2.2.3. SWOT Analysis
- 16.2.2.4. Recent Developments
- 16.2.2.5. Financials (Based on Availability)
- 16.2.3 Deere & Company
- 16.2.3.1. Overview
- 16.2.3.2. Products
- 16.2.3.3. SWOT Analysis
- 16.2.3.4. Recent Developments
- 16.2.3.5. Financials (Based on Availability)
- 16.2.4 Bayer AG
- 16.2.4.1. Overview
- 16.2.4.2. Products
- 16.2.4.3. SWOT Analysis
- 16.2.4.4. Recent Developments
- 16.2.4.5. Financials (Based on Availability)
- 16.2.5 IBM Corporation
- 16.2.5.1. Overview
- 16.2.5.2. Products
- 16.2.5.3. SWOT Analysis
- 16.2.5.4. Recent Developments
- 16.2.5.5. Financials (Based on Availability)
- 16.2.6 Conservis Corporation
- 16.2.6.1. Overview
- 16.2.6.2. Products
- 16.2.6.3. SWOT Analysis
- 16.2.6.4. Recent Developments
- 16.2.6.5. Financials (Based on Availability)
- 16.2.7 PrecisionHawk Inc
- 16.2.7.1. Overview
- 16.2.7.2. Products
- 16.2.7.3. SWOT Analysis
- 16.2.7.4. Recent Developments
- 16.2.7.5. Financials (Based on Availability)
- 16.2.8 Trimble Inc
- 16.2.8.1. Overview
- 16.2.8.2. Products
- 16.2.8.3. SWOT Analysis
- 16.2.8.4. Recent Developments
- 16.2.8.5. Financials (Based on Availability)
- 16.2.9 Vistex Inc
- 16.2.9.1. Overview
- 16.2.9.2. Products
- 16.2.9.3. SWOT Analysis
- 16.2.9.4. Recent Developments
- 16.2.9.5. Financials (Based on Availability)
- 16.2.10 Iteris Inc
- 16.2.10.1. Overview
- 16.2.10.2. Products
- 16.2.10.3. SWOT Analysis
- 16.2.10.4. Recent Developments
- 16.2.10.5. Financials (Based on Availability)
- 16.2.11 Agrivi
- 16.2.11.1. Overview
- 16.2.11.2. Products
- 16.2.11.3. SWOT Analysis
- 16.2.11.4. Recent Developments
- 16.2.11.5. Financials (Based on Availability)
- 16.2.1 SAS Institute Inc *List Not Exhaustive
List of Figures
- Figure 1: Global AG Analytics Market Revenue Breakdown (Million, %) by Region 2024 & 2032
- Figure 2: North America AG Analytics Market Revenue (Million), by Country 2024 & 2032
- Figure 3: North America AG Analytics Market Revenue Share (%), by Country 2024 & 2032
- Figure 4: Europe AG Analytics Market Revenue (Million), by Country 2024 & 2032
- Figure 5: Europe AG Analytics Market Revenue Share (%), by Country 2024 & 2032
- Figure 6: Asia Pacific AG Analytics Market Revenue (Million), by Country 2024 & 2032
- Figure 7: Asia Pacific AG Analytics Market Revenue Share (%), by Country 2024 & 2032
- Figure 8: Latin America AG Analytics Market Revenue (Million), by Country 2024 & 2032
- Figure 9: Latin America AG Analytics Market Revenue Share (%), by Country 2024 & 2032
- Figure 10: Middle East and Africa AG Analytics Market Revenue (Million), by Country 2024 & 2032
- Figure 11: Middle East and Africa AG Analytics Market Revenue Share (%), by Country 2024 & 2032
- Figure 12: North America AG Analytics Market Revenue (Million), by Component Type 2024 & 2032
- Figure 13: North America AG Analytics Market Revenue Share (%), by Component Type 2024 & 2032
- Figure 14: North America AG Analytics Market Revenue (Million), by Type 2024 & 2032
- Figure 15: North America AG Analytics Market Revenue Share (%), by Type 2024 & 2032
- Figure 16: North America AG Analytics Market Revenue (Million), by Deployment Type 2024 & 2032
- Figure 17: North America AG Analytics Market Revenue Share (%), by Deployment Type 2024 & 2032
- Figure 18: North America AG Analytics Market Revenue (Million), by Farm Size 2024 & 2032
- Figure 19: North America AG Analytics Market Revenue Share (%), by Farm Size 2024 & 2032
- Figure 20: North America AG Analytics Market Revenue (Million), by Country 2024 & 2032
- Figure 21: North America AG Analytics Market Revenue Share (%), by Country 2024 & 2032
- Figure 22: Europe AG Analytics Market Revenue (Million), by Component Type 2024 & 2032
- Figure 23: Europe AG Analytics Market Revenue Share (%), by Component Type 2024 & 2032
- Figure 24: Europe AG Analytics Market Revenue (Million), by Type 2024 & 2032
- Figure 25: Europe AG Analytics Market Revenue Share (%), by Type 2024 & 2032
- Figure 26: Europe AG Analytics Market Revenue (Million), by Deployment Type 2024 & 2032
- Figure 27: Europe AG Analytics Market Revenue Share (%), by Deployment Type 2024 & 2032
- Figure 28: Europe AG Analytics Market Revenue (Million), by Farm Size 2024 & 2032
- Figure 29: Europe AG Analytics Market Revenue Share (%), by Farm Size 2024 & 2032
- Figure 30: Europe AG Analytics Market Revenue (Million), by Country 2024 & 2032
- Figure 31: Europe AG Analytics Market Revenue Share (%), by Country 2024 & 2032
- Figure 32: Asia Pacific AG Analytics Market Revenue (Million), by Component Type 2024 & 2032
- Figure 33: Asia Pacific AG Analytics Market Revenue Share (%), by Component Type 2024 & 2032
- Figure 34: Asia Pacific AG Analytics Market Revenue (Million), by Type 2024 & 2032
- Figure 35: Asia Pacific AG Analytics Market Revenue Share (%), by Type 2024 & 2032
- Figure 36: Asia Pacific AG Analytics Market Revenue (Million), by Deployment Type 2024 & 2032
- Figure 37: Asia Pacific AG Analytics Market Revenue Share (%), by Deployment Type 2024 & 2032
- Figure 38: Asia Pacific AG Analytics Market Revenue (Million), by Farm Size 2024 & 2032
- Figure 39: Asia Pacific AG Analytics Market Revenue Share (%), by Farm Size 2024 & 2032
- Figure 40: Asia Pacific AG Analytics Market Revenue (Million), by Country 2024 & 2032
- Figure 41: Asia Pacific AG Analytics Market Revenue Share (%), by Country 2024 & 2032
- Figure 42: Latin America AG Analytics Market Revenue (Million), by Component Type 2024 & 2032
- Figure 43: Latin America AG Analytics Market Revenue Share (%), by Component Type 2024 & 2032
- Figure 44: Latin America AG Analytics Market Revenue (Million), by Type 2024 & 2032
- Figure 45: Latin America AG Analytics Market Revenue Share (%), by Type 2024 & 2032
- Figure 46: Latin America AG Analytics Market Revenue (Million), by Deployment Type 2024 & 2032
- Figure 47: Latin America AG Analytics Market Revenue Share (%), by Deployment Type 2024 & 2032
- Figure 48: Latin America AG Analytics Market Revenue (Million), by Farm Size 2024 & 2032
- Figure 49: Latin America AG Analytics Market Revenue Share (%), by Farm Size 2024 & 2032
- Figure 50: Latin America AG Analytics Market Revenue (Million), by Country 2024 & 2032
- Figure 51: Latin America AG Analytics Market Revenue Share (%), by Country 2024 & 2032
- Figure 52: Middle East and Africa AG Analytics Market Revenue (Million), by Component Type 2024 & 2032
- Figure 53: Middle East and Africa AG Analytics Market Revenue Share (%), by Component Type 2024 & 2032
- Figure 54: Middle East and Africa AG Analytics Market Revenue (Million), by Type 2024 & 2032
- Figure 55: Middle East and Africa AG Analytics Market Revenue Share (%), by Type 2024 & 2032
- Figure 56: Middle East and Africa AG Analytics Market Revenue (Million), by Deployment Type 2024 & 2032
- Figure 57: Middle East and Africa AG Analytics Market Revenue Share (%), by Deployment Type 2024 & 2032
- Figure 58: Middle East and Africa AG Analytics Market Revenue (Million), by Farm Size 2024 & 2032
- Figure 59: Middle East and Africa AG Analytics Market Revenue Share (%), by Farm Size 2024 & 2032
- Figure 60: Middle East and Africa AG Analytics Market Revenue (Million), by Country 2024 & 2032
- Figure 61: Middle East and Africa AG Analytics Market Revenue Share (%), by Country 2024 & 2032
List of Tables
- Table 1: Global AG Analytics Market Revenue Million Forecast, by Region 2019 & 2032
- Table 2: Global AG Analytics Market Revenue Million Forecast, by Component Type 2019 & 2032
- Table 3: Global AG Analytics Market Revenue Million Forecast, by Type 2019 & 2032
- Table 4: Global AG Analytics Market Revenue Million Forecast, by Deployment Type 2019 & 2032
- Table 5: Global AG Analytics Market Revenue Million Forecast, by Farm Size 2019 & 2032
- Table 6: Global AG Analytics Market Revenue Million Forecast, by Region 2019 & 2032
- Table 7: Global AG Analytics Market Revenue Million Forecast, by Country 2019 & 2032
- Table 8: AG Analytics Market Revenue (Million) Forecast, by Application 2019 & 2032
- Table 9: Global AG Analytics Market Revenue Million Forecast, by Country 2019 & 2032
- Table 10: AG Analytics Market Revenue (Million) Forecast, by Application 2019 & 2032
- Table 11: Global AG Analytics Market Revenue Million Forecast, by Country 2019 & 2032
- Table 12: AG Analytics Market Revenue (Million) Forecast, by Application 2019 & 2032
- Table 13: Global AG Analytics Market Revenue Million Forecast, by Country 2019 & 2032
- Table 14: AG Analytics Market Revenue (Million) Forecast, by Application 2019 & 2032
- Table 15: Global AG Analytics Market Revenue Million Forecast, by Country 2019 & 2032
- Table 16: AG Analytics Market Revenue (Million) Forecast, by Application 2019 & 2032
- Table 17: Global AG Analytics Market Revenue Million Forecast, by Component Type 2019 & 2032
- Table 18: Global AG Analytics Market Revenue Million Forecast, by Type 2019 & 2032
- Table 19: Global AG Analytics Market Revenue Million Forecast, by Deployment Type 2019 & 2032
- Table 20: Global AG Analytics Market Revenue Million Forecast, by Farm Size 2019 & 2032
- Table 21: Global AG Analytics Market Revenue Million Forecast, by Country 2019 & 2032
- Table 22: Global AG Analytics Market Revenue Million Forecast, by Component Type 2019 & 2032
- Table 23: Global AG Analytics Market Revenue Million Forecast, by Type 2019 & 2032
- Table 24: Global AG Analytics Market Revenue Million Forecast, by Deployment Type 2019 & 2032
- Table 25: Global AG Analytics Market Revenue Million Forecast, by Farm Size 2019 & 2032
- Table 26: Global AG Analytics Market Revenue Million Forecast, by Country 2019 & 2032
- Table 27: Global AG Analytics Market Revenue Million Forecast, by Component Type 2019 & 2032
- Table 28: Global AG Analytics Market Revenue Million Forecast, by Type 2019 & 2032
- Table 29: Global AG Analytics Market Revenue Million Forecast, by Deployment Type 2019 & 2032
- Table 30: Global AG Analytics Market Revenue Million Forecast, by Farm Size 2019 & 2032
- Table 31: Global AG Analytics Market Revenue Million Forecast, by Country 2019 & 2032
- Table 32: Global AG Analytics Market Revenue Million Forecast, by Component Type 2019 & 2032
- Table 33: Global AG Analytics Market Revenue Million Forecast, by Type 2019 & 2032
- Table 34: Global AG Analytics Market Revenue Million Forecast, by Deployment Type 2019 & 2032
- Table 35: Global AG Analytics Market Revenue Million Forecast, by Farm Size 2019 & 2032
- Table 36: Global AG Analytics Market Revenue Million Forecast, by Country 2019 & 2032
- Table 37: Global AG Analytics Market Revenue Million Forecast, by Component Type 2019 & 2032
- Table 38: Global AG Analytics Market Revenue Million Forecast, by Type 2019 & 2032
- Table 39: Global AG Analytics Market Revenue Million Forecast, by Deployment Type 2019 & 2032
- Table 40: Global AG Analytics Market Revenue Million Forecast, by Farm Size 2019 & 2032
- Table 41: Global AG Analytics Market Revenue Million Forecast, by Country 2019 & 2032
Frequently Asked Questions
1. What is the projected Compound Annual Growth Rate (CAGR) of the AG Analytics Market?
The projected CAGR is approximately 14.40%.
2. Which companies are prominent players in the AG Analytics Market?
Key companies in the market include SAS Institute Inc *List Not Exhaustive, Ageagle Aerial Systems Inc, Deere & Company, Bayer AG, IBM Corporation, Conservis Corporation, PrecisionHawk Inc, Trimble Inc, Vistex Inc, Iteris Inc, Agrivi.
3. What are the main segments of the AG Analytics Market?
The market segments include Component Type, Type, Deployment Type, Farm Size.
4. Can you provide details about the market size?
The market size is estimated to be USD XX Million as of 2022.
5. What are some drivers contributing to market growth?
; Rising Usage of Cutting-edge Technology-based Solutions for Farming.
6. What are the notable trends driving market growth?
Farm Analytics is Expected to Grow at a Significant Rate Over the Forecast Period.
7. Are there any restraints impacting market growth?
; High Capital Cost and Complexity Regarding System Upgrades.
8. Can you provide examples of recent developments in the market?
N/A
9. What pricing options are available for accessing the report?
Pricing options include single-user, multi-user, and enterprise licenses priced at USD 4750, USD 5250, and USD 8750 respectively.
10. Is the market size provided in terms of value or volume?
The market size is provided in terms of value, measured in Million.
11. Are there any specific market keywords associated with the report?
Yes, the market keyword associated with the report is "AG Analytics Market," which aids in identifying and referencing the specific market segment covered.
12. How do I determine which pricing option suits my needs best?
The pricing options vary based on user requirements and access needs. Individual users may opt for single-user licenses, while businesses requiring broader access may choose multi-user or enterprise licenses for cost-effective access to the report.
13. Are there any additional resources or data provided in the AG Analytics Market report?
While the report offers comprehensive insights, it's advisable to review the specific contents or supplementary materials provided to ascertain if additional resources or data are available.
14. How can I stay updated on further developments or reports in the AG Analytics Market?
To stay informed about further developments, trends, and reports in the AG Analytics Market, consider subscribing to industry newsletters, following relevant companies and organizations, or regularly checking reputable industry news sources and publications.
Methodology
Step 1 - Identification of Relevant Samples Size from Population Database


Step 2 - Approaches for Defining Global Market Size (Value, Volume* & Price*)

Note*: In applicable scenarios
Step 3 - Data Sources
Primary Research
- Web Analytics
- Survey Reports
- Research Institute
- Latest Research Reports
- Opinion Leaders
Secondary Research
- Annual Reports
- White Paper
- Latest Press Release
- Industry Association
- Paid Database
- Investor Presentations

Step 4 - Data Triangulation
Involves using different sources of information in order to increase the validity of a study
These sources are likely to be stakeholders in a program - participants, other researchers, program staff, other community members, and so on.
Then we put all data in single framework & apply various statistical tools to find out the dynamic on the market.
During the analysis stage, feedback from the stakeholder groups would be compared to determine areas of agreement as well as areas of divergence


