
Key Insights
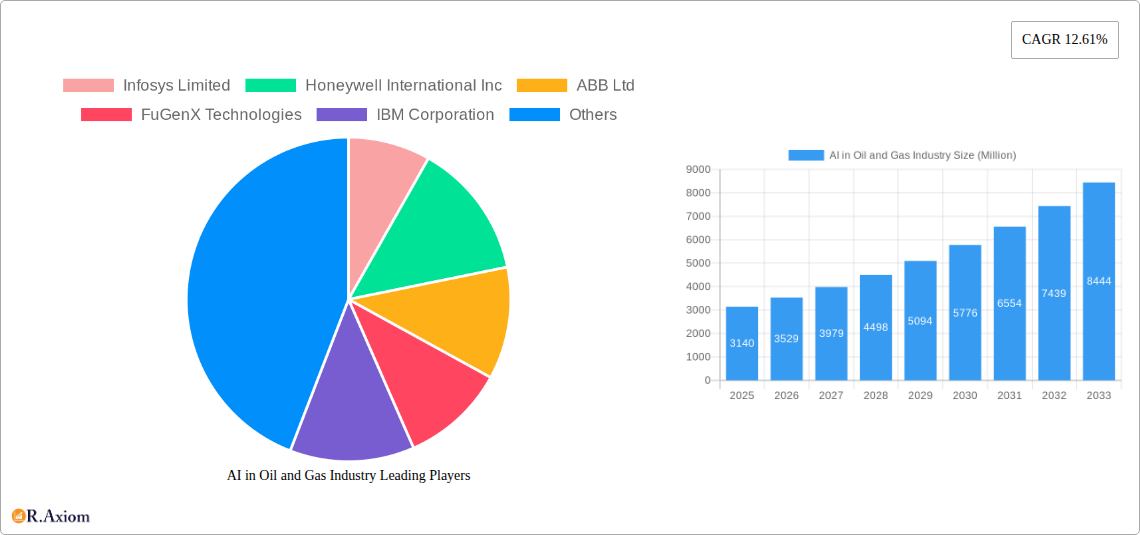
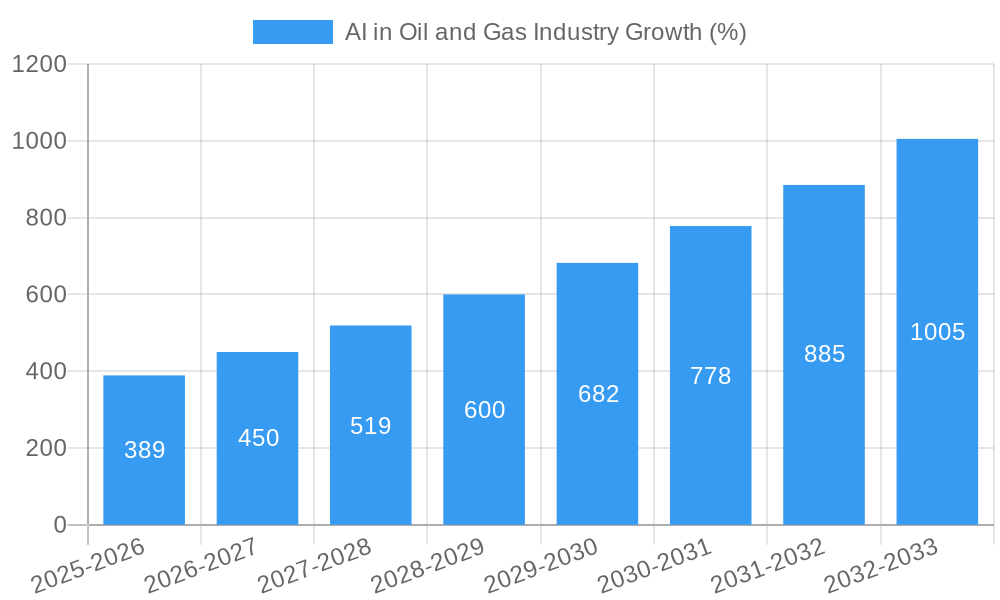
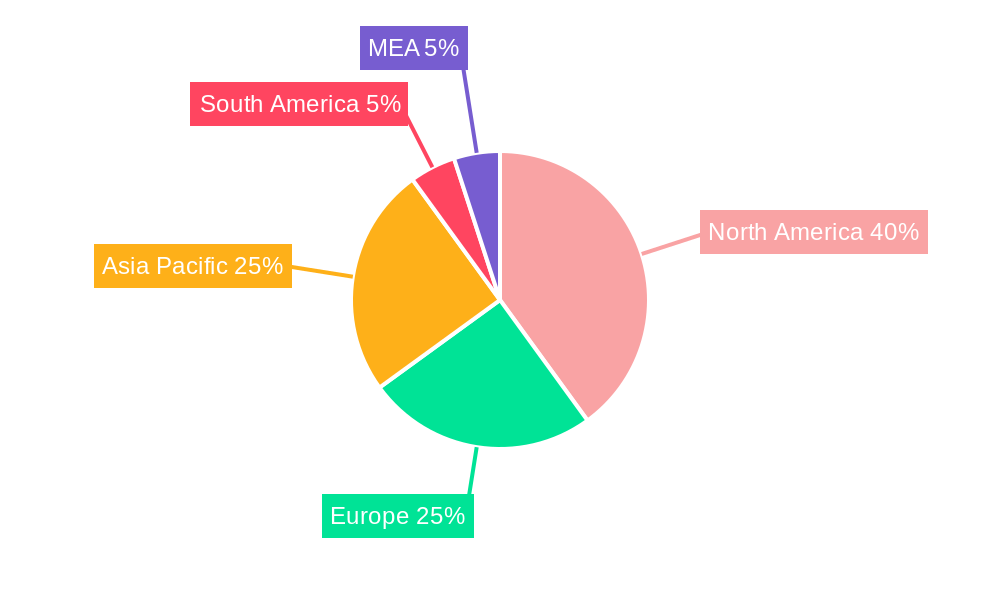
The AI in Oil and Gas market is experiencing robust growth, projected to reach $3.14 billion in 2025 and maintain a Compound Annual Growth Rate (CAGR) of 12.61% from 2025 to 2033. This expansion is driven by several key factors. The industry's inherent need for enhanced efficiency and safety is fueling the adoption of AI-powered solutions across upstream, midstream, and downstream operations. AI algorithms excel at analyzing vast datasets from various sources, including sensors, satellites, and historical production data, enabling predictive maintenance, optimized drilling strategies, and improved reservoir management. Furthermore, the increasing complexity of oil and gas extraction and processing necessitates advanced analytical capabilities provided by AI, leading to better resource allocation and reduced operational costs. The integration of AI in platforms and services further amplifies its impact, allowing for seamless data integration and analysis across the entire value chain. Major players like Infosys, Honeywell, ABB, and others are heavily invested in developing and deploying AI solutions, fostering innovation and competition within the market. Regional growth is expected to be strongest in North America and Asia Pacific, driven by technological advancements and substantial investments in digital transformation initiatives.
The market segmentation, categorized by operation (upstream, midstream, downstream) and type (platform, services), reveals distinct growth patterns. Upstream operations, involving exploration and production, are likely to see the highest adoption of AI due to its potential for optimizing resource extraction and reducing environmental impact. Similarly, the services segment, encompassing consulting, implementation, and support services, is anticipated to experience significant growth owing to the increasing demand for expertise in AI integration. Growth will be further propelled by government initiatives promoting digitalization in the energy sector and the increasing availability of affordable, high-performance computing resources that are essential for running sophisticated AI models. Restraints, however, include the need for robust cybersecurity measures to protect sensitive data and the initial high investment costs associated with AI implementation, although these are being offset by the long-term cost savings and improved efficiency.
AI in Oil & Gas Industry: A Comprehensive Market Report (2019-2033)
This comprehensive report provides an in-depth analysis of the AI in Oil and Gas Industry market, offering valuable insights for stakeholders, investors, and industry professionals. With a study period spanning 2019-2033, a base year of 2025, and a forecast period of 2025-2033, this report meticulously examines market trends, technological advancements, competitive dynamics, and future growth prospects. The market is segmented by operation (Upstream, Midstream, Downstream) and by type (Platform, Services). The report projects a market value of xx Million by 2033, exhibiting a robust CAGR of xx% during the forecast period.
AI in Oil and Gas Industry Market Concentration & Innovation
The AI in Oil and Gas market is characterized by a moderately concentrated landscape, with a few major players holding significant market share. However, a growing number of smaller, specialized companies are driving innovation through the development of niche AI solutions. Market share data for 2024 indicates that the top 5 players account for approximately xx% of the total market revenue (estimated at xx Million). Mergers and acquisitions (M&A) activity has been significant, with deal values exceeding xx Million in the past five years. These M&A activities are primarily driven by the need to acquire cutting-edge technologies and expand market reach. The regulatory landscape is evolving, with increasing emphasis on data privacy and cybersecurity, posing both challenges and opportunities for market participants. The substitution of traditional methods with AI-driven solutions is accelerating, fueled by advancements in machine learning and deep learning algorithms. End-user trends point towards a growing preference for cloud-based AI platforms and integrated solutions that streamline operations across the entire oil and gas value chain.
- Key Market Concentration Metrics (2024):
- Top 5 Players Market Share: xx%
- Total Market Revenue: xx Million
- Average M&A Deal Value: xx Million
AI in Oil and Gas Industry Industry Trends & Insights
The AI in Oil and Gas industry is experiencing rapid growth, driven by several factors. The increasing need for enhanced efficiency and cost optimization across upstream, midstream, and downstream operations is a significant catalyst. Technological advancements in areas such as machine learning, deep learning, and computer vision are transforming how companies approach exploration, production, and refining. The demand for real-time data analytics and predictive maintenance is also fueling market growth. The industry is witnessing a shift towards cloud-based AI platforms, enabling greater scalability, accessibility, and collaboration. Consumer preference leans towards solutions that offer improved safety, reduced environmental impact, and enhanced operational reliability. Competitive dynamics are characterized by a blend of cooperation and competition, with strategic partnerships and collaborations becoming increasingly prevalent. The market penetration of AI solutions is steadily increasing, particularly in areas such as predictive maintenance and reservoir management. This translates to a projected Compound Annual Growth Rate (CAGR) of xx% between 2025 and 2033.
Dominant Markets & Segments in AI in Oil and Gas Industry
The North American region currently holds the dominant position in the AI in Oil and Gas market, driven by substantial investments in technology, a well-established oil and gas industry, and supportive government policies. Within the operational segments, the Upstream segment shows the highest growth potential, fueled by the increasing application of AI in exploration and production optimization. The Platform segment commands a larger market share compared to the Services segment, primarily due to the increasing adoption of comprehensive AI-powered platforms that integrate various functionalities.
Key Drivers of Regional Dominance (North America):
- High Technological Investments
- Mature Oil & Gas Infrastructure
- Supportive Government Regulations
- Abundant Data Availability
Key Drivers of Segment Dominance (Upstream & Platforms):
- Upstream: Enhanced exploration efficiency, optimized production, and improved reservoir management.
- Platforms: Comprehensive solutions, scalability, and integration capabilities.
AI in Oil and Gas Industry Product Developments
Recent product innovations include the emergence of physics-informed AI models that combine physical constraints with process data for highly accurate predictions. This reflects a broader technological trend towards creating more robust and reliable AI solutions tailored to the specific needs of the oil and gas industry. The competitive advantage lies in offering solutions with improved accuracy, efficiency, and ease of integration with existing workflows.
Report Scope & Segmentation Analysis
This report provides a comprehensive analysis of the AI in Oil and Gas market, segmented by operation (Upstream, Midstream, Downstream) and by type (Platform, Services).
By Operation:
- Upstream: This segment focuses on AI applications in exploration, drilling, and production. We project xx Million market value by 2033, with a CAGR of xx%.
- Midstream: This segment covers AI applications in transportation, storage, and processing. We project xx Million market value by 2033, with a CAGR of xx%.
- Downstream: This segment encompasses AI applications in refining, petrochemicals, and marketing. We project xx Million market value by 2033, with a CAGR of xx%.
By Type:
- Platform: This segment includes comprehensive AI platforms that integrate various functionalities. We project xx Million market value by 2033, with a CAGR of xx%.
- Services: This segment comprises consulting, implementation, and maintenance services. We project xx Million market value by 2033, with a CAGR of xx%.
Key Drivers of AI in Oil and Gas Industry Growth
The growth of the AI in Oil and Gas industry is driven by several key factors. Technological advancements, particularly in machine learning and deep learning, are enabling the development of more sophisticated and effective AI solutions. The economic imperative for improved efficiency and cost reduction is compelling companies to adopt AI technologies. Favorable regulatory environments in certain regions are also encouraging wider adoption. For example, government incentives for emission reduction are promoting the use of AI for optimizing energy consumption.
Challenges in the AI in Oil and Gas Industry Sector
Despite the growth potential, several challenges hinder the wider adoption of AI in the oil and gas industry. Regulatory hurdles related to data privacy and cybersecurity are significant. Supply chain complexities, particularly related to specialized hardware and software, can lead to delays and increased costs. Intense competition among AI providers can also create pricing pressure and affect profitability. These challenges, if not addressed effectively, could potentially reduce the market growth rate by xx% by 2033.
Emerging Opportunities in AI in Oil and Gas Industry
Emerging opportunities include the application of AI in carbon capture, utilization, and storage (CCUS), contributing to a more sustainable industry. Advancements in edge computing are improving real-time data processing at remote locations. The increasing availability of sensor data and improved connectivity are enabling the development of more comprehensive and intelligent AI solutions. These opportunities, if capitalized upon, could potentially accelerate the market growth by xx% by 2033.
Leading Players in the AI in Oil and Gas Industry Market
- Infosys Limited
- Honeywell International Inc
- ABB Ltd
- FuGenX Technologies
- IBM Corporation
- NVIDIA Corporation
- Microsoft Corporation
- Huawei Technologies Co Ltd
- C3 AI Inc
- Intel Corporation
- oPRO ai Inc
Key Developments in AI in Oil and Gas Industry Industry
March 2024: ADNOC partnered with AIQ to deploy WellInsight AI for enhanced oil production efficiency and safety at the Belbazem offshore block. This highlights the growing demand for AI-driven solutions in the industry.
January 2024: SLB partnered with Geminus AI, gaining exclusive access to a physics-informed AI model builder. This signifies a significant technological advancement in AI modeling for oil and gas applications.
Strategic Outlook for AI in Oil and Gas Industry Market
The future of the AI in Oil and Gas industry is bright, with significant growth potential driven by continuous technological advancements, increasing industry adoption, and a strong focus on efficiency and sustainability. The market is expected to witness substantial growth across all segments and regions, creating lucrative opportunities for both established players and emerging innovators. The ongoing development and deployment of innovative AI solutions will continue to reshape the oil and gas landscape, driving further growth and transformation in the years to come.
AI in Oil and Gas Industry Segmentation
-
1. Operation
- 1.1. Upstream
- 1.2. Midstream
- 1.3. Downstream
-
2. Type
- 2.1. Platform
- 2.2. Services
AI in Oil and Gas Industry Segmentation By Geography
- 1. North America
- 2. Europe
- 3. Asia
- 4. Australia and New Zealand
- 5. Latin America
- 6. Middle East and Africa
AI in Oil and Gas Industry REPORT HIGHLIGHTS
| Aspects | Details |
|---|---|
| Study Period | 2019-2033 |
| Base Year | 2024 |
| Estimated Year | 2025 |
| Forecast Period | 2025-2033 |
| Historical Period | 2019-2024 |
| Growth Rate | CAGR of 12.61% from 2019-2033 |
| Segmentation |
|
Table of Contents
- 1. Introduction
- 1.1. Research Scope
- 1.2. Market Segmentation
- 1.3. Research Methodology
- 1.4. Definitions and Assumptions
- 2. Executive Summary
- 2.1. Introduction
- 3. Market Dynamics
- 3.1. Introduction
- 3.2. Market Drivers
- 3.2.1. Increasing Focus to Easily Process Big Data; Rising Trend to Reduce Production Cost
- 3.3. Market Restrains
- 3.3.1. Initial High Cost of Adoption; Lack of Skilled Professionals in the Oil and Gas Industry
- 3.4. Market Trends
- 3.4.1. Upstream Operations Segment Expected to Witness Significant Growth
- 4. Market Factor Analysis
- 4.1. Porters Five Forces
- 4.2. Supply/Value Chain
- 4.3. PESTEL analysis
- 4.4. Market Entropy
- 4.5. Patent/Trademark Analysis
- 5. Global AI in Oil and Gas Industry Analysis, Insights and Forecast, 2019-2031
- 5.1. Market Analysis, Insights and Forecast - by Operation
- 5.1.1. Upstream
- 5.1.2. Midstream
- 5.1.3. Downstream
- 5.2. Market Analysis, Insights and Forecast - by Type
- 5.2.1. Platform
- 5.2.2. Services
- 5.3. Market Analysis, Insights and Forecast - by Region
- 5.3.1. North America
- 5.3.2. Europe
- 5.3.3. Asia
- 5.3.4. Australia and New Zealand
- 5.3.5. Latin America
- 5.3.6. Middle East and Africa
- 5.1. Market Analysis, Insights and Forecast - by Operation
- 6. North America AI in Oil and Gas Industry Analysis, Insights and Forecast, 2019-2031
- 6.1. Market Analysis, Insights and Forecast - by Operation
- 6.1.1. Upstream
- 6.1.2. Midstream
- 6.1.3. Downstream
- 6.2. Market Analysis, Insights and Forecast - by Type
- 6.2.1. Platform
- 6.2.2. Services
- 6.1. Market Analysis, Insights and Forecast - by Operation
- 7. Europe AI in Oil and Gas Industry Analysis, Insights and Forecast, 2019-2031
- 7.1. Market Analysis, Insights and Forecast - by Operation
- 7.1.1. Upstream
- 7.1.2. Midstream
- 7.1.3. Downstream
- 7.2. Market Analysis, Insights and Forecast - by Type
- 7.2.1. Platform
- 7.2.2. Services
- 7.1. Market Analysis, Insights and Forecast - by Operation
- 8. Asia AI in Oil and Gas Industry Analysis, Insights and Forecast, 2019-2031
- 8.1. Market Analysis, Insights and Forecast - by Operation
- 8.1.1. Upstream
- 8.1.2. Midstream
- 8.1.3. Downstream
- 8.2. Market Analysis, Insights and Forecast - by Type
- 8.2.1. Platform
- 8.2.2. Services
- 8.1. Market Analysis, Insights and Forecast - by Operation
- 9. Australia and New Zealand AI in Oil and Gas Industry Analysis, Insights and Forecast, 2019-2031
- 9.1. Market Analysis, Insights and Forecast - by Operation
- 9.1.1. Upstream
- 9.1.2. Midstream
- 9.1.3. Downstream
- 9.2. Market Analysis, Insights and Forecast - by Type
- 9.2.1. Platform
- 9.2.2. Services
- 9.1. Market Analysis, Insights and Forecast - by Operation
- 10. Latin America AI in Oil and Gas Industry Analysis, Insights and Forecast, 2019-2031
- 10.1. Market Analysis, Insights and Forecast - by Operation
- 10.1.1. Upstream
- 10.1.2. Midstream
- 10.1.3. Downstream
- 10.2. Market Analysis, Insights and Forecast - by Type
- 10.2.1. Platform
- 10.2.2. Services
- 10.1. Market Analysis, Insights and Forecast - by Operation
- 11. Middle East and Africa AI in Oil and Gas Industry Analysis, Insights and Forecast, 2019-2031
- 11.1. Market Analysis, Insights and Forecast - by Operation
- 11.1.1. Upstream
- 11.1.2. Midstream
- 11.1.3. Downstream
- 11.2. Market Analysis, Insights and Forecast - by Type
- 11.2.1. Platform
- 11.2.2. Services
- 11.1. Market Analysis, Insights and Forecast - by Operation
- 12. North America AI in Oil and Gas Industry Analysis, Insights and Forecast, 2019-2031
- 12.1. Market Analysis, Insights and Forecast - By Country/Sub-region
- 12.1.1 United States
- 12.1.2 Canada
- 12.1.3 Mexico
- 13. Europe AI in Oil and Gas Industry Analysis, Insights and Forecast, 2019-2031
- 13.1. Market Analysis, Insights and Forecast - By Country/Sub-region
- 13.1.1 Germany
- 13.1.2 United Kingdom
- 13.1.3 France
- 13.1.4 Spain
- 13.1.5 Italy
- 13.1.6 Spain
- 13.1.7 Belgium
- 13.1.8 Netherland
- 13.1.9 Nordics
- 13.1.10 Rest of Europe
- 14. Asia Pacific AI in Oil and Gas Industry Analysis, Insights and Forecast, 2019-2031
- 14.1. Market Analysis, Insights and Forecast - By Country/Sub-region
- 14.1.1 China
- 14.1.2 Japan
- 14.1.3 India
- 14.1.4 South Korea
- 14.1.5 Southeast Asia
- 14.1.6 Australia
- 14.1.7 Indonesia
- 14.1.8 Phillipes
- 14.1.9 Singapore
- 14.1.10 Thailandc
- 14.1.11 Rest of Asia Pacific
- 15. South America AI in Oil and Gas Industry Analysis, Insights and Forecast, 2019-2031
- 15.1. Market Analysis, Insights and Forecast - By Country/Sub-region
- 15.1.1 Brazil
- 15.1.2 Argentina
- 15.1.3 Peru
- 15.1.4 Chile
- 15.1.5 Colombia
- 15.1.6 Ecuador
- 15.1.7 Venezuela
- 15.1.8 Rest of South America
- 16. North America AI in Oil and Gas Industry Analysis, Insights and Forecast, 2019-2031
- 16.1. Market Analysis, Insights and Forecast - By Country/Sub-region
- 16.1.1 United States
- 16.1.2 Canada
- 16.1.3 Mexico
- 17. MEA AI in Oil and Gas Industry Analysis, Insights and Forecast, 2019-2031
- 17.1. Market Analysis, Insights and Forecast - By Country/Sub-region
- 17.1.1 United Arab Emirates
- 17.1.2 Saudi Arabia
- 17.1.3 South Africa
- 17.1.4 Rest of Middle East and Africa
- 18. Competitive Analysis
- 18.1. Global Market Share Analysis 2024
- 18.2. Company Profiles
- 18.2.1 Infosys Limited
- 18.2.1.1. Overview
- 18.2.1.2. Products
- 18.2.1.3. SWOT Analysis
- 18.2.1.4. Recent Developments
- 18.2.1.5. Financials (Based on Availability)
- 18.2.2 Honeywell International Inc
- 18.2.2.1. Overview
- 18.2.2.2. Products
- 18.2.2.3. SWOT Analysis
- 18.2.2.4. Recent Developments
- 18.2.2.5. Financials (Based on Availability)
- 18.2.3 ABB Ltd
- 18.2.3.1. Overview
- 18.2.3.2. Products
- 18.2.3.3. SWOT Analysis
- 18.2.3.4. Recent Developments
- 18.2.3.5. Financials (Based on Availability)
- 18.2.4 FuGenX Technologies
- 18.2.4.1. Overview
- 18.2.4.2. Products
- 18.2.4.3. SWOT Analysis
- 18.2.4.4. Recent Developments
- 18.2.4.5. Financials (Based on Availability)
- 18.2.5 IBM Corporation
- 18.2.5.1. Overview
- 18.2.5.2. Products
- 18.2.5.3. SWOT Analysis
- 18.2.5.4. Recent Developments
- 18.2.5.5. Financials (Based on Availability)
- 18.2.6 NVIDIA Corporation
- 18.2.6.1. Overview
- 18.2.6.2. Products
- 18.2.6.3. SWOT Analysis
- 18.2.6.4. Recent Developments
- 18.2.6.5. Financials (Based on Availability)
- 18.2.7 Microsoft Corporation
- 18.2.7.1. Overview
- 18.2.7.2. Products
- 18.2.7.3. SWOT Analysis
- 18.2.7.4. Recent Developments
- 18.2.7.5. Financials (Based on Availability)
- 18.2.8 Huawei Technologies Co Ltd
- 18.2.8.1. Overview
- 18.2.8.2. Products
- 18.2.8.3. SWOT Analysis
- 18.2.8.4. Recent Developments
- 18.2.8.5. Financials (Based on Availability)
- 18.2.9 C3 AI Inc
- 18.2.9.1. Overview
- 18.2.9.2. Products
- 18.2.9.3. SWOT Analysis
- 18.2.9.4. Recent Developments
- 18.2.9.5. Financials (Based on Availability)
- 18.2.10 Intel Corporation
- 18.2.10.1. Overview
- 18.2.10.2. Products
- 18.2.10.3. SWOT Analysis
- 18.2.10.4. Recent Developments
- 18.2.10.5. Financials (Based on Availability)
- 18.2.11 oPRO ai Inc
- 18.2.11.1. Overview
- 18.2.11.2. Products
- 18.2.11.3. SWOT Analysis
- 18.2.11.4. Recent Developments
- 18.2.11.5. Financials (Based on Availability)
- 18.2.1 Infosys Limited
List of Figures
- Figure 1: Global AI in Oil and Gas Industry Revenue Breakdown (Million, %) by Region 2024 & 2032
- Figure 2: North America AI in Oil and Gas Industry Revenue (Million), by Country 2024 & 2032
- Figure 3: North America AI in Oil and Gas Industry Revenue Share (%), by Country 2024 & 2032
- Figure 4: Europe AI in Oil and Gas Industry Revenue (Million), by Country 2024 & 2032
- Figure 5: Europe AI in Oil and Gas Industry Revenue Share (%), by Country 2024 & 2032
- Figure 6: Asia Pacific AI in Oil and Gas Industry Revenue (Million), by Country 2024 & 2032
- Figure 7: Asia Pacific AI in Oil and Gas Industry Revenue Share (%), by Country 2024 & 2032
- Figure 8: South America AI in Oil and Gas Industry Revenue (Million), by Country 2024 & 2032
- Figure 9: South America AI in Oil and Gas Industry Revenue Share (%), by Country 2024 & 2032
- Figure 10: North America AI in Oil and Gas Industry Revenue (Million), by Country 2024 & 2032
- Figure 11: North America AI in Oil and Gas Industry Revenue Share (%), by Country 2024 & 2032
- Figure 12: MEA AI in Oil and Gas Industry Revenue (Million), by Country 2024 & 2032
- Figure 13: MEA AI in Oil and Gas Industry Revenue Share (%), by Country 2024 & 2032
- Figure 14: North America AI in Oil and Gas Industry Revenue (Million), by Operation 2024 & 2032
- Figure 15: North America AI in Oil and Gas Industry Revenue Share (%), by Operation 2024 & 2032
- Figure 16: North America AI in Oil and Gas Industry Revenue (Million), by Type 2024 & 2032
- Figure 17: North America AI in Oil and Gas Industry Revenue Share (%), by Type 2024 & 2032
- Figure 18: North America AI in Oil and Gas Industry Revenue (Million), by Country 2024 & 2032
- Figure 19: North America AI in Oil and Gas Industry Revenue Share (%), by Country 2024 & 2032
- Figure 20: Europe AI in Oil and Gas Industry Revenue (Million), by Operation 2024 & 2032
- Figure 21: Europe AI in Oil and Gas Industry Revenue Share (%), by Operation 2024 & 2032
- Figure 22: Europe AI in Oil and Gas Industry Revenue (Million), by Type 2024 & 2032
- Figure 23: Europe AI in Oil and Gas Industry Revenue Share (%), by Type 2024 & 2032
- Figure 24: Europe AI in Oil and Gas Industry Revenue (Million), by Country 2024 & 2032
- Figure 25: Europe AI in Oil and Gas Industry Revenue Share (%), by Country 2024 & 2032
- Figure 26: Asia AI in Oil and Gas Industry Revenue (Million), by Operation 2024 & 2032
- Figure 27: Asia AI in Oil and Gas Industry Revenue Share (%), by Operation 2024 & 2032
- Figure 28: Asia AI in Oil and Gas Industry Revenue (Million), by Type 2024 & 2032
- Figure 29: Asia AI in Oil and Gas Industry Revenue Share (%), by Type 2024 & 2032
- Figure 30: Asia AI in Oil and Gas Industry Revenue (Million), by Country 2024 & 2032
- Figure 31: Asia AI in Oil and Gas Industry Revenue Share (%), by Country 2024 & 2032
- Figure 32: Australia and New Zealand AI in Oil and Gas Industry Revenue (Million), by Operation 2024 & 2032
- Figure 33: Australia and New Zealand AI in Oil and Gas Industry Revenue Share (%), by Operation 2024 & 2032
- Figure 34: Australia and New Zealand AI in Oil and Gas Industry Revenue (Million), by Type 2024 & 2032
- Figure 35: Australia and New Zealand AI in Oil and Gas Industry Revenue Share (%), by Type 2024 & 2032
- Figure 36: Australia and New Zealand AI in Oil and Gas Industry Revenue (Million), by Country 2024 & 2032
- Figure 37: Australia and New Zealand AI in Oil and Gas Industry Revenue Share (%), by Country 2024 & 2032
- Figure 38: Latin America AI in Oil and Gas Industry Revenue (Million), by Operation 2024 & 2032
- Figure 39: Latin America AI in Oil and Gas Industry Revenue Share (%), by Operation 2024 & 2032
- Figure 40: Latin America AI in Oil and Gas Industry Revenue (Million), by Type 2024 & 2032
- Figure 41: Latin America AI in Oil and Gas Industry Revenue Share (%), by Type 2024 & 2032
- Figure 42: Latin America AI in Oil and Gas Industry Revenue (Million), by Country 2024 & 2032
- Figure 43: Latin America AI in Oil and Gas Industry Revenue Share (%), by Country 2024 & 2032
- Figure 44: Middle East and Africa AI in Oil and Gas Industry Revenue (Million), by Operation 2024 & 2032
- Figure 45: Middle East and Africa AI in Oil and Gas Industry Revenue Share (%), by Operation 2024 & 2032
- Figure 46: Middle East and Africa AI in Oil and Gas Industry Revenue (Million), by Type 2024 & 2032
- Figure 47: Middle East and Africa AI in Oil and Gas Industry Revenue Share (%), by Type 2024 & 2032
- Figure 48: Middle East and Africa AI in Oil and Gas Industry Revenue (Million), by Country 2024 & 2032
- Figure 49: Middle East and Africa AI in Oil and Gas Industry Revenue Share (%), by Country 2024 & 2032
List of Tables
- Table 1: Global AI in Oil and Gas Industry Revenue Million Forecast, by Region 2019 & 2032
- Table 2: Global AI in Oil and Gas Industry Revenue Million Forecast, by Operation 2019 & 2032
- Table 3: Global AI in Oil and Gas Industry Revenue Million Forecast, by Type 2019 & 2032
- Table 4: Global AI in Oil and Gas Industry Revenue Million Forecast, by Region 2019 & 2032
- Table 5: Global AI in Oil and Gas Industry Revenue Million Forecast, by Country 2019 & 2032
- Table 6: United States AI in Oil and Gas Industry Revenue (Million) Forecast, by Application 2019 & 2032
- Table 7: Canada AI in Oil and Gas Industry Revenue (Million) Forecast, by Application 2019 & 2032
- Table 8: Mexico AI in Oil and Gas Industry Revenue (Million) Forecast, by Application 2019 & 2032
- Table 9: Global AI in Oil and Gas Industry Revenue Million Forecast, by Country 2019 & 2032
- Table 10: Germany AI in Oil and Gas Industry Revenue (Million) Forecast, by Application 2019 & 2032
- Table 11: United Kingdom AI in Oil and Gas Industry Revenue (Million) Forecast, by Application 2019 & 2032
- Table 12: France AI in Oil and Gas Industry Revenue (Million) Forecast, by Application 2019 & 2032
- Table 13: Spain AI in Oil and Gas Industry Revenue (Million) Forecast, by Application 2019 & 2032
- Table 14: Italy AI in Oil and Gas Industry Revenue (Million) Forecast, by Application 2019 & 2032
- Table 15: Spain AI in Oil and Gas Industry Revenue (Million) Forecast, by Application 2019 & 2032
- Table 16: Belgium AI in Oil and Gas Industry Revenue (Million) Forecast, by Application 2019 & 2032
- Table 17: Netherland AI in Oil and Gas Industry Revenue (Million) Forecast, by Application 2019 & 2032
- Table 18: Nordics AI in Oil and Gas Industry Revenue (Million) Forecast, by Application 2019 & 2032
- Table 19: Rest of Europe AI in Oil and Gas Industry Revenue (Million) Forecast, by Application 2019 & 2032
- Table 20: Global AI in Oil and Gas Industry Revenue Million Forecast, by Country 2019 & 2032
- Table 21: China AI in Oil and Gas Industry Revenue (Million) Forecast, by Application 2019 & 2032
- Table 22: Japan AI in Oil and Gas Industry Revenue (Million) Forecast, by Application 2019 & 2032
- Table 23: India AI in Oil and Gas Industry Revenue (Million) Forecast, by Application 2019 & 2032
- Table 24: South Korea AI in Oil and Gas Industry Revenue (Million) Forecast, by Application 2019 & 2032
- Table 25: Southeast Asia AI in Oil and Gas Industry Revenue (Million) Forecast, by Application 2019 & 2032
- Table 26: Australia AI in Oil and Gas Industry Revenue (Million) Forecast, by Application 2019 & 2032
- Table 27: Indonesia AI in Oil and Gas Industry Revenue (Million) Forecast, by Application 2019 & 2032
- Table 28: Phillipes AI in Oil and Gas Industry Revenue (Million) Forecast, by Application 2019 & 2032
- Table 29: Singapore AI in Oil and Gas Industry Revenue (Million) Forecast, by Application 2019 & 2032
- Table 30: Thailandc AI in Oil and Gas Industry Revenue (Million) Forecast, by Application 2019 & 2032
- Table 31: Rest of Asia Pacific AI in Oil and Gas Industry Revenue (Million) Forecast, by Application 2019 & 2032
- Table 32: Global AI in Oil and Gas Industry Revenue Million Forecast, by Country 2019 & 2032
- Table 33: Brazil AI in Oil and Gas Industry Revenue (Million) Forecast, by Application 2019 & 2032
- Table 34: Argentina AI in Oil and Gas Industry Revenue (Million) Forecast, by Application 2019 & 2032
- Table 35: Peru AI in Oil and Gas Industry Revenue (Million) Forecast, by Application 2019 & 2032
- Table 36: Chile AI in Oil and Gas Industry Revenue (Million) Forecast, by Application 2019 & 2032
- Table 37: Colombia AI in Oil and Gas Industry Revenue (Million) Forecast, by Application 2019 & 2032
- Table 38: Ecuador AI in Oil and Gas Industry Revenue (Million) Forecast, by Application 2019 & 2032
- Table 39: Venezuela AI in Oil and Gas Industry Revenue (Million) Forecast, by Application 2019 & 2032
- Table 40: Rest of South America AI in Oil and Gas Industry Revenue (Million) Forecast, by Application 2019 & 2032
- Table 41: Global AI in Oil and Gas Industry Revenue Million Forecast, by Country 2019 & 2032
- Table 42: United States AI in Oil and Gas Industry Revenue (Million) Forecast, by Application 2019 & 2032
- Table 43: Canada AI in Oil and Gas Industry Revenue (Million) Forecast, by Application 2019 & 2032
- Table 44: Mexico AI in Oil and Gas Industry Revenue (Million) Forecast, by Application 2019 & 2032
- Table 45: Global AI in Oil and Gas Industry Revenue Million Forecast, by Country 2019 & 2032
- Table 46: United Arab Emirates AI in Oil and Gas Industry Revenue (Million) Forecast, by Application 2019 & 2032
- Table 47: Saudi Arabia AI in Oil and Gas Industry Revenue (Million) Forecast, by Application 2019 & 2032
- Table 48: South Africa AI in Oil and Gas Industry Revenue (Million) Forecast, by Application 2019 & 2032
- Table 49: Rest of Middle East and Africa AI in Oil and Gas Industry Revenue (Million) Forecast, by Application 2019 & 2032
- Table 50: Global AI in Oil and Gas Industry Revenue Million Forecast, by Operation 2019 & 2032
- Table 51: Global AI in Oil and Gas Industry Revenue Million Forecast, by Type 2019 & 2032
- Table 52: Global AI in Oil and Gas Industry Revenue Million Forecast, by Country 2019 & 2032
- Table 53: Global AI in Oil and Gas Industry Revenue Million Forecast, by Operation 2019 & 2032
- Table 54: Global AI in Oil and Gas Industry Revenue Million Forecast, by Type 2019 & 2032
- Table 55: Global AI in Oil and Gas Industry Revenue Million Forecast, by Country 2019 & 2032
- Table 56: Global AI in Oil and Gas Industry Revenue Million Forecast, by Operation 2019 & 2032
- Table 57: Global AI in Oil and Gas Industry Revenue Million Forecast, by Type 2019 & 2032
- Table 58: Global AI in Oil and Gas Industry Revenue Million Forecast, by Country 2019 & 2032
- Table 59: Global AI in Oil and Gas Industry Revenue Million Forecast, by Operation 2019 & 2032
- Table 60: Global AI in Oil and Gas Industry Revenue Million Forecast, by Type 2019 & 2032
- Table 61: Global AI in Oil and Gas Industry Revenue Million Forecast, by Country 2019 & 2032
- Table 62: Global AI in Oil and Gas Industry Revenue Million Forecast, by Operation 2019 & 2032
- Table 63: Global AI in Oil and Gas Industry Revenue Million Forecast, by Type 2019 & 2032
- Table 64: Global AI in Oil and Gas Industry Revenue Million Forecast, by Country 2019 & 2032
- Table 65: Global AI in Oil and Gas Industry Revenue Million Forecast, by Operation 2019 & 2032
- Table 66: Global AI in Oil and Gas Industry Revenue Million Forecast, by Type 2019 & 2032
- Table 67: Global AI in Oil and Gas Industry Revenue Million Forecast, by Country 2019 & 2032
Frequently Asked Questions
1. What is the projected Compound Annual Growth Rate (CAGR) of the AI in Oil and Gas Industry?
The projected CAGR is approximately 12.61%.
2. Which companies are prominent players in the AI in Oil and Gas Industry?
Key companies in the market include Infosys Limited, Honeywell International Inc, ABB Ltd, FuGenX Technologies, IBM Corporation, NVIDIA Corporation, Microsoft Corporation, Huawei Technologies Co Ltd, C3 AI Inc, Intel Corporation, oPRO ai Inc.
3. What are the main segments of the AI in Oil and Gas Industry?
The market segments include Operation, Type.
4. Can you provide details about the market size?
The market size is estimated to be USD 3.14 Million as of 2022.
5. What are some drivers contributing to market growth?
Increasing Focus to Easily Process Big Data; Rising Trend to Reduce Production Cost.
6. What are the notable trends driving market growth?
Upstream Operations Segment Expected to Witness Significant Growth.
7. Are there any restraints impacting market growth?
Initial High Cost of Adoption; Lack of Skilled Professionals in the Oil and Gas Industry.
8. Can you provide examples of recent developments in the market?
March 2024: The Abu Dhabi National Oil Company (ADNOC) planned to deploy artificial intelligence solutions to begin oil production from the Belbazem offshore block, enhancing efficiency and safety while reducing emissions and costs. The oil company partnered with AIQ to use WellInsight, an AI tool developed by AIQ, to analyze reservoir data and manage operations for enhanced safety and performance, showing the demand for the market in the oil and gas industry.
9. What pricing options are available for accessing the report?
Pricing options include single-user, multi-user, and enterprise licenses priced at USD 4750, USD 5250, and USD 8750 respectively.
10. Is the market size provided in terms of value or volume?
The market size is provided in terms of value, measured in Million.
11. Are there any specific market keywords associated with the report?
Yes, the market keyword associated with the report is "AI in Oil and Gas Industry," which aids in identifying and referencing the specific market segment covered.
12. How do I determine which pricing option suits my needs best?
The pricing options vary based on user requirements and access needs. Individual users may opt for single-user licenses, while businesses requiring broader access may choose multi-user or enterprise licenses for cost-effective access to the report.
13. Are there any additional resources or data provided in the AI in Oil and Gas Industry report?
While the report offers comprehensive insights, it's advisable to review the specific contents or supplementary materials provided to ascertain if additional resources or data are available.
14. How can I stay updated on further developments or reports in the AI in Oil and Gas Industry?
To stay informed about further developments, trends, and reports in the AI in Oil and Gas Industry, consider subscribing to industry newsletters, following relevant companies and organizations, or regularly checking reputable industry news sources and publications.
Methodology
Step 1 - Identification of Relevant Samples Size from Population Database


Step 2 - Approaches for Defining Global Market Size (Value, Volume* & Price*)

Note*: In applicable scenarios
Step 3 - Data Sources
Primary Research
- Web Analytics
- Survey Reports
- Research Institute
- Latest Research Reports
- Opinion Leaders
Secondary Research
- Annual Reports
- White Paper
- Latest Press Release
- Industry Association
- Paid Database
- Investor Presentations

Step 4 - Data Triangulation
Involves using different sources of information in order to increase the validity of a study
These sources are likely to be stakeholders in a program - participants, other researchers, program staff, other community members, and so on.
Then we put all data in single framework & apply various statistical tools to find out the dynamic on the market.
During the analysis stage, feedback from the stakeholder groups would be compared to determine areas of agreement as well as areas of divergence


