Key Insights
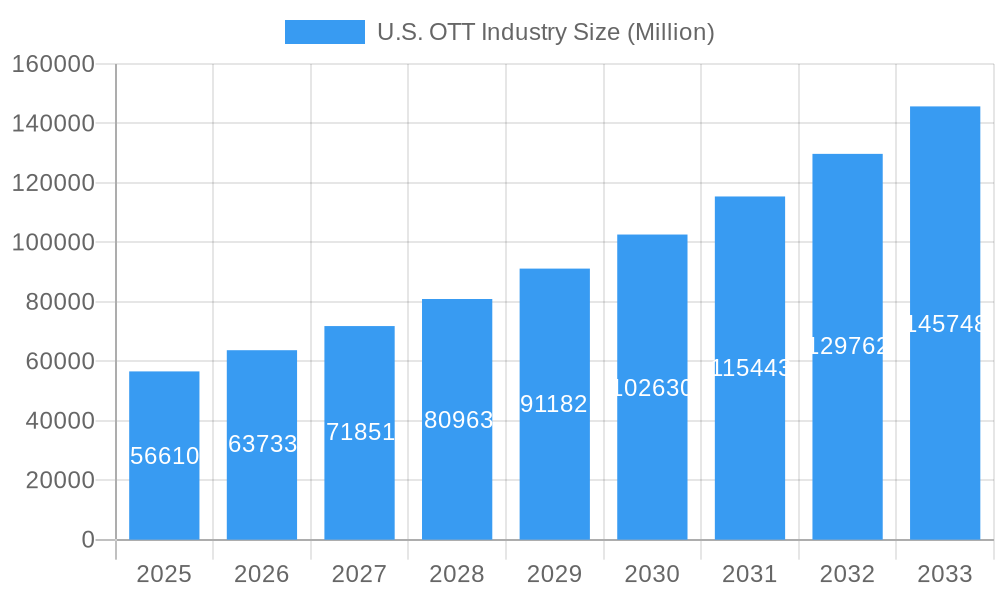
The U.S. Over-the-Top (OTT) streaming market, valued at $56.61 billion in 2025, is experiencing robust growth, projected to expand at a Compound Annual Growth Rate (CAGR) of 12.56% from 2025 to 2033. This significant expansion is fueled by several key drivers. The increasing affordability and accessibility of high-speed internet, coupled with the rising adoption of smart TVs and mobile devices, are making streaming services more convenient and appealing to a wider audience. Consumer demand for on-demand content, personalized viewing experiences, and diverse programming options further fuels market growth. Competition among established players like Netflix, Disney+, and Amazon Prime Video, alongside the emergence of niche streaming services, is driving innovation and pushing down prices, benefiting consumers. While cord-cutting continues to contribute significantly, the evolving landscape also sees traditional cable providers integrating OTT services into their offerings, blurring the lines between traditional and streaming television. Geographic distribution reflects varying levels of internet penetration and consumer preferences, with major metropolitan areas and regions with high disposable incomes exhibiting higher adoption rates. However, challenges remain. Content licensing costs, the need for ongoing investment in original programming, and the potential for subscriber churn due to price increases or competition pose significant hurdles for market participants.
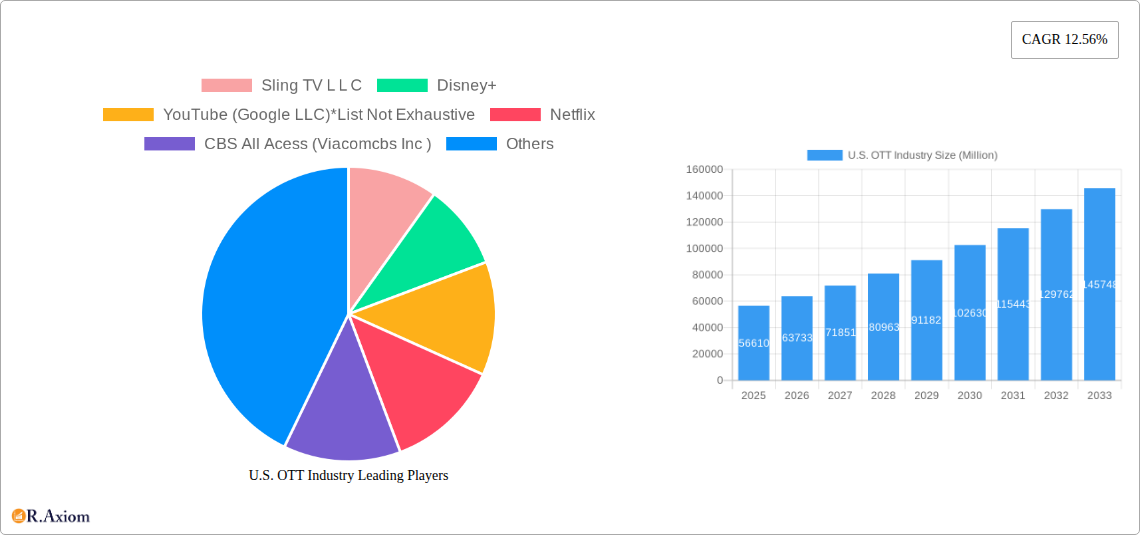
U.S. OTT Industry Market Size (In Billion)
The segmentation of the market into Subscription Video on Demand (SVOD), Transactional Video on Demand (TVOD), and Advertising-based Video on Demand (AVOD) reveals distinct growth trajectories. SVOD, the dominant segment, is expected to maintain its leading position, driven by its subscription-based revenue model and large content libraries. TVOD will experience moderate growth as consumers selectively purchase individual movies or shows, while AVOD is poised for substantial expansion, fueled by increasing advertising revenue and the popularity of free, ad-supported streaming options. Regional variations are expected, with the Northeast and West Coast potentially leading in terms of market share due to higher internet penetration and disposable income levels. However, growth will be observed across all regions of the United States as internet access expands and the appeal of OTT services continues to grow. The competitive landscape will remain dynamic, with mergers, acquisitions, and strategic partnerships playing a pivotal role in shaping the future of the U.S. OTT market.
U.S. OTT Industry Company Market Share
U.S. OTT Industry: Market Analysis & Forecast 2019-2033
This comprehensive report provides an in-depth analysis of the U.S. Over-the-Top (OTT) industry, encompassing market size, segmentation, key players, growth drivers, challenges, and future outlook. The study period covers 2019-2033, with 2025 as the base and estimated year. The forecast period is 2025-2033, and the historical period is 2019-2024. The report offers actionable insights for industry stakeholders, investors, and businesses operating within this dynamic market.
U.S. OTT Industry Market Concentration & Innovation
The U.S. OTT industry exhibits a high degree of concentration, with a few major players commanding significant market share. Netflix, Disney+, and Amazon Prime Video lead the SVOD segment, while others like YouTube (Google LLC), HBO Max (AT&T Inc), and Hulu (Disney) compete fiercely. Market share analysis reveals that the top five players hold approximately xx% of the market in 2024, indicating a consolidated landscape. Innovation is driven by factors like the emergence of new technologies (e.g., 4K, HDR, VR), personalized content recommendations, and the increasing adoption of ad-supported models (AVOD). Regulatory frameworks, including net neutrality and data privacy regulations, significantly influence market dynamics. Product substitutes, such as traditional cable TV, are facing a decline, while the rise of gaming platforms offering streaming services presents a new form of competition. End-user trends, including cord-cutting and increasing demand for on-demand content, are shaping the market. Mergers and acquisitions (M&A) are prevalent, with notable deals such as Netflix’s acquisition of Animal Logic in 2022 (valued at xx Million) illustrating the industry's consolidation and expansion strategies. The overall M&A activity in the historical period reached a value of xx Million.
U.S. OTT Industry Industry Trends & Insights
The U.S. OTT industry is experiencing robust growth, driven by rising internet penetration, increasing smartphone ownership, and the growing preference for on-demand content. The Compound Annual Growth Rate (CAGR) for the period 2025-2033 is projected to be xx%. Market penetration is estimated at xx% in 2025 and is expected to reach xx% by 2033. Technological disruptions, including advancements in streaming technology and the rise of 5G, are further fueling market expansion. Consumer preferences are shifting towards personalized experiences, high-quality content, and flexible subscription models. The competitive landscape is highly dynamic, with companies continuously investing in content creation, technological improvements, and strategic partnerships. The shift towards AVOD models and the ongoing competition for subscriber acquisition add to the complexities of the market. The emergence of FAST channels also represents a noteworthy trend influencing market development.
Dominant Markets & Segments in U.S. OTT Industry
The SVOD segment dominates the U.S. OTT market due to its high-quality content and diverse programming. Key drivers include high disposable income, widespread internet accessibility, and a preference for on-demand entertainment options. The AVOD segment is also experiencing rapid growth, driven by the increasing demand for free or low-cost content with advertising. TVOD remains a niche market, catering to the demand for specific movies or events.
SVOD Dominance Drivers:
- High disposable income levels among U.S. consumers.
- Robust internet infrastructure and high broadband penetration.
- Increasing consumer preference for personalized and on-demand content.
- Significant investments by major players in high-quality original content.
AVOD Growth Drivers:
- Availability of free or low-cost content.
- Growing comfort levels among consumers with ad-supported services.
- Targeted advertising options for businesses seeking to reach specific audiences.
- Potential for higher monetization compared to subscription-based models for certain content types.
TVOD Market Dynamics:
- Reliance on specific events or releases for revenue generation.
- Dependence on content availability and consumer demand for individual purchases.
- High price point and consumer preference for subscription services.
U.S. OTT Industry Product Developments
The U.S. OTT industry is characterized by continuous product innovation. Key advancements include the integration of artificial intelligence for personalized recommendations, the introduction of 4K and HDR streaming capabilities, and the development of interactive features to enhance user engagement. The market is witnessing a trend towards multi-device compatibility and cross-platform integration. Companies are strategically developing competitive advantages through exclusive content libraries, personalized user interfaces, and seamless user experiences. These improvements align with technological trends and market demands, increasing customer satisfaction and retention.
Report Scope & Segmentation Analysis
This report segments the U.S. OTT market by type:
SVOD (Subscription Video on Demand): This segment is projected to witness robust growth, driven by rising demand for high-quality content and increasing internet penetration. The market size for SVOD in 2025 is estimated at xx Million. Competitive dynamics are highly intense, with established players fiercely competing for subscribers.
TVOD (Transactional Video on Demand): This segment is expected to experience moderate growth, driven by consumers' desire for immediate access to new releases. The market size for TVOD in 2025 is projected to be xx Million. Competition in this segment is largely influenced by the availability and pricing of new content.
AVOD (Advertising-based Video on Demand): This segment is anticipated to experience significant growth due to its accessibility and free content model. The market size for AVOD in 2025 is estimated at xx Million. Competition in this sector focuses on attracting audiences and optimizing advertising revenue.
Key Drivers of U.S. OTT Industry Growth
Several factors fuel the growth of the U.S. OTT industry. Technological advancements, like the rise of high-speed internet and improved streaming technologies, offer seamless viewing experiences. Economic factors, including rising disposable incomes and increased affordability of streaming services, contribute significantly to market expansion. Favorable regulatory environments, promoting competition and innovation, further boost the sector's growth. The rise of mobile streaming and smart TVs further enhances accessibility.
Challenges in the U.S. OTT Industry Sector
The U.S. OTT industry faces challenges such as intense competition, content acquisition costs, and copyright issues. Regulatory hurdles regarding data privacy and net neutrality also pose obstacles. Supply chain disruptions impacting content production and distribution can lead to delays and increased costs. The industry's profitability is threatened by the rising costs associated with securing high-quality content and technological infrastructure. These factors may impact the overall market expansion.
Emerging Opportunities in U.S. OTT Industry
The U.S. OTT industry offers numerous opportunities for expansion. The increasing adoption of 5G technology promises faster streaming speeds and improved viewing quality. The growing popularity of virtual reality (VR) and augmented reality (AR) creates potential for immersive entertainment experiences. New markets, such as developing countries with rising internet penetration, hold significant growth potential. Furthermore, the increasing integration of OTT services with other digital platforms presents opportunities for cross-promotion and expanded reach.
Leading Players in the U.S. OTT Industry Market
Key Developments in U.S. OTT Industry Industry
July 2022: Netflix acquired Animal Logic, a leading independent animation studio, for xx Million, boosting its animation production capabilities. This strategic move positions Netflix to produce a wider range of original animated content.
April 2022: Roku and Amazon extended their distribution agreement, ensuring continued access to Prime Video and IMDb TV on Roku devices. This partnership reinforces the reach of both companies within the streaming market.
Strategic Outlook for U.S. OTT Industry Market
The U.S. OTT industry is poised for continued growth, driven by technological innovation, expanding content libraries, and evolving consumer preferences. The focus on personalized experiences, immersive content, and innovative business models will shape future market dynamics. New technologies, such as AI-powered recommendations and interactive content, will further enhance user engagement and drive market expansion. The emergence of new players and strategic alliances will increase the competitiveness of the sector, promising a dynamic and evolving market landscape over the next decade.
U.S. OTT Industry Segmentation
-
1. Type
- 1.1. SVoD
- 1.2. TVoD
- 1.3. AVoD
U.S. OTT Industry Segmentation By Geography
- 1. U.S.
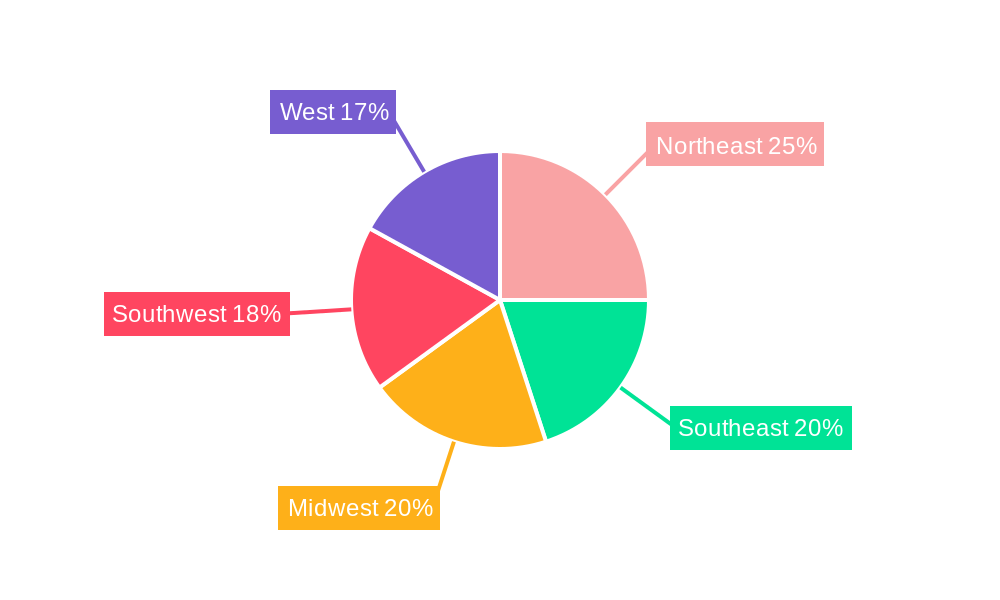
U.S. OTT Industry Regional Market Share
Geographic Coverage of U.S. OTT Industry
U.S. OTT Industry REPORT HIGHLIGHTS
| Aspects | Details |
|---|---|
| Study Period | 2020-2034 |
| Base Year | 2025 |
| Estimated Year | 2026 |
| Forecast Period | 2026-2034 |
| Historical Period | 2020-2025 |
| Growth Rate | CAGR of 12.56% from 2020-2034 |
| Segmentation |
|
Table of Contents
- 1. Introduction
- 1.1. Research Scope
- 1.2. Market Segmentation
- 1.3. Research Objective
- 1.4. Definitions and Assumptions
- 2. Executive Summary
- 2.1. Market Snapshot
- 3. Market Dynamics
- 3.1. Market Drivers
- 3.2. Market Restrains
- 3.3. Market Trends
- 3.4. Market Opportunities
- 4. Market Factor Analysis
- 4.1. Porters Five Forces
- 4.1.1. Bargaining Power of Suppliers
- 4.1.2. Bargaining Power of Buyers
- 4.1.3. Threat of New Entrants
- 4.1.4. Threat of Substitutes
- 4.1.5. Competitive Rivalry
- 4.2. PESTEL analysis
- 4.3. BCG Analysis
- 4.3.1. Stars (High Growth, High Market Share)
- 4.3.2. Cash Cows (Low Growth, High Market Share)
- 4.3.3. Question Mark (High Growth, Low Market Share)
- 4.3.4. Dogs (Low Growth, Low Market Share)
- 4.4. Ansoff Matrix Analysis
- 4.5. Supply Chain Analysis
- 4.6. Regulatory Landscape
- 4.7. Current Market Potential and Opportunity Assessment (TAM–SAM–SOM Framework)
- 4.8. RAX Analyst Note
- 4.1. Porters Five Forces
- 5. Market Analysis, Insights and Forecast 2021-2033
- 5.1. Market Analysis, Insights and Forecast - by Type
- 5.1.1. SVoD
- 5.1.2. TVoD
- 5.1.3. AVoD
- 5.2. Market Analysis, Insights and Forecast - by Region
- 5.2.1. U.S.
- 5.1. Market Analysis, Insights and Forecast - by Type
- 6. U.S. OTT Industry Analysis, Insights and Forecast, 2021-2033
- 6.1. Market Analysis, Insights and Forecast - by Type
- 6.1.1. SVoD
- 6.1.2. TVoD
- 6.1.3. AVoD
- 6.1. Market Analysis, Insights and Forecast - by Type
- 7. Competitive Analysis
- 7.1. Company Profiles
- 7.1.1 Sling TV L L C
- 7.1.1.1. Company Overview
- 7.1.1.2. Products
- 7.1.1.3. Company Financials
- 7.1.1.4. SWOT Analysis
- 7.1.2 Disney+
- 7.1.2.1. Company Overview
- 7.1.2.2. Products
- 7.1.2.3. Company Financials
- 7.1.2.4. SWOT Analysis
- 7.1.3 YouTube (Google LLC)*List Not Exhaustive
- 7.1.3.1. Company Overview
- 7.1.3.2. Products
- 7.1.3.3. Company Financials
- 7.1.3.4. SWOT Analysis
- 7.1.4 Netflix
- 7.1.4.1. Company Overview
- 7.1.4.2. Products
- 7.1.4.3. Company Financials
- 7.1.4.4. SWOT Analysis
- 7.1.5 CBS All Acess (Viacomcbs Inc )
- 7.1.5.1. Company Overview
- 7.1.5.2. Products
- 7.1.5.3. Company Financials
- 7.1.5.4. SWOT Analysis
- 7.1.6 Roku
- 7.1.6.1. Company Overview
- 7.1.6.2. Products
- 7.1.6.3. Company Financials
- 7.1.6.4. SWOT Analysis
- 7.1.7 Amazon Prime Video
- 7.1.7.1. Company Overview
- 7.1.7.2. Products
- 7.1.7.3. Company Financials
- 7.1.7.4. SWOT Analysis
- 7.1.8 Apple Inc
- 7.1.8.1. Company Overview
- 7.1.8.2. Products
- 7.1.8.3. Company Financials
- 7.1.8.4. SWOT Analysis
- 7.1.9 HBO Max (AT&T Inc )
- 7.1.9.1. Company Overview
- 7.1.9.2. Products
- 7.1.9.3. Company Financials
- 7.1.9.4. SWOT Analysis
- 7.1.1 Sling TV L L C
- 7.2. Market Entropy
- 7.2.1 Company's Key Areas Served
- 7.2.2 Recent Developments
- 7.3. Company Market Share Analysis 2025
- 7.3.1 Top 5 Companies Market Share Analysis
- 7.3.2 Top 3 Companies Market Share Analysis
- 7.4. List of Potential Customers
- 8. Research Methodology
List of Figures
- Figure 1: U.S. OTT Industry Revenue Breakdown (Million, %) by Product 2025 & 2033
- Figure 2: U.S. OTT Industry Share (%) by Company 2025
List of Tables
- Table 1: U.S. OTT Industry Revenue Million Forecast, by Type 2020 & 2033
- Table 2: U.S. OTT Industry Revenue Million Forecast, by Region 2020 & 2033
- Table 3: U.S. OTT Industry Revenue Million Forecast, by Type 2020 & 2033
- Table 4: U.S. OTT Industry Revenue Million Forecast, by Country 2020 & 2033
Frequently Asked Questions
1. What is the projected Compound Annual Growth Rate (CAGR) of the U.S. OTT Industry?
The projected CAGR is approximately 12.56%.
2. Which companies are prominent players in the U.S. OTT Industry?
Key companies in the market include Sling TV L L C, Disney+, YouTube (Google LLC)*List Not Exhaustive, Netflix, CBS All Acess (Viacomcbs Inc ), Roku, Amazon Prime Video, Apple Inc, HBO Max (AT&T Inc ).
3. What are the main segments of the U.S. OTT Industry?
The market segments include Type.
4. Can you provide details about the market size?
The market size is estimated to be USD 56.61 Million as of 2022.
5. What are some drivers contributing to market growth?
High Penetration of Smart TV and the Presence of Major OTT Providers have Contributed to the Growth of OTT Adoption in the Region; Market Consolidation to Result in Emphasis on Collaboration and Partnerships.
6. What are the notable trends driving market growth?
High Penetration of Smart TV Witnesses a Significant Growth.
7. Are there any restraints impacting market growth?
Growing Threat of Video Content Piracy and Security Threat of User Database Due to Spyware.
8. Can you provide examples of recent developments in the market?
Jul 2022: Netflix acquired Animal Logic, the world's leading independent animation studio. This acquisition is expected to speed up Netflix's development of end-to-end animation production abilities. Netflix Animation and Animal Logic together are anticipated to form a worldwide creative production team as well as an animation studio that will create some of Netflix's most popular animated feature titles.
9. What pricing options are available for accessing the report?
Pricing options include single-user, multi-user, and enterprise licenses priced at USD 3800, USD 4500, and USD 5800 respectively.
10. Is the market size provided in terms of value or volume?
The market size is provided in terms of value, measured in Million.
11. Are there any specific market keywords associated with the report?
Yes, the market keyword associated with the report is "U.S. OTT Industry," which aids in identifying and referencing the specific market segment covered.
12. How do I determine which pricing option suits my needs best?
The pricing options vary based on user requirements and access needs. Individual users may opt for single-user licenses, while businesses requiring broader access may choose multi-user or enterprise licenses for cost-effective access to the report.
13. Are there any additional resources or data provided in the U.S. OTT Industry report?
While the report offers comprehensive insights, it's advisable to review the specific contents or supplementary materials provided to ascertain if additional resources or data are available.
14. How can I stay updated on further developments or reports in the U.S. OTT Industry?
To stay informed about further developments, trends, and reports in the U.S. OTT Industry, consider subscribing to industry newsletters, following relevant companies and organizations, or regularly checking reputable industry news sources and publications.
Methodology
Step 1 - Identification of Relevant Samples Size from Population Database


Step 2 - Approaches for Defining Global Market Size (Value, Volume* & Price*)

Note*: In applicable scenarios
Step 3 - Data Sources
Primary Research
- Web Analytics
- Survey Reports
- Research Institute
- Latest Research Reports
- Opinion Leaders
Secondary Research
- Annual Reports
- White Paper
- Latest Press Release
- Industry Association
- Paid Database
- Investor Presentations

Step 4 - Data Triangulation
Involves using different sources of information in order to increase the validity of a study
These sources are likely to be stakeholders in a program - participants, other researchers, program staff, other community members, and so on.
Then we put all data in single framework & apply various statistical tools to find out the dynamic on the market.
During the analysis stage, feedback from the stakeholder groups would be compared to determine areas of agreement as well as areas of divergence

