
Key Insights
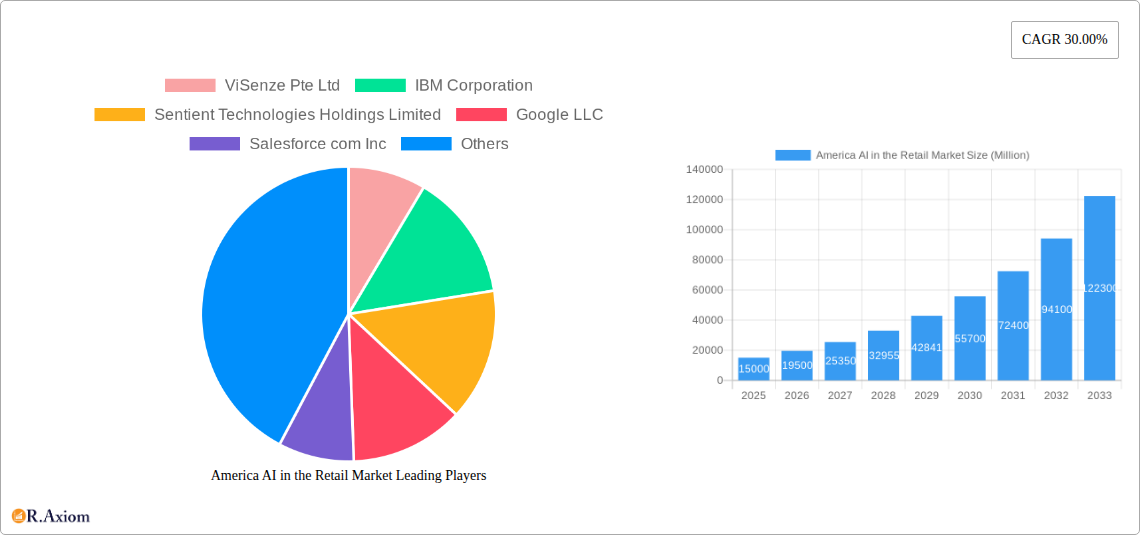
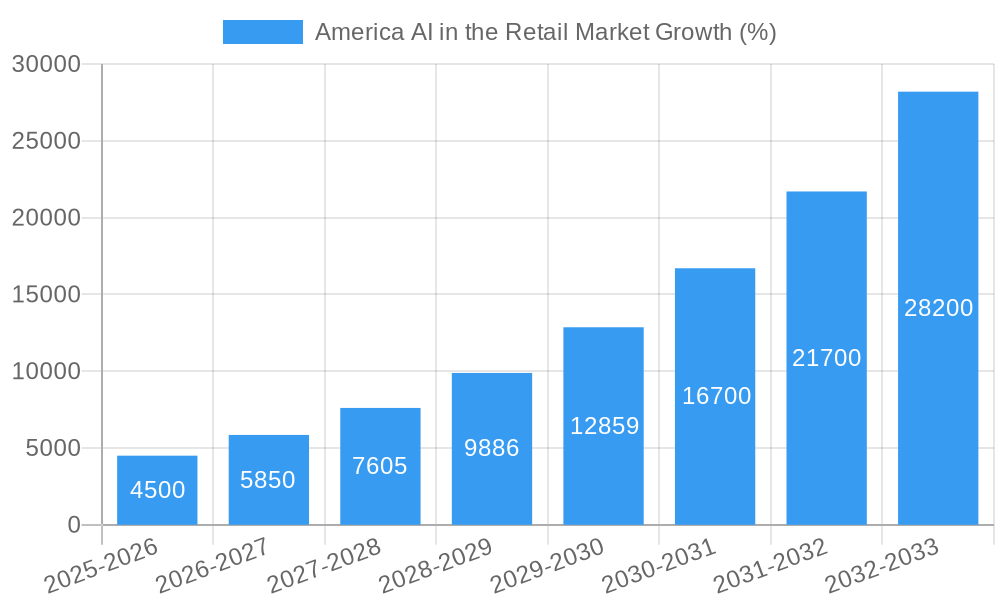
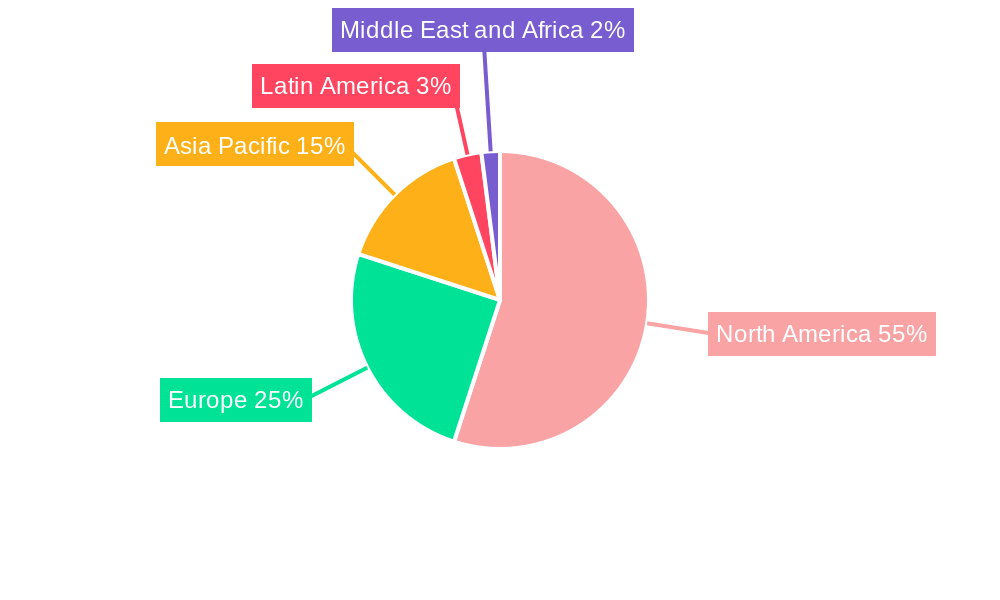
The North American AI in retail market is experiencing explosive growth, fueled by a 30% Compound Annual Growth Rate (CAGR). This robust expansion, projected from 2025 to 2033, positions the region as a global leader in leveraging artificial intelligence to transform retail operations. Key drivers include the increasing adoption of omnichannel strategies, the need for enhanced personalization and customer experience, and the rise of e-commerce. Businesses are investing heavily in AI-powered solutions like machine learning for predictive analytics, natural language processing for improved customer service (chatbots), and image and video analytics for inventory management and fraud detection. The market is segmented across various channels (omnichannel, brick-and-mortar, online), solutions (software, cloud services), applications (apparel, food, electronics, home improvement), and underlying technologies. While challenges such as data security and the need for skilled AI professionals exist, the overall market trajectory indicates a significant expansion. The high adoption of AI in the North American retail sector is driven by a combination of advanced technology infrastructure, a large consumer base receptive to innovative retail experiences, and significant investments from major technology players like IBM, Google, and Amazon. This creates a highly competitive yet dynamic landscape, with constant innovation in AI-powered retail solutions.
The strong CAGR suggests that the market value will substantially increase over the forecast period. While precise figures for regional market share are unavailable, it's reasonable to infer that North America currently holds a significant portion due to its technological advancement and high retail sector spending. The dominance of specific application areas (such as apparel and electronics) within the market may also shift over time as consumer habits evolve and AI applications mature. Continued investment in research and development, along with the ongoing integration of AI across all aspects of the retail value chain (from supply chain optimization to customer relationship management), will likely further accelerate the growth of this already dynamic market. The increasing availability of cloud-based AI solutions is also making these technologies more accessible to smaller retailers, leading to a broader market penetration.
This in-depth report provides a comprehensive analysis of the America AI in the Retail Market, covering market size, growth drivers, competitive landscape, and future outlook. The study period spans from 2019 to 2033, with 2025 serving as both the base and estimated year. This report is crucial for retailers, technology providers, investors, and industry stakeholders seeking to understand and capitalize on the transformative potential of AI in the retail sector.
America AI in the Retail Market Market Concentration & Innovation
This section analyzes the level of market concentration, key innovation drivers, regulatory landscape, product substitutes, end-user trends, and mergers and acquisitions (M&A) activities within the American AI in retail market. The market exhibits a moderately concentrated structure, with a few dominant players holding significant market share. However, the emergence of numerous startups and smaller players indicates ongoing innovation and competition.
- Market Share: Amazon Web Services (AWS) and Google LLC currently hold the largest market share, estimated at 30% and 25%, respectively, in 2025. Microsoft Corporation and IBM Corporation follow with approximately 15% each, while other players account for the remaining 20%. These estimations are based on revenue generated from AI solutions in the retail sector.
- M&A Activity: The period 2019-2024 witnessed significant M&A activity, with total deal values exceeding $XX Million. These acquisitions focused primarily on enhancing AI capabilities, expanding market reach, and acquiring specialized technologies. We predict a further $XX Million in M&A activity from 2025-2033, driven by the ongoing consolidation within the market.
- Innovation Drivers: Key innovation drivers include advancements in machine learning (ML), natural language processing (NLP), and computer vision. These technologies are enabling personalized recommendations, improved customer service, enhanced supply chain management, and fraud detection.
- Regulatory Framework: Emerging data privacy regulations, such as CCPA and GDPR, are influencing the adoption and development of AI solutions, necessitating compliance and ethical considerations.
America AI in the Retail Market Industry Trends & Insights
The American AI in retail market exhibits robust growth, driven by the increasing adoption of AI-powered solutions across various retail segments. The market's Compound Annual Growth Rate (CAGR) is projected at XX% during the forecast period (2025-2033), exceeding previous periods due to wider adoption and the introduction of newer, more powerful AI technologies. Market penetration is increasing rapidly, with more retailers recognizing AI's capability to increase efficiency, enhance customer experiences, and drive sales.
Technological advancements, including the development of more sophisticated algorithms, improved data analytics, and the expansion of cloud computing capabilities, are fundamentally reshaping the retail landscape. Consumer preferences are also shifting towards personalized experiences, seamless omnichannel interactions, and convenient, efficient shopping options—all areas where AI plays a crucial role. Competitive dynamics are characterized by intense rivalry, with established tech giants and innovative startups vying for market share. The increasing reliance on data analytics and customer insights further fuels the competition, as companies seek to leverage these assets for a competitive edge.
Dominant Markets & Segments in America AI in the Retail Market
The Omnichannel segment dominates the market, with high growth due to consumer demands for integrated shopping experiences across various channels. The Apparel and Footwear application segment also leads due to the use of AI-powered personalization and visual search technology. Within the Technology segment, Machine Learning holds the largest share due to its broad applications in various retail processes.
- Key Drivers for Omnichannel Dominance:
- Increased consumer demand for seamless shopping experiences.
- Technological advancements enabling integration across channels.
- Retailers' strategic investments in omnichannel solutions.
- Key Drivers for Apparel and Footwear Dominance:
- Growing adoption of visual search and personalized recommendations.
- High consumer engagement with online fashion platforms.
- Opportunities for improved inventory management and supply chain optimization.
- Key Drivers for Machine Learning Dominance:
- Its broad applicability across various retail functions (e.g., pricing, inventory, customer service).
- Continuous advancements in algorithms and data analytics capabilities.
- Growing availability of large datasets for training and model development.
America AI in the Retail Market Product Developments
Recent product developments focus on creating more sophisticated and integrated AI solutions for retailers. This includes improved chatbots with natural language understanding, more accurate image and video analytics for enhanced inventory management and customer service, and predictive analytics for optimized supply chains. These developments are driving increased adoption by demonstrating tangible business benefits, including cost savings, revenue growth, and improved customer satisfaction.
Report Scope & Segmentation Analysis
This report segments the America AI in the Retail Market across several dimensions:
Channel: Omnichannel, Brick and Mortar, Pure-play Online Retailers (Growth projections and market sizes vary significantly across these channels, with Omnichannel leading).
Solution: Software, Cloud Service (Cloud services are experiencing rapid growth due to scalability and cost-effectiveness).
Application: Apparel and Footwear, Food and Grocery, Electronics and Home Appliances, Home Improvement, Other Applications (Each application presents unique opportunities and challenges, influencing the adoption rate and market dynamics).
Technology: Machine Learning, Natural Language Processing, Chatbots, Image and Video Analytics, Swarm Intelligence (The market is driven by advancements in these technologies, with ML leading in market share).
Key Drivers of America AI in the Retail Market Growth
Several factors fuel the growth of the America AI in the Retail Market. These include advancements in AI technologies, increasing availability of data, decreasing costs of AI solutions, and the rising demand for personalized customer experiences. Government initiatives promoting digitalization and technological advancements also significantly contribute to market expansion.
Challenges in the America AI in the Retail Market Sector
Challenges include the high initial investment costs for implementing AI solutions, the need for skilled personnel to manage and maintain these systems, and concerns about data security and privacy. Integration with existing legacy systems can also pose a significant hurdle, as can the complexities of complying with evolving regulations. These factors can lead to slower than expected adoption rates in some segments.
Emerging Opportunities in the America AI in the Retail Market
Opportunities lie in the growing adoption of AI across smaller retailers, expansion into new applications, and the development of more sophisticated and specialized AI-powered solutions. The increasing integration of AI with other technologies like IoT and blockchain presents further growth potential. Moreover, the potential for improved supply chain visibility and efficiency through AI provides significant opportunities for cost savings and enhanced profitability.
Leading Players in the America AI in the Retail Market Market
- ViSenze Pte Ltd
- IBM Corporation
- Sentient Technologies Holdings Limited
- Google LLC
- Salesforce com Inc
- Microsoft Corporation
- Amazon Web Services Inc
- Sophos Inc (Thoma Bravo)
- Oracle Corporation
- SAP SE
Key Developments in America AI in the Retail Market Industry
- 2022-Q4: Amazon launched a new AI-powered recommendation engine for its retail platform.
- 2023-Q1: Google announced an expansion of its Cloud AI platform for retail solutions.
- 2023-Q2: IBM acquired a small AI startup specializing in supply chain optimization for the retail sector.
- 2024-Q3: Microsoft partnered with a major retailer to develop a custom AI solution for customer service.
- (Further developments can be added as they occur)
Strategic Outlook for America AI in the Retail Market Market
The America AI in the Retail Market is poised for continued strong growth, driven by technological advancements, increasing consumer demand for personalized experiences, and the ongoing digital transformation of the retail industry. Further innovation in AI technologies, coupled with greater data accessibility and improved regulatory clarity, will unlock even greater opportunities for growth and market expansion in the coming years. The focus on ethical AI and data privacy will play a critical role in shaping the future of the market.
America AI in the Retail Market Segmentation
-
1. Channel
- 1.1. Omnichannel
- 1.2. Brick and Mortar
- 1.3. Pure-play Online Retailers
-
2. Solution
-
2.1. Software
- 2.1.1. On Premise
- 2.1.2. Cloud
- 2.2. Service
-
2.1. Software
-
3. Application
- 3.1. Apparel and Footwear
- 3.2. Food and Grocery
- 3.3. Electronics and Home Appliances
- 3.4. Home Improvement
- 3.5. Other Applications
-
4. Technology
- 4.1. Machine Learning
- 4.2. Natural Language Processing
- 4.3. Chatbots
- 4.4. Image and Video Analytics
- 4.5. Swarm Intelligence
America AI in the Retail Market Segmentation By Geography
-
1. North America
- 1.1. United States
- 1.2. Canada
- 1.3. Mexico
-
2. South America
- 2.1. Brazil
- 2.2. Argentina
- 2.3. Rest of South America
-
3. Europe
- 3.1. United Kingdom
- 3.2. Germany
- 3.3. France
- 3.4. Italy
- 3.5. Spain
- 3.6. Russia
- 3.7. Benelux
- 3.8. Nordics
- 3.9. Rest of Europe
-
4. Middle East & Africa
- 4.1. Turkey
- 4.2. Israel
- 4.3. GCC
- 4.4. North Africa
- 4.5. South Africa
- 4.6. Rest of Middle East & Africa
-
5. Asia Pacific
- 5.1. China
- 5.2. India
- 5.3. Japan
- 5.4. South Korea
- 5.5. ASEAN
- 5.6. Oceania
- 5.7. Rest of Asia Pacific
America AI in the Retail Market REPORT HIGHLIGHTS
| Aspects | Details |
|---|---|
| Study Period | 2019-2033 |
| Base Year | 2024 |
| Estimated Year | 2025 |
| Forecast Period | 2025-2033 |
| Historical Period | 2019-2024 |
| Growth Rate | CAGR of 30.00% from 2019-2033 |
| Segmentation |
|
Table of Contents
- 1. Introduction
- 1.1. Research Scope
- 1.2. Market Segmentation
- 1.3. Research Methodology
- 1.4. Definitions and Assumptions
- 2. Executive Summary
- 2.1. Introduction
- 3. Market Dynamics
- 3.1. Introduction
- 3.2. Market Drivers
- 3.2.1 ; Hardware Advancement Acting as a Key Enabler for AI in Retail; Disruptive Developments in Retail
- 3.2.2 including AR
- 3.2.3 VR
- 3.2.4 IOT
- 3.2.5 and New Metrics; Rise of AI First Organizations; Need for Efficiency in Supply Chain Optimization
- 3.3. Market Restrains
- 3.3.1 ; Lack of Professionals
- 3.3.2 as well as In-house Knowledge for Cultural Readiness
- 3.4. Market Trends
- 3.4.1. Machine Learning Technology is Expected to Grow Siginificantly
- 4. Market Factor Analysis
- 4.1. Porters Five Forces
- 4.2. Supply/Value Chain
- 4.3. PESTEL analysis
- 4.4. Market Entropy
- 4.5. Patent/Trademark Analysis
- 5. Global America AI in the Retail Market Analysis, Insights and Forecast, 2019-2031
- 5.1. Market Analysis, Insights and Forecast - by Channel
- 5.1.1. Omnichannel
- 5.1.2. Brick and Mortar
- 5.1.3. Pure-play Online Retailers
- 5.2. Market Analysis, Insights and Forecast - by Solution
- 5.2.1. Software
- 5.2.1.1. On Premise
- 5.2.1.2. Cloud
- 5.2.2. Service
- 5.2.1. Software
- 5.3. Market Analysis, Insights and Forecast - by Application
- 5.3.1. Apparel and Footwear
- 5.3.2. Food and Grocery
- 5.3.3. Electronics and Home Appliances
- 5.3.4. Home Improvement
- 5.3.5. Other Applications
- 5.4. Market Analysis, Insights and Forecast - by Technology
- 5.4.1. Machine Learning
- 5.4.2. Natural Language Processing
- 5.4.3. Chatbots
- 5.4.4. Image and Video Analytics
- 5.4.5. Swarm Intelligence
- 5.5. Market Analysis, Insights and Forecast - by Region
- 5.5.1. North America
- 5.5.2. South America
- 5.5.3. Europe
- 5.5.4. Middle East & Africa
- 5.5.5. Asia Pacific
- 5.1. Market Analysis, Insights and Forecast - by Channel
- 6. North America America AI in the Retail Market Analysis, Insights and Forecast, 2019-2031
- 6.1. Market Analysis, Insights and Forecast - by Channel
- 6.1.1. Omnichannel
- 6.1.2. Brick and Mortar
- 6.1.3. Pure-play Online Retailers
- 6.2. Market Analysis, Insights and Forecast - by Solution
- 6.2.1. Software
- 6.2.1.1. On Premise
- 6.2.1.2. Cloud
- 6.2.2. Service
- 6.2.1. Software
- 6.3. Market Analysis, Insights and Forecast - by Application
- 6.3.1. Apparel and Footwear
- 6.3.2. Food and Grocery
- 6.3.3. Electronics and Home Appliances
- 6.3.4. Home Improvement
- 6.3.5. Other Applications
- 6.4. Market Analysis, Insights and Forecast - by Technology
- 6.4.1. Machine Learning
- 6.4.2. Natural Language Processing
- 6.4.3. Chatbots
- 6.4.4. Image and Video Analytics
- 6.4.5. Swarm Intelligence
- 6.1. Market Analysis, Insights and Forecast - by Channel
- 7. South America America AI in the Retail Market Analysis, Insights and Forecast, 2019-2031
- 7.1. Market Analysis, Insights and Forecast - by Channel
- 7.1.1. Omnichannel
- 7.1.2. Brick and Mortar
- 7.1.3. Pure-play Online Retailers
- 7.2. Market Analysis, Insights and Forecast - by Solution
- 7.2.1. Software
- 7.2.1.1. On Premise
- 7.2.1.2. Cloud
- 7.2.2. Service
- 7.2.1. Software
- 7.3. Market Analysis, Insights and Forecast - by Application
- 7.3.1. Apparel and Footwear
- 7.3.2. Food and Grocery
- 7.3.3. Electronics and Home Appliances
- 7.3.4. Home Improvement
- 7.3.5. Other Applications
- 7.4. Market Analysis, Insights and Forecast - by Technology
- 7.4.1. Machine Learning
- 7.4.2. Natural Language Processing
- 7.4.3. Chatbots
- 7.4.4. Image and Video Analytics
- 7.4.5. Swarm Intelligence
- 7.1. Market Analysis, Insights and Forecast - by Channel
- 8. Europe America AI in the Retail Market Analysis, Insights and Forecast, 2019-2031
- 8.1. Market Analysis, Insights and Forecast - by Channel
- 8.1.1. Omnichannel
- 8.1.2. Brick and Mortar
- 8.1.3. Pure-play Online Retailers
- 8.2. Market Analysis, Insights and Forecast - by Solution
- 8.2.1. Software
- 8.2.1.1. On Premise
- 8.2.1.2. Cloud
- 8.2.2. Service
- 8.2.1. Software
- 8.3. Market Analysis, Insights and Forecast - by Application
- 8.3.1. Apparel and Footwear
- 8.3.2. Food and Grocery
- 8.3.3. Electronics and Home Appliances
- 8.3.4. Home Improvement
- 8.3.5. Other Applications
- 8.4. Market Analysis, Insights and Forecast - by Technology
- 8.4.1. Machine Learning
- 8.4.2. Natural Language Processing
- 8.4.3. Chatbots
- 8.4.4. Image and Video Analytics
- 8.4.5. Swarm Intelligence
- 8.1. Market Analysis, Insights and Forecast - by Channel
- 9. Middle East & Africa America AI in the Retail Market Analysis, Insights and Forecast, 2019-2031
- 9.1. Market Analysis, Insights and Forecast - by Channel
- 9.1.1. Omnichannel
- 9.1.2. Brick and Mortar
- 9.1.3. Pure-play Online Retailers
- 9.2. Market Analysis, Insights and Forecast - by Solution
- 9.2.1. Software
- 9.2.1.1. On Premise
- 9.2.1.2. Cloud
- 9.2.2. Service
- 9.2.1. Software
- 9.3. Market Analysis, Insights and Forecast - by Application
- 9.3.1. Apparel and Footwear
- 9.3.2. Food and Grocery
- 9.3.3. Electronics and Home Appliances
- 9.3.4. Home Improvement
- 9.3.5. Other Applications
- 9.4. Market Analysis, Insights and Forecast - by Technology
- 9.4.1. Machine Learning
- 9.4.2. Natural Language Processing
- 9.4.3. Chatbots
- 9.4.4. Image and Video Analytics
- 9.4.5. Swarm Intelligence
- 9.1. Market Analysis, Insights and Forecast - by Channel
- 10. Asia Pacific America AI in the Retail Market Analysis, Insights and Forecast, 2019-2031
- 10.1. Market Analysis, Insights and Forecast - by Channel
- 10.1.1. Omnichannel
- 10.1.2. Brick and Mortar
- 10.1.3. Pure-play Online Retailers
- 10.2. Market Analysis, Insights and Forecast - by Solution
- 10.2.1. Software
- 10.2.1.1. On Premise
- 10.2.1.2. Cloud
- 10.2.2. Service
- 10.2.1. Software
- 10.3. Market Analysis, Insights and Forecast - by Application
- 10.3.1. Apparel and Footwear
- 10.3.2. Food and Grocery
- 10.3.3. Electronics and Home Appliances
- 10.3.4. Home Improvement
- 10.3.5. Other Applications
- 10.4. Market Analysis, Insights and Forecast - by Technology
- 10.4.1. Machine Learning
- 10.4.2. Natural Language Processing
- 10.4.3. Chatbots
- 10.4.4. Image and Video Analytics
- 10.4.5. Swarm Intelligence
- 10.1. Market Analysis, Insights and Forecast - by Channel
- 11. North America America AI in the Retail Market Analysis, Insights and Forecast, 2019-2031
- 11.1. Market Analysis, Insights and Forecast - By Country/Sub-region
- 11.1.1.
- 12. Europe America AI in the Retail Market Analysis, Insights and Forecast, 2019-2031
- 12.1. Market Analysis, Insights and Forecast - By Country/Sub-region
- 12.1.1.
- 13. Asia Pacific America AI in the Retail Market Analysis, Insights and Forecast, 2019-2031
- 13.1. Market Analysis, Insights and Forecast - By Country/Sub-region
- 13.1.1.
- 14. Latin America America AI in the Retail Market Analysis, Insights and Forecast, 2019-2031
- 14.1. Market Analysis, Insights and Forecast - By Country/Sub-region
- 14.1.1.
- 15. Middle East and Africa America AI in the Retail Market Analysis, Insights and Forecast, 2019-2031
- 15.1. Market Analysis, Insights and Forecast - By Country/Sub-region
- 15.1.1.
- 16. Competitive Analysis
- 16.1. Global Market Share Analysis 2024
- 16.2. Company Profiles
- 16.2.1 ViSenze Pte Ltd
- 16.2.1.1. Overview
- 16.2.1.2. Products
- 16.2.1.3. SWOT Analysis
- 16.2.1.4. Recent Developments
- 16.2.1.5. Financials (Based on Availability)
- 16.2.2 IBM Corporation
- 16.2.2.1. Overview
- 16.2.2.2. Products
- 16.2.2.3. SWOT Analysis
- 16.2.2.4. Recent Developments
- 16.2.2.5. Financials (Based on Availability)
- 16.2.3 Sentient Technologies Holdings Limited
- 16.2.3.1. Overview
- 16.2.3.2. Products
- 16.2.3.3. SWOT Analysis
- 16.2.3.4. Recent Developments
- 16.2.3.5. Financials (Based on Availability)
- 16.2.4 Google LLC
- 16.2.4.1. Overview
- 16.2.4.2. Products
- 16.2.4.3. SWOT Analysis
- 16.2.4.4. Recent Developments
- 16.2.4.5. Financials (Based on Availability)
- 16.2.5 Salesforce com Inc
- 16.2.5.1. Overview
- 16.2.5.2. Products
- 16.2.5.3. SWOT Analysis
- 16.2.5.4. Recent Developments
- 16.2.5.5. Financials (Based on Availability)
- 16.2.6 Microsoft Corporation
- 16.2.6.1. Overview
- 16.2.6.2. Products
- 16.2.6.3. SWOT Analysis
- 16.2.6.4. Recent Developments
- 16.2.6.5. Financials (Based on Availability)
- 16.2.7 Amazon Web Services Inc
- 16.2.7.1. Overview
- 16.2.7.2. Products
- 16.2.7.3. SWOT Analysis
- 16.2.7.4. Recent Developments
- 16.2.7.5. Financials (Based on Availability)
- 16.2.8 Sophos Inc (Thoma Bravo)
- 16.2.8.1. Overview
- 16.2.8.2. Products
- 16.2.8.3. SWOT Analysis
- 16.2.8.4. Recent Developments
- 16.2.8.5. Financials (Based on Availability)
- 16.2.9 Oracle Corporation
- 16.2.9.1. Overview
- 16.2.9.2. Products
- 16.2.9.3. SWOT Analysis
- 16.2.9.4. Recent Developments
- 16.2.9.5. Financials (Based on Availability)
- 16.2.10 SAP SE
- 16.2.10.1. Overview
- 16.2.10.2. Products
- 16.2.10.3. SWOT Analysis
- 16.2.10.4. Recent Developments
- 16.2.10.5. Financials (Based on Availability)
- 16.2.1 ViSenze Pte Ltd
List of Figures
- Figure 1: Global America AI in the Retail Market Revenue Breakdown (Million, %) by Region 2024 & 2032
- Figure 2: Global America AI in the Retail Market Volume Breakdown (K Unit, %) by Region 2024 & 2032
- Figure 3: North America America AI in the Retail Market Revenue (Million), by Country 2024 & 2032
- Figure 4: North America America AI in the Retail Market Volume (K Unit), by Country 2024 & 2032
- Figure 5: North America America AI in the Retail Market Revenue Share (%), by Country 2024 & 2032
- Figure 6: North America America AI in the Retail Market Volume Share (%), by Country 2024 & 2032
- Figure 7: Europe America AI in the Retail Market Revenue (Million), by Country 2024 & 2032
- Figure 8: Europe America AI in the Retail Market Volume (K Unit), by Country 2024 & 2032
- Figure 9: Europe America AI in the Retail Market Revenue Share (%), by Country 2024 & 2032
- Figure 10: Europe America AI in the Retail Market Volume Share (%), by Country 2024 & 2032
- Figure 11: Asia Pacific America AI in the Retail Market Revenue (Million), by Country 2024 & 2032
- Figure 12: Asia Pacific America AI in the Retail Market Volume (K Unit), by Country 2024 & 2032
- Figure 13: Asia Pacific America AI in the Retail Market Revenue Share (%), by Country 2024 & 2032
- Figure 14: Asia Pacific America AI in the Retail Market Volume Share (%), by Country 2024 & 2032
- Figure 15: Latin America America AI in the Retail Market Revenue (Million), by Country 2024 & 2032
- Figure 16: Latin America America AI in the Retail Market Volume (K Unit), by Country 2024 & 2032
- Figure 17: Latin America America AI in the Retail Market Revenue Share (%), by Country 2024 & 2032
- Figure 18: Latin America America AI in the Retail Market Volume Share (%), by Country 2024 & 2032
- Figure 19: Middle East and Africa America AI in the Retail Market Revenue (Million), by Country 2024 & 2032
- Figure 20: Middle East and Africa America AI in the Retail Market Volume (K Unit), by Country 2024 & 2032
- Figure 21: Middle East and Africa America AI in the Retail Market Revenue Share (%), by Country 2024 & 2032
- Figure 22: Middle East and Africa America AI in the Retail Market Volume Share (%), by Country 2024 & 2032
- Figure 23: North America America AI in the Retail Market Revenue (Million), by Channel 2024 & 2032
- Figure 24: North America America AI in the Retail Market Volume (K Unit), by Channel 2024 & 2032
- Figure 25: North America America AI in the Retail Market Revenue Share (%), by Channel 2024 & 2032
- Figure 26: North America America AI in the Retail Market Volume Share (%), by Channel 2024 & 2032
- Figure 27: North America America AI in the Retail Market Revenue (Million), by Solution 2024 & 2032
- Figure 28: North America America AI in the Retail Market Volume (K Unit), by Solution 2024 & 2032
- Figure 29: North America America AI in the Retail Market Revenue Share (%), by Solution 2024 & 2032
- Figure 30: North America America AI in the Retail Market Volume Share (%), by Solution 2024 & 2032
- Figure 31: North America America AI in the Retail Market Revenue (Million), by Application 2024 & 2032
- Figure 32: North America America AI in the Retail Market Volume (K Unit), by Application 2024 & 2032
- Figure 33: North America America AI in the Retail Market Revenue Share (%), by Application 2024 & 2032
- Figure 34: North America America AI in the Retail Market Volume Share (%), by Application 2024 & 2032
- Figure 35: North America America AI in the Retail Market Revenue (Million), by Technology 2024 & 2032
- Figure 36: North America America AI in the Retail Market Volume (K Unit), by Technology 2024 & 2032
- Figure 37: North America America AI in the Retail Market Revenue Share (%), by Technology 2024 & 2032
- Figure 38: North America America AI in the Retail Market Volume Share (%), by Technology 2024 & 2032
- Figure 39: North America America AI in the Retail Market Revenue (Million), by Country 2024 & 2032
- Figure 40: North America America AI in the Retail Market Volume (K Unit), by Country 2024 & 2032
- Figure 41: North America America AI in the Retail Market Revenue Share (%), by Country 2024 & 2032
- Figure 42: North America America AI in the Retail Market Volume Share (%), by Country 2024 & 2032
- Figure 43: South America America AI in the Retail Market Revenue (Million), by Channel 2024 & 2032
- Figure 44: South America America AI in the Retail Market Volume (K Unit), by Channel 2024 & 2032
- Figure 45: South America America AI in the Retail Market Revenue Share (%), by Channel 2024 & 2032
- Figure 46: South America America AI in the Retail Market Volume Share (%), by Channel 2024 & 2032
- Figure 47: South America America AI in the Retail Market Revenue (Million), by Solution 2024 & 2032
- Figure 48: South America America AI in the Retail Market Volume (K Unit), by Solution 2024 & 2032
- Figure 49: South America America AI in the Retail Market Revenue Share (%), by Solution 2024 & 2032
- Figure 50: South America America AI in the Retail Market Volume Share (%), by Solution 2024 & 2032
- Figure 51: South America America AI in the Retail Market Revenue (Million), by Application 2024 & 2032
- Figure 52: South America America AI in the Retail Market Volume (K Unit), by Application 2024 & 2032
- Figure 53: South America America AI in the Retail Market Revenue Share (%), by Application 2024 & 2032
- Figure 54: South America America AI in the Retail Market Volume Share (%), by Application 2024 & 2032
- Figure 55: South America America AI in the Retail Market Revenue (Million), by Technology 2024 & 2032
- Figure 56: South America America AI in the Retail Market Volume (K Unit), by Technology 2024 & 2032
- Figure 57: South America America AI in the Retail Market Revenue Share (%), by Technology 2024 & 2032
- Figure 58: South America America AI in the Retail Market Volume Share (%), by Technology 2024 & 2032
- Figure 59: South America America AI in the Retail Market Revenue (Million), by Country 2024 & 2032
- Figure 60: South America America AI in the Retail Market Volume (K Unit), by Country 2024 & 2032
- Figure 61: South America America AI in the Retail Market Revenue Share (%), by Country 2024 & 2032
- Figure 62: South America America AI in the Retail Market Volume Share (%), by Country 2024 & 2032
- Figure 63: Europe America AI in the Retail Market Revenue (Million), by Channel 2024 & 2032
- Figure 64: Europe America AI in the Retail Market Volume (K Unit), by Channel 2024 & 2032
- Figure 65: Europe America AI in the Retail Market Revenue Share (%), by Channel 2024 & 2032
- Figure 66: Europe America AI in the Retail Market Volume Share (%), by Channel 2024 & 2032
- Figure 67: Europe America AI in the Retail Market Revenue (Million), by Solution 2024 & 2032
- Figure 68: Europe America AI in the Retail Market Volume (K Unit), by Solution 2024 & 2032
- Figure 69: Europe America AI in the Retail Market Revenue Share (%), by Solution 2024 & 2032
- Figure 70: Europe America AI in the Retail Market Volume Share (%), by Solution 2024 & 2032
- Figure 71: Europe America AI in the Retail Market Revenue (Million), by Application 2024 & 2032
- Figure 72: Europe America AI in the Retail Market Volume (K Unit), by Application 2024 & 2032
- Figure 73: Europe America AI in the Retail Market Revenue Share (%), by Application 2024 & 2032
- Figure 74: Europe America AI in the Retail Market Volume Share (%), by Application 2024 & 2032
- Figure 75: Europe America AI in the Retail Market Revenue (Million), by Technology 2024 & 2032
- Figure 76: Europe America AI in the Retail Market Volume (K Unit), by Technology 2024 & 2032
- Figure 77: Europe America AI in the Retail Market Revenue Share (%), by Technology 2024 & 2032
- Figure 78: Europe America AI in the Retail Market Volume Share (%), by Technology 2024 & 2032
- Figure 79: Europe America AI in the Retail Market Revenue (Million), by Country 2024 & 2032
- Figure 80: Europe America AI in the Retail Market Volume (K Unit), by Country 2024 & 2032
- Figure 81: Europe America AI in the Retail Market Revenue Share (%), by Country 2024 & 2032
- Figure 82: Europe America AI in the Retail Market Volume Share (%), by Country 2024 & 2032
- Figure 83: Middle East & Africa America AI in the Retail Market Revenue (Million), by Channel 2024 & 2032
- Figure 84: Middle East & Africa America AI in the Retail Market Volume (K Unit), by Channel 2024 & 2032
- Figure 85: Middle East & Africa America AI in the Retail Market Revenue Share (%), by Channel 2024 & 2032
- Figure 86: Middle East & Africa America AI in the Retail Market Volume Share (%), by Channel 2024 & 2032
- Figure 87: Middle East & Africa America AI in the Retail Market Revenue (Million), by Solution 2024 & 2032
- Figure 88: Middle East & Africa America AI in the Retail Market Volume (K Unit), by Solution 2024 & 2032
- Figure 89: Middle East & Africa America AI in the Retail Market Revenue Share (%), by Solution 2024 & 2032
- Figure 90: Middle East & Africa America AI in the Retail Market Volume Share (%), by Solution 2024 & 2032
- Figure 91: Middle East & Africa America AI in the Retail Market Revenue (Million), by Application 2024 & 2032
- Figure 92: Middle East & Africa America AI in the Retail Market Volume (K Unit), by Application 2024 & 2032
- Figure 93: Middle East & Africa America AI in the Retail Market Revenue Share (%), by Application 2024 & 2032
- Figure 94: Middle East & Africa America AI in the Retail Market Volume Share (%), by Application 2024 & 2032
- Figure 95: Middle East & Africa America AI in the Retail Market Revenue (Million), by Technology 2024 & 2032
- Figure 96: Middle East & Africa America AI in the Retail Market Volume (K Unit), by Technology 2024 & 2032
- Figure 97: Middle East & Africa America AI in the Retail Market Revenue Share (%), by Technology 2024 & 2032
- Figure 98: Middle East & Africa America AI in the Retail Market Volume Share (%), by Technology 2024 & 2032
- Figure 99: Middle East & Africa America AI in the Retail Market Revenue (Million), by Country 2024 & 2032
- Figure 100: Middle East & Africa America AI in the Retail Market Volume (K Unit), by Country 2024 & 2032
- Figure 101: Middle East & Africa America AI in the Retail Market Revenue Share (%), by Country 2024 & 2032
- Figure 102: Middle East & Africa America AI in the Retail Market Volume Share (%), by Country 2024 & 2032
- Figure 103: Asia Pacific America AI in the Retail Market Revenue (Million), by Channel 2024 & 2032
- Figure 104: Asia Pacific America AI in the Retail Market Volume (K Unit), by Channel 2024 & 2032
- Figure 105: Asia Pacific America AI in the Retail Market Revenue Share (%), by Channel 2024 & 2032
- Figure 106: Asia Pacific America AI in the Retail Market Volume Share (%), by Channel 2024 & 2032
- Figure 107: Asia Pacific America AI in the Retail Market Revenue (Million), by Solution 2024 & 2032
- Figure 108: Asia Pacific America AI in the Retail Market Volume (K Unit), by Solution 2024 & 2032
- Figure 109: Asia Pacific America AI in the Retail Market Revenue Share (%), by Solution 2024 & 2032
- Figure 110: Asia Pacific America AI in the Retail Market Volume Share (%), by Solution 2024 & 2032
- Figure 111: Asia Pacific America AI in the Retail Market Revenue (Million), by Application 2024 & 2032
- Figure 112: Asia Pacific America AI in the Retail Market Volume (K Unit), by Application 2024 & 2032
- Figure 113: Asia Pacific America AI in the Retail Market Revenue Share (%), by Application 2024 & 2032
- Figure 114: Asia Pacific America AI in the Retail Market Volume Share (%), by Application 2024 & 2032
- Figure 115: Asia Pacific America AI in the Retail Market Revenue (Million), by Technology 2024 & 2032
- Figure 116: Asia Pacific America AI in the Retail Market Volume (K Unit), by Technology 2024 & 2032
- Figure 117: Asia Pacific America AI in the Retail Market Revenue Share (%), by Technology 2024 & 2032
- Figure 118: Asia Pacific America AI in the Retail Market Volume Share (%), by Technology 2024 & 2032
- Figure 119: Asia Pacific America AI in the Retail Market Revenue (Million), by Country 2024 & 2032
- Figure 120: Asia Pacific America AI in the Retail Market Volume (K Unit), by Country 2024 & 2032
- Figure 121: Asia Pacific America AI in the Retail Market Revenue Share (%), by Country 2024 & 2032
- Figure 122: Asia Pacific America AI in the Retail Market Volume Share (%), by Country 2024 & 2032
List of Tables
- Table 1: Global America AI in the Retail Market Revenue Million Forecast, by Region 2019 & 2032
- Table 2: Global America AI in the Retail Market Volume K Unit Forecast, by Region 2019 & 2032
- Table 3: Global America AI in the Retail Market Revenue Million Forecast, by Channel 2019 & 2032
- Table 4: Global America AI in the Retail Market Volume K Unit Forecast, by Channel 2019 & 2032
- Table 5: Global America AI in the Retail Market Revenue Million Forecast, by Solution 2019 & 2032
- Table 6: Global America AI in the Retail Market Volume K Unit Forecast, by Solution 2019 & 2032
- Table 7: Global America AI in the Retail Market Revenue Million Forecast, by Application 2019 & 2032
- Table 8: Global America AI in the Retail Market Volume K Unit Forecast, by Application 2019 & 2032
- Table 9: Global America AI in the Retail Market Revenue Million Forecast, by Technology 2019 & 2032
- Table 10: Global America AI in the Retail Market Volume K Unit Forecast, by Technology 2019 & 2032
- Table 11: Global America AI in the Retail Market Revenue Million Forecast, by Region 2019 & 2032
- Table 12: Global America AI in the Retail Market Volume K Unit Forecast, by Region 2019 & 2032
- Table 13: Global America AI in the Retail Market Revenue Million Forecast, by Country 2019 & 2032
- Table 14: Global America AI in the Retail Market Volume K Unit Forecast, by Country 2019 & 2032
- Table 15: America AI in the Retail Market Revenue (Million) Forecast, by Application 2019 & 2032
- Table 16: America AI in the Retail Market Volume (K Unit) Forecast, by Application 2019 & 2032
- Table 17: Global America AI in the Retail Market Revenue Million Forecast, by Country 2019 & 2032
- Table 18: Global America AI in the Retail Market Volume K Unit Forecast, by Country 2019 & 2032
- Table 19: America AI in the Retail Market Revenue (Million) Forecast, by Application 2019 & 2032
- Table 20: America AI in the Retail Market Volume (K Unit) Forecast, by Application 2019 & 2032
- Table 21: Global America AI in the Retail Market Revenue Million Forecast, by Country 2019 & 2032
- Table 22: Global America AI in the Retail Market Volume K Unit Forecast, by Country 2019 & 2032
- Table 23: America AI in the Retail Market Revenue (Million) Forecast, by Application 2019 & 2032
- Table 24: America AI in the Retail Market Volume (K Unit) Forecast, by Application 2019 & 2032
- Table 25: Global America AI in the Retail Market Revenue Million Forecast, by Country 2019 & 2032
- Table 26: Global America AI in the Retail Market Volume K Unit Forecast, by Country 2019 & 2032
- Table 27: America AI in the Retail Market Revenue (Million) Forecast, by Application 2019 & 2032
- Table 28: America AI in the Retail Market Volume (K Unit) Forecast, by Application 2019 & 2032
- Table 29: Global America AI in the Retail Market Revenue Million Forecast, by Country 2019 & 2032
- Table 30: Global America AI in the Retail Market Volume K Unit Forecast, by Country 2019 & 2032
- Table 31: America AI in the Retail Market Revenue (Million) Forecast, by Application 2019 & 2032
- Table 32: America AI in the Retail Market Volume (K Unit) Forecast, by Application 2019 & 2032
- Table 33: Global America AI in the Retail Market Revenue Million Forecast, by Channel 2019 & 2032
- Table 34: Global America AI in the Retail Market Volume K Unit Forecast, by Channel 2019 & 2032
- Table 35: Global America AI in the Retail Market Revenue Million Forecast, by Solution 2019 & 2032
- Table 36: Global America AI in the Retail Market Volume K Unit Forecast, by Solution 2019 & 2032
- Table 37: Global America AI in the Retail Market Revenue Million Forecast, by Application 2019 & 2032
- Table 38: Global America AI in the Retail Market Volume K Unit Forecast, by Application 2019 & 2032
- Table 39: Global America AI in the Retail Market Revenue Million Forecast, by Technology 2019 & 2032
- Table 40: Global America AI in the Retail Market Volume K Unit Forecast, by Technology 2019 & 2032
- Table 41: Global America AI in the Retail Market Revenue Million Forecast, by Country 2019 & 2032
- Table 42: Global America AI in the Retail Market Volume K Unit Forecast, by Country 2019 & 2032
- Table 43: United States America AI in the Retail Market Revenue (Million) Forecast, by Application 2019 & 2032
- Table 44: United States America AI in the Retail Market Volume (K Unit) Forecast, by Application 2019 & 2032
- Table 45: Canada America AI in the Retail Market Revenue (Million) Forecast, by Application 2019 & 2032
- Table 46: Canada America AI in the Retail Market Volume (K Unit) Forecast, by Application 2019 & 2032
- Table 47: Mexico America AI in the Retail Market Revenue (Million) Forecast, by Application 2019 & 2032
- Table 48: Mexico America AI in the Retail Market Volume (K Unit) Forecast, by Application 2019 & 2032
- Table 49: Global America AI in the Retail Market Revenue Million Forecast, by Channel 2019 & 2032
- Table 50: Global America AI in the Retail Market Volume K Unit Forecast, by Channel 2019 & 2032
- Table 51: Global America AI in the Retail Market Revenue Million Forecast, by Solution 2019 & 2032
- Table 52: Global America AI in the Retail Market Volume K Unit Forecast, by Solution 2019 & 2032
- Table 53: Global America AI in the Retail Market Revenue Million Forecast, by Application 2019 & 2032
- Table 54: Global America AI in the Retail Market Volume K Unit Forecast, by Application 2019 & 2032
- Table 55: Global America AI in the Retail Market Revenue Million Forecast, by Technology 2019 & 2032
- Table 56: Global America AI in the Retail Market Volume K Unit Forecast, by Technology 2019 & 2032
- Table 57: Global America AI in the Retail Market Revenue Million Forecast, by Country 2019 & 2032
- Table 58: Global America AI in the Retail Market Volume K Unit Forecast, by Country 2019 & 2032
- Table 59: Brazil America AI in the Retail Market Revenue (Million) Forecast, by Application 2019 & 2032
- Table 60: Brazil America AI in the Retail Market Volume (K Unit) Forecast, by Application 2019 & 2032
- Table 61: Argentina America AI in the Retail Market Revenue (Million) Forecast, by Application 2019 & 2032
- Table 62: Argentina America AI in the Retail Market Volume (K Unit) Forecast, by Application 2019 & 2032
- Table 63: Rest of South America America AI in the Retail Market Revenue (Million) Forecast, by Application 2019 & 2032
- Table 64: Rest of South America America AI in the Retail Market Volume (K Unit) Forecast, by Application 2019 & 2032
- Table 65: Global America AI in the Retail Market Revenue Million Forecast, by Channel 2019 & 2032
- Table 66: Global America AI in the Retail Market Volume K Unit Forecast, by Channel 2019 & 2032
- Table 67: Global America AI in the Retail Market Revenue Million Forecast, by Solution 2019 & 2032
- Table 68: Global America AI in the Retail Market Volume K Unit Forecast, by Solution 2019 & 2032
- Table 69: Global America AI in the Retail Market Revenue Million Forecast, by Application 2019 & 2032
- Table 70: Global America AI in the Retail Market Volume K Unit Forecast, by Application 2019 & 2032
- Table 71: Global America AI in the Retail Market Revenue Million Forecast, by Technology 2019 & 2032
- Table 72: Global America AI in the Retail Market Volume K Unit Forecast, by Technology 2019 & 2032
- Table 73: Global America AI in the Retail Market Revenue Million Forecast, by Country 2019 & 2032
- Table 74: Global America AI in the Retail Market Volume K Unit Forecast, by Country 2019 & 2032
- Table 75: United Kingdom America AI in the Retail Market Revenue (Million) Forecast, by Application 2019 & 2032
- Table 76: United Kingdom America AI in the Retail Market Volume (K Unit) Forecast, by Application 2019 & 2032
- Table 77: Germany America AI in the Retail Market Revenue (Million) Forecast, by Application 2019 & 2032
- Table 78: Germany America AI in the Retail Market Volume (K Unit) Forecast, by Application 2019 & 2032
- Table 79: France America AI in the Retail Market Revenue (Million) Forecast, by Application 2019 & 2032
- Table 80: France America AI in the Retail Market Volume (K Unit) Forecast, by Application 2019 & 2032
- Table 81: Italy America AI in the Retail Market Revenue (Million) Forecast, by Application 2019 & 2032
- Table 82: Italy America AI in the Retail Market Volume (K Unit) Forecast, by Application 2019 & 2032
- Table 83: Spain America AI in the Retail Market Revenue (Million) Forecast, by Application 2019 & 2032
- Table 84: Spain America AI in the Retail Market Volume (K Unit) Forecast, by Application 2019 & 2032
- Table 85: Russia America AI in the Retail Market Revenue (Million) Forecast, by Application 2019 & 2032
- Table 86: Russia America AI in the Retail Market Volume (K Unit) Forecast, by Application 2019 & 2032
- Table 87: Benelux America AI in the Retail Market Revenue (Million) Forecast, by Application 2019 & 2032
- Table 88: Benelux America AI in the Retail Market Volume (K Unit) Forecast, by Application 2019 & 2032
- Table 89: Nordics America AI in the Retail Market Revenue (Million) Forecast, by Application 2019 & 2032
- Table 90: Nordics America AI in the Retail Market Volume (K Unit) Forecast, by Application 2019 & 2032
- Table 91: Rest of Europe America AI in the Retail Market Revenue (Million) Forecast, by Application 2019 & 2032
- Table 92: Rest of Europe America AI in the Retail Market Volume (K Unit) Forecast, by Application 2019 & 2032
- Table 93: Global America AI in the Retail Market Revenue Million Forecast, by Channel 2019 & 2032
- Table 94: Global America AI in the Retail Market Volume K Unit Forecast, by Channel 2019 & 2032
- Table 95: Global America AI in the Retail Market Revenue Million Forecast, by Solution 2019 & 2032
- Table 96: Global America AI in the Retail Market Volume K Unit Forecast, by Solution 2019 & 2032
- Table 97: Global America AI in the Retail Market Revenue Million Forecast, by Application 2019 & 2032
- Table 98: Global America AI in the Retail Market Volume K Unit Forecast, by Application 2019 & 2032
- Table 99: Global America AI in the Retail Market Revenue Million Forecast, by Technology 2019 & 2032
- Table 100: Global America AI in the Retail Market Volume K Unit Forecast, by Technology 2019 & 2032
- Table 101: Global America AI in the Retail Market Revenue Million Forecast, by Country 2019 & 2032
- Table 102: Global America AI in the Retail Market Volume K Unit Forecast, by Country 2019 & 2032
- Table 103: Turkey America AI in the Retail Market Revenue (Million) Forecast, by Application 2019 & 2032
- Table 104: Turkey America AI in the Retail Market Volume (K Unit) Forecast, by Application 2019 & 2032
- Table 105: Israel America AI in the Retail Market Revenue (Million) Forecast, by Application 2019 & 2032
- Table 106: Israel America AI in the Retail Market Volume (K Unit) Forecast, by Application 2019 & 2032
- Table 107: GCC America AI in the Retail Market Revenue (Million) Forecast, by Application 2019 & 2032
- Table 108: GCC America AI in the Retail Market Volume (K Unit) Forecast, by Application 2019 & 2032
- Table 109: North Africa America AI in the Retail Market Revenue (Million) Forecast, by Application 2019 & 2032
- Table 110: North Africa America AI in the Retail Market Volume (K Unit) Forecast, by Application 2019 & 2032
- Table 111: South Africa America AI in the Retail Market Revenue (Million) Forecast, by Application 2019 & 2032
- Table 112: South Africa America AI in the Retail Market Volume (K Unit) Forecast, by Application 2019 & 2032
- Table 113: Rest of Middle East & Africa America AI in the Retail Market Revenue (Million) Forecast, by Application 2019 & 2032
- Table 114: Rest of Middle East & Africa America AI in the Retail Market Volume (K Unit) Forecast, by Application 2019 & 2032
- Table 115: Global America AI in the Retail Market Revenue Million Forecast, by Channel 2019 & 2032
- Table 116: Global America AI in the Retail Market Volume K Unit Forecast, by Channel 2019 & 2032
- Table 117: Global America AI in the Retail Market Revenue Million Forecast, by Solution 2019 & 2032
- Table 118: Global America AI in the Retail Market Volume K Unit Forecast, by Solution 2019 & 2032
- Table 119: Global America AI in the Retail Market Revenue Million Forecast, by Application 2019 & 2032
- Table 120: Global America AI in the Retail Market Volume K Unit Forecast, by Application 2019 & 2032
- Table 121: Global America AI in the Retail Market Revenue Million Forecast, by Technology 2019 & 2032
- Table 122: Global America AI in the Retail Market Volume K Unit Forecast, by Technology 2019 & 2032
- Table 123: Global America AI in the Retail Market Revenue Million Forecast, by Country 2019 & 2032
- Table 124: Global America AI in the Retail Market Volume K Unit Forecast, by Country 2019 & 2032
- Table 125: China America AI in the Retail Market Revenue (Million) Forecast, by Application 2019 & 2032
- Table 126: China America AI in the Retail Market Volume (K Unit) Forecast, by Application 2019 & 2032
- Table 127: India America AI in the Retail Market Revenue (Million) Forecast, by Application 2019 & 2032
- Table 128: India America AI in the Retail Market Volume (K Unit) Forecast, by Application 2019 & 2032
- Table 129: Japan America AI in the Retail Market Revenue (Million) Forecast, by Application 2019 & 2032
- Table 130: Japan America AI in the Retail Market Volume (K Unit) Forecast, by Application 2019 & 2032
- Table 131: South Korea America AI in the Retail Market Revenue (Million) Forecast, by Application 2019 & 2032
- Table 132: South Korea America AI in the Retail Market Volume (K Unit) Forecast, by Application 2019 & 2032
- Table 133: ASEAN America AI in the Retail Market Revenue (Million) Forecast, by Application 2019 & 2032
- Table 134: ASEAN America AI in the Retail Market Volume (K Unit) Forecast, by Application 2019 & 2032
- Table 135: Oceania America AI in the Retail Market Revenue (Million) Forecast, by Application 2019 & 2032
- Table 136: Oceania America AI in the Retail Market Volume (K Unit) Forecast, by Application 2019 & 2032
- Table 137: Rest of Asia Pacific America AI in the Retail Market Revenue (Million) Forecast, by Application 2019 & 2032
- Table 138: Rest of Asia Pacific America AI in the Retail Market Volume (K Unit) Forecast, by Application 2019 & 2032
Frequently Asked Questions
1. What is the projected Compound Annual Growth Rate (CAGR) of the America AI in the Retail Market?
The projected CAGR is approximately 30.00%.
2. Which companies are prominent players in the America AI in the Retail Market?
Key companies in the market include ViSenze Pte Ltd, IBM Corporation, Sentient Technologies Holdings Limited, Google LLC, Salesforce com Inc, Microsoft Corporation, Amazon Web Services Inc, Sophos Inc (Thoma Bravo), Oracle Corporation, SAP SE.
3. What are the main segments of the America AI in the Retail Market?
The market segments include Channel, Solution, Application, Technology.
4. Can you provide details about the market size?
The market size is estimated to be USD XX Million as of 2022.
5. What are some drivers contributing to market growth?
; Hardware Advancement Acting as a Key Enabler for AI in Retail; Disruptive Developments in Retail. including AR. VR. IOT. and New Metrics; Rise of AI First Organizations; Need for Efficiency in Supply Chain Optimization.
6. What are the notable trends driving market growth?
Machine Learning Technology is Expected to Grow Siginificantly.
7. Are there any restraints impacting market growth?
; Lack of Professionals. as well as In-house Knowledge for Cultural Readiness.
8. Can you provide examples of recent developments in the market?
N/A
9. What pricing options are available for accessing the report?
Pricing options include single-user, multi-user, and enterprise licenses priced at USD 3800, USD 4500, and USD 5800 respectively.
10. Is the market size provided in terms of value or volume?
The market size is provided in terms of value, measured in Million and volume, measured in K Unit.
11. Are there any specific market keywords associated with the report?
Yes, the market keyword associated with the report is "America AI in the Retail Market," which aids in identifying and referencing the specific market segment covered.
12. How do I determine which pricing option suits my needs best?
The pricing options vary based on user requirements and access needs. Individual users may opt for single-user licenses, while businesses requiring broader access may choose multi-user or enterprise licenses for cost-effective access to the report.
13. Are there any additional resources or data provided in the America AI in the Retail Market report?
While the report offers comprehensive insights, it's advisable to review the specific contents or supplementary materials provided to ascertain if additional resources or data are available.
14. How can I stay updated on further developments or reports in the America AI in the Retail Market?
To stay informed about further developments, trends, and reports in the America AI in the Retail Market, consider subscribing to industry newsletters, following relevant companies and organizations, or regularly checking reputable industry news sources and publications.
Methodology
Step 1 - Identification of Relevant Samples Size from Population Database


Step 2 - Approaches for Defining Global Market Size (Value, Volume* & Price*)

Note*: In applicable scenarios
Step 3 - Data Sources
Primary Research
- Web Analytics
- Survey Reports
- Research Institute
- Latest Research Reports
- Opinion Leaders
Secondary Research
- Annual Reports
- White Paper
- Latest Press Release
- Industry Association
- Paid Database
- Investor Presentations

Step 4 - Data Triangulation
Involves using different sources of information in order to increase the validity of a study
These sources are likely to be stakeholders in a program - participants, other researchers, program staff, other community members, and so on.
Then we put all data in single framework & apply various statistical tools to find out the dynamic on the market.
During the analysis stage, feedback from the stakeholder groups would be compared to determine areas of agreement as well as areas of divergence


