
Key Insights
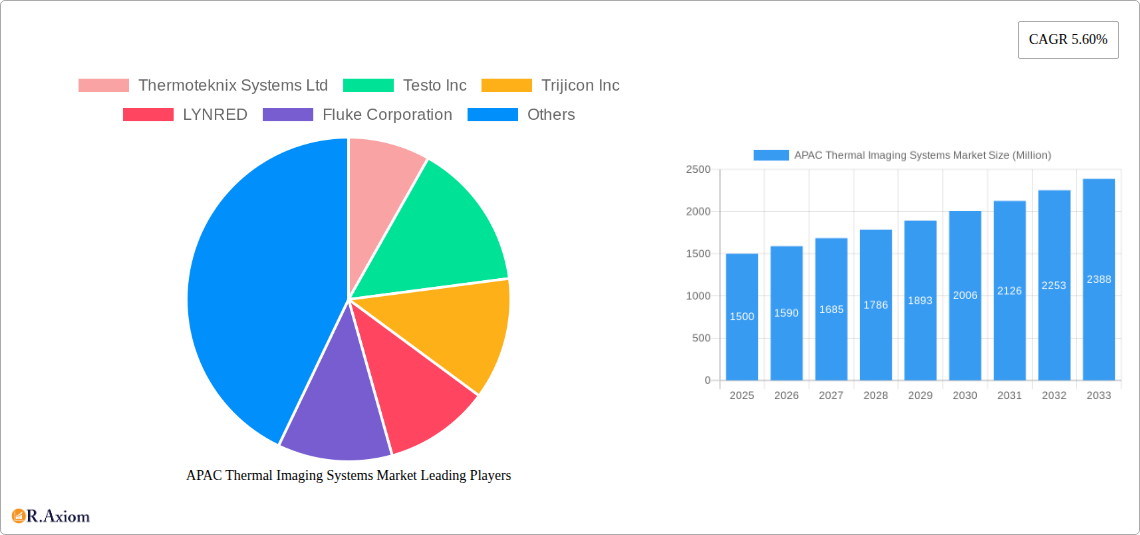
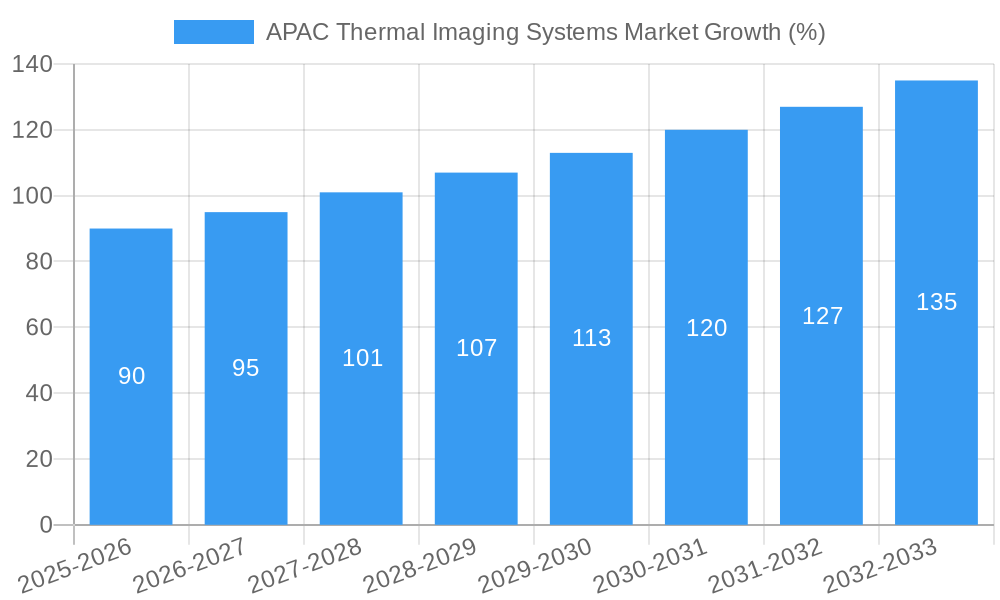
The Asia-Pacific (APAC) thermal imaging systems market is experiencing robust growth, driven by increasing demand across diverse sectors. A 5.60% CAGR suggests a significant expansion from 2019 to 2033. Key application areas fueling this growth include border and coastal surveillance, driven by heightened security concerns and the need for advanced monitoring technologies. The rise of unmanned aerial vehicles (UAVs) or drones necessitates sophisticated thermal imaging solutions for effective C-UAS (counter-unmanned aerial systems) applications and drone detection. Furthermore, the expanding healthcare sector's adoption of thermal imaging for diagnostic purposes and the growing automotive industry's use of advanced driver-assistance systems (ADAS) that incorporate thermal imaging contribute to market expansion. Within APAC, China, Japan, and India are major contributors, reflecting their substantial investments in infrastructure development and technological advancements. The prevalence of handheld imaging devices, owing to their portability and ease of use, further contributes to the market's upward trajectory. However, high initial investment costs for advanced systems and the need for skilled personnel to operate them pose potential restraints to market growth, particularly in smaller enterprises and developing regions within APAC. The market is segmented by end-user vertical (aerospace & defense, law enforcement, etc.), application (thermography, surveillance, etc.), type (handheld, fixed mounted, etc.), and product (thermal cameras, scopes, modules). The competitive landscape includes both established global players and regional manufacturers, leading to innovation and price competition.
The continued growth of the APAC thermal imaging systems market is projected to be influenced by several factors. Government initiatives aimed at improving national security and border control will likely stimulate demand for advanced surveillance systems. Technological advancements, such as improved image resolution, enhanced thermal sensitivity, and the integration of artificial intelligence (AI) for automated target recognition, will drive product innovation and adoption. The increasing affordability of thermal imaging systems, alongside the development of smaller, lighter, and more energy-efficient devices, will expand their accessibility across various applications. However, potential challenges include maintaining the supply chain's stability amidst global economic uncertainties and ensuring the consistent quality of thermal imaging components. Further growth will depend on successful technological advancements that address the limitations of current systems, specifically concerning image quality in adverse weather conditions and expanding the applications to new emerging sectors within APAC.
APAC Thermal Imaging Systems Market: A Comprehensive Report (2019-2033)
This detailed report provides a comprehensive analysis of the Asia-Pacific (APAC) thermal imaging systems market, covering the period from 2019 to 2033. It delves into market dynamics, key players, technological advancements, and future growth prospects, offering invaluable insights for industry stakeholders, investors, and strategic decision-makers. The report leverages extensive market research and data analysis to provide actionable intelligence. The total market size is projected to reach xx Million by 2033.
APAC Thermal Imaging Systems Market Concentration & Innovation
The APAC thermal imaging systems market exhibits a moderately concentrated landscape, with key players like FLIR Systems Inc, Thermoteknix Systems Ltd, Testo Inc, Trijicon Inc, LYNRED, Fluke Corporation, Opgal Optronic Industries Ltd, and Dongguan Xintai Instrument Co Ltd holding significant market share. Market share distribution is dynamic, influenced by factors such as product innovation, technological advancements, and strategic partnerships. The estimated market concentration ratio (CR4) in 2025 is xx%.
- Innovation Drivers: Technological advancements in sensor technology, improved image processing algorithms, miniaturization of components, and the integration of AI/ML capabilities are driving innovation. The development of more robust and energy-efficient thermal imaging systems is another key aspect.
- Regulatory Frameworks: Government regulations related to safety, security, and environmental monitoring significantly impact market growth, especially in sectors like aerospace & defense and law enforcement. Varying regulations across APAC countries need to be considered.
- Product Substitutes: While there are no direct substitutes for thermal imaging systems in many applications, alternative technologies such as advanced visible-light cameras with enhanced low-light capabilities offer some competition in specific niches.
- End-User Trends: Increasing demand for enhanced security, improved preventative maintenance in industrial settings, and growing awareness of thermal imaging applications in healthcare are driving market expansion.
- M&A Activities: The APAC thermal imaging market has witnessed several mergers and acquisitions in recent years, primarily focused on expanding product portfolios, acquiring specialized technologies, and enhancing market reach. The total value of M&A deals between 2019 and 2024 is estimated to be xx Million.
APAC Thermal Imaging Systems Market Industry Trends & Insights
The APAC thermal imaging systems market is experiencing robust growth, driven by a confluence of factors. The market is projected to achieve a Compound Annual Growth Rate (CAGR) of xx% during the forecast period (2025-2033). This growth is fueled by several key factors:
- Increasing adoption across diverse sectors: Applications in aerospace & defense, law enforcement, healthcare, automotive, oil & gas, and manufacturing are driving strong demand.
- Technological advancements: Enhanced image quality, improved resolution, and the integration of advanced features like AI-powered analytics are pushing market expansion.
- Rising security concerns: Growing security concerns in both the public and private sectors are boosting demand for thermal imaging systems for surveillance and security applications.
- Stringent environmental regulations: The need for efficient energy management and environmental monitoring is increasing the use of thermal imaging in various industries.
- Government initiatives: Government investments in infrastructure projects and initiatives to support technological advancements in various sectors are driving market growth. Market penetration in specific segments like automotive is expected to reach xx% by 2033.
The competitive landscape is highly dynamic, with established players and emerging companies competing for market share. Price competitiveness and the introduction of innovative products are shaping the market dynamics.
Dominant Markets & Segments in APAC Thermal Imaging Systems Market
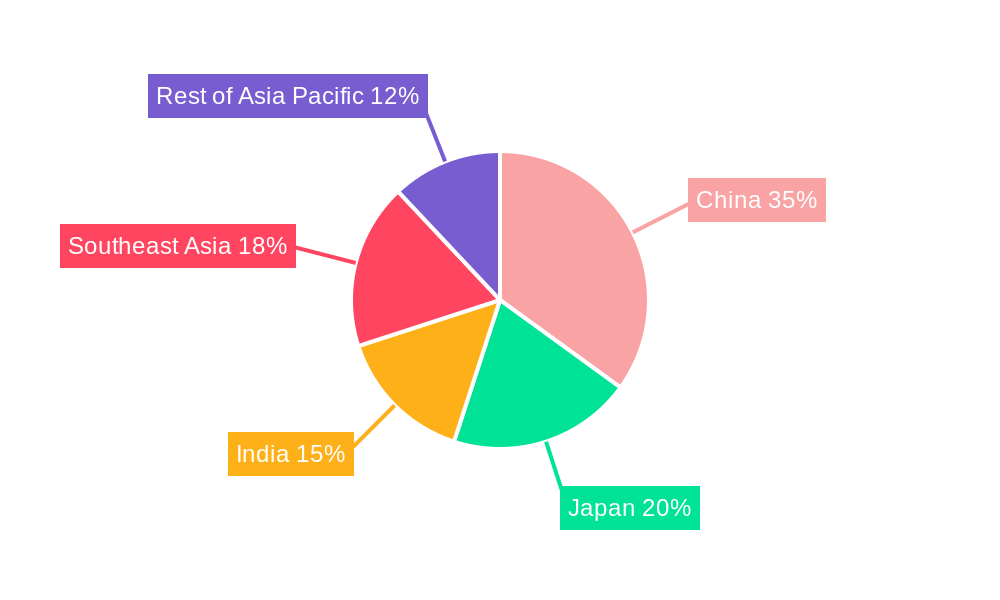
Leading Region: China is expected to be the dominant market in APAC during the forecast period, driven by strong economic growth, increasing infrastructure development, and substantial investments in technology.
Leading Countries: China, Japan, and India represent the largest national markets, collectively accounting for xx% of the total APAC market in 2025.
Dominant End-User Verticals: Aerospace & defense and law enforcement segments are key drivers, followed by growing adoption in the healthcare and automotive sectors. The manufacturing sector is also showing significant growth potential.
Key Application Segments: Thermography, maritime and coastal surveillance, and border surveillance are leading applications. C-UAS/Drones and critical infrastructure monitoring are rapidly gaining traction.
Key Drivers (by region):
- China: Robust economic growth, massive infrastructure projects, increased focus on national security.
- Japan: Advanced technological capabilities, high adoption in industrial applications, focus on safety and security.
- India: Growing industrialization, expanding infrastructure, increasing security needs.
- Southeast Asia: Rising urbanisation, economic development, growing demand for advanced security solutions.
- Rest of APAC: A mix of factors driving growth in different countries, depending on specific needs and infrastructure development.
The dominance of specific segments is influenced by factors such as government policies, economic growth, and technological advancements.
APAC Thermal Imaging Systems Market Product Developments
Recent product developments showcase a trend towards miniaturization, improved image quality, and integration of advanced features. The launch of FLIR's A700f and A500f ruggedized thermal cameras and Lynred's ATI320 thermal imager exemplify this trend. These innovations enhance performance in challenging environments and cater to diverse application needs, increasing market competitiveness.
Report Scope & Segmentation Analysis
This report segments the APAC thermal imaging systems market based on end-user vertical (Aerospace & Defense, Law Enforcement, Healthcare, Automotive, Oil & Gas, Manufacturing, Others), country (China, Japan, India, Southeast Asia, Rest of APAC), application (Thermography, Maritime & Coastal Surveillance, Border Surveillance, C-UAS/Drones, Critical Infrastructure, Others), type (Handheld Imaging Devices & Systems, Fixed Mounted Systems, Thermal Modules), and product (Thermal Camera, Thermal Scope, Thermal Module). Each segment is analyzed in detail, providing growth projections, market sizes, and competitive dynamics. For example, the handheld imaging devices and systems segment is expected to witness significant growth due to its portability and ease of use.
Key Drivers of APAC Thermal Imaging Systems Market Growth
Technological advancements, rising security concerns, increasing infrastructure development, and supportive government policies are key growth drivers. Specific examples include the development of advanced sensor technology, integration of AI-powered analytics, and government investments in national security and infrastructure projects. The growth of the drone industry also significantly contributes to the demand for thermal imaging systems.
Challenges in the APAC Thermal Imaging Systems Market Sector
High initial investment costs, potential supply chain disruptions, intense competition among established and emerging players, and variations in regulatory frameworks across different APAC countries pose significant challenges. These challenges could impact market growth and profitability if not addressed proactively. The estimated impact of supply chain issues on market growth in 2025 is xx%.
Emerging Opportunities in APAC Thermal Imaging Systems Market
Emerging opportunities lie in the increasing adoption of thermal imaging in new applications, such as predictive maintenance in industrial settings, expansion into developing markets, and the integration of thermal imaging with other technologies (e.g., IoT, AI). The development of specialized thermal imaging solutions for specific industries presents substantial growth potential.
Leading Players in the APAC Thermal Imaging Systems Market Market
- Thermoteknix Systems Ltd
- Testo Inc
- Trijicon Inc
- LYNRED
- Fluke Corporation
- Opgal Optronic Industries Ltd
- Flir Systems Inc
- Dongguan Xintai Instrument Co Ltd
Key Developments in APAC Thermal Imaging Systems Market Industry
- June 2021: FLIR launched A700f and A500f ruggedized thermal cameras with on-camera analytics and alarm capabilities for industrial applications.
- August 2021: Lynred launched ATI320, an advanced thermal imager with embedded image signal processing suitable for UAVs and consumer equipment.
These product launches showcase ongoing innovation and expansion of applications within the APAC thermal imaging systems market.
Strategic Outlook for APAC Thermal Imaging Systems Market Market
The APAC thermal imaging systems market holds significant growth potential due to several factors, including continuous technological advancements, the increasing demand across diverse sectors, and favorable government support. Focusing on innovation, strategic partnerships, and expanding into new application areas will be crucial for companies to capitalize on future opportunities. The market is expected to see continued growth and expansion in the coming years.
APAC Thermal Imaging Systems Market Segmentation
-
1. Application
- 1.1. Thermography
- 1.2. Maritime and Costal Surveillance
- 1.3. Border Surveillance
- 1.4. C-UAS/Drones
- 1.5. Critical Infrastructure
- 1.6. Others
-
2. Type
- 2.1. Handheld Imaging Devices and Systems,
- 2.2. Fixed Mounted Systems
- 2.3. Thermal Module
-
3. Product
- 3.1. Thermal Camera
- 3.2. Thermal Scope
- 3.3. Thermal Module
-
4. End-User vertical
- 4.1. Aerospace and Defense
- 4.2. Law Enforcement
- 4.3. Healthcare
- 4.4. Automotive
- 4.5. Oil and Gas
- 4.6. Manufacturing
- 4.7. Others(Residential, Utility, Chemical)
APAC Thermal Imaging Systems Market Segmentation By Geography
-
1. Asia Pacific
- 1.1. China
- 1.2. India
- 1.3. Japan
- 1.4. South Korea
- 1.5. ASEAN
- 1.6. Oceania
- 1.7. Rest of Asia Pacific
APAC Thermal Imaging Systems Market REPORT HIGHLIGHTS
| Aspects | Details |
|---|---|
| Study Period | 2019-2033 |
| Base Year | 2024 |
| Estimated Year | 2025 |
| Forecast Period | 2025-2033 |
| Historical Period | 2019-2024 |
| Growth Rate | CAGR of 5.60% from 2019-2033 |
| Segmentation |
|
Table of Contents
- 1. Introduction
- 1.1. Research Scope
- 1.2. Market Segmentation
- 1.3. Research Methodology
- 1.4. Definitions and Assumptions
- 2. Executive Summary
- 2.1. Introduction
- 3. Market Dynamics
- 3.1. Introduction
- 3.2. Market Drivers
- 3.2.1. 5.1 Reducing Cost of Thermal Imaging Systems has Led to the Adoption Across various End Users5.2 Increasing Spending by Government and Defense Activities
- 3.3. Market Restrains
- 3.3.1. 6.1 Lack of Regular Support and Services
- 3.4. Market Trends
- 3.4.1. Increasing Spending by Government and Defense Activities
- 4. Market Factor Analysis
- 4.1. Porters Five Forces
- 4.2. Supply/Value Chain
- 4.3. PESTEL analysis
- 4.4. Market Entropy
- 4.5. Patent/Trademark Analysis
- 5. Global APAC Thermal Imaging Systems Market Analysis, Insights and Forecast, 2019-2031
- 5.1. Market Analysis, Insights and Forecast - by Application
- 5.1.1. Thermography
- 5.1.2. Maritime and Costal Surveillance
- 5.1.3. Border Surveillance
- 5.1.4. C-UAS/Drones
- 5.1.5. Critical Infrastructure
- 5.1.6. Others
- 5.2. Market Analysis, Insights and Forecast - by Type
- 5.2.1. Handheld Imaging Devices and Systems,
- 5.2.2. Fixed Mounted Systems
- 5.2.3. Thermal Module
- 5.3. Market Analysis, Insights and Forecast - by Product
- 5.3.1. Thermal Camera
- 5.3.2. Thermal Scope
- 5.3.3. Thermal Module
- 5.4. Market Analysis, Insights and Forecast - by End-User vertical
- 5.4.1. Aerospace and Defense
- 5.4.2. Law Enforcement
- 5.4.3. Healthcare
- 5.4.4. Automotive
- 5.4.5. Oil and Gas
- 5.4.6. Manufacturing
- 5.4.7. Others(Residential, Utility, Chemical)
- 5.5. Market Analysis, Insights and Forecast - by Region
- 5.5.1. Asia Pacific
- 5.1. Market Analysis, Insights and Forecast - by Application
- 6. North America APAC Thermal Imaging Systems Market Analysis, Insights and Forecast, 2019-2031
- 6.1. Market Analysis, Insights and Forecast - By Country/Sub-region
- 6.1.1 United States
- 6.1.2 Canada
- 7. Europe APAC Thermal Imaging Systems Market Analysis, Insights and Forecast, 2019-2031
- 7.1. Market Analysis, Insights and Forecast - By Country/Sub-region
- 7.1.1 United Kingdom
- 7.1.2 Germany
- 7.1.3 France
- 7.1.4 Spain
- 7.1.5 Rest of Europe
- 8. Asia Pacific APAC Thermal Imaging Systems Market Analysis, Insights and Forecast, 2019-2031
- 8.1. Market Analysis, Insights and Forecast - By Country/Sub-region
- 8.1.1 China
- 8.1.2 Japan
- 8.1.3 India
- 8.1.4 Rest of Asia Pacific
- 9. Latin America APAC Thermal Imaging Systems Market Analysis, Insights and Forecast, 2019-2031
- 9.1. Market Analysis, Insights and Forecast - By Country/Sub-region
- 9.1.1 Brazil
- 9.1.2 Mexico
- 9.1.3 Rest of Latin America
- 10. Middle East and Africa APAC Thermal Imaging Systems Market Analysis, Insights and Forecast, 2019-2031
- 10.1. Market Analysis, Insights and Forecast - By Country/Sub-region
- 10.1.1.
- 11. Competitive Analysis
- 11.1. Global Market Share Analysis 2024
- 11.2. Company Profiles
- 11.2.1 Thermoteknix Systems Ltd
- 11.2.1.1. Overview
- 11.2.1.2. Products
- 11.2.1.3. SWOT Analysis
- 11.2.1.4. Recent Developments
- 11.2.1.5. Financials (Based on Availability)
- 11.2.2 Testo Inc
- 11.2.2.1. Overview
- 11.2.2.2. Products
- 11.2.2.3. SWOT Analysis
- 11.2.2.4. Recent Developments
- 11.2.2.5. Financials (Based on Availability)
- 11.2.3 Trijicon Inc
- 11.2.3.1. Overview
- 11.2.3.2. Products
- 11.2.3.3. SWOT Analysis
- 11.2.3.4. Recent Developments
- 11.2.3.5. Financials (Based on Availability)
- 11.2.4 LYNRED
- 11.2.4.1. Overview
- 11.2.4.2. Products
- 11.2.4.3. SWOT Analysis
- 11.2.4.4. Recent Developments
- 11.2.4.5. Financials (Based on Availability)
- 11.2.5 Fluke Corporation
- 11.2.5.1. Overview
- 11.2.5.2. Products
- 11.2.5.3. SWOT Analysis
- 11.2.5.4. Recent Developments
- 11.2.5.5. Financials (Based on Availability)
- 11.2.6 Opgal Optronic Industries Ltd
- 11.2.6.1. Overview
- 11.2.6.2. Products
- 11.2.6.3. SWOT Analysis
- 11.2.6.4. Recent Developments
- 11.2.6.5. Financials (Based on Availability)
- 11.2.7 Flir Systems Inc
- 11.2.7.1. Overview
- 11.2.7.2. Products
- 11.2.7.3. SWOT Analysis
- 11.2.7.4. Recent Developments
- 11.2.7.5. Financials (Based on Availability)
- 11.2.8 Dongguan Xintai Instrument Co Ltd
- 11.2.8.1. Overview
- 11.2.8.2. Products
- 11.2.8.3. SWOT Analysis
- 11.2.8.4. Recent Developments
- 11.2.8.5. Financials (Based on Availability)
- 11.2.1 Thermoteknix Systems Ltd
List of Figures
- Figure 1: Global APAC Thermal Imaging Systems Market Revenue Breakdown (Million, %) by Region 2024 & 2032
- Figure 2: North America APAC Thermal Imaging Systems Market Revenue (Million), by Country 2024 & 2032
- Figure 3: North America APAC Thermal Imaging Systems Market Revenue Share (%), by Country 2024 & 2032
- Figure 4: Europe APAC Thermal Imaging Systems Market Revenue (Million), by Country 2024 & 2032
- Figure 5: Europe APAC Thermal Imaging Systems Market Revenue Share (%), by Country 2024 & 2032
- Figure 6: Asia Pacific APAC Thermal Imaging Systems Market Revenue (Million), by Country 2024 & 2032
- Figure 7: Asia Pacific APAC Thermal Imaging Systems Market Revenue Share (%), by Country 2024 & 2032
- Figure 8: Latin America APAC Thermal Imaging Systems Market Revenue (Million), by Country 2024 & 2032
- Figure 9: Latin America APAC Thermal Imaging Systems Market Revenue Share (%), by Country 2024 & 2032
- Figure 10: Middle East and Africa APAC Thermal Imaging Systems Market Revenue (Million), by Country 2024 & 2032
- Figure 11: Middle East and Africa APAC Thermal Imaging Systems Market Revenue Share (%), by Country 2024 & 2032
- Figure 12: Asia Pacific APAC Thermal Imaging Systems Market Revenue (Million), by Application 2024 & 2032
- Figure 13: Asia Pacific APAC Thermal Imaging Systems Market Revenue Share (%), by Application 2024 & 2032
- Figure 14: Asia Pacific APAC Thermal Imaging Systems Market Revenue (Million), by Type 2024 & 2032
- Figure 15: Asia Pacific APAC Thermal Imaging Systems Market Revenue Share (%), by Type 2024 & 2032
- Figure 16: Asia Pacific APAC Thermal Imaging Systems Market Revenue (Million), by Product 2024 & 2032
- Figure 17: Asia Pacific APAC Thermal Imaging Systems Market Revenue Share (%), by Product 2024 & 2032
- Figure 18: Asia Pacific APAC Thermal Imaging Systems Market Revenue (Million), by End-User vertical 2024 & 2032
- Figure 19: Asia Pacific APAC Thermal Imaging Systems Market Revenue Share (%), by End-User vertical 2024 & 2032
- Figure 20: Asia Pacific APAC Thermal Imaging Systems Market Revenue (Million), by Country 2024 & 2032
- Figure 21: Asia Pacific APAC Thermal Imaging Systems Market Revenue Share (%), by Country 2024 & 2032
List of Tables
- Table 1: Global APAC Thermal Imaging Systems Market Revenue Million Forecast, by Region 2019 & 2032
- Table 2: Global APAC Thermal Imaging Systems Market Revenue Million Forecast, by Application 2019 & 2032
- Table 3: Global APAC Thermal Imaging Systems Market Revenue Million Forecast, by Type 2019 & 2032
- Table 4: Global APAC Thermal Imaging Systems Market Revenue Million Forecast, by Product 2019 & 2032
- Table 5: Global APAC Thermal Imaging Systems Market Revenue Million Forecast, by End-User vertical 2019 & 2032
- Table 6: Global APAC Thermal Imaging Systems Market Revenue Million Forecast, by Region 2019 & 2032
- Table 7: Global APAC Thermal Imaging Systems Market Revenue Million Forecast, by Country 2019 & 2032
- Table 8: United States APAC Thermal Imaging Systems Market Revenue (Million) Forecast, by Application 2019 & 2032
- Table 9: Canada APAC Thermal Imaging Systems Market Revenue (Million) Forecast, by Application 2019 & 2032
- Table 10: Global APAC Thermal Imaging Systems Market Revenue Million Forecast, by Country 2019 & 2032
- Table 11: United Kingdom APAC Thermal Imaging Systems Market Revenue (Million) Forecast, by Application 2019 & 2032
- Table 12: Germany APAC Thermal Imaging Systems Market Revenue (Million) Forecast, by Application 2019 & 2032
- Table 13: France APAC Thermal Imaging Systems Market Revenue (Million) Forecast, by Application 2019 & 2032
- Table 14: Spain APAC Thermal Imaging Systems Market Revenue (Million) Forecast, by Application 2019 & 2032
- Table 15: Rest of Europe APAC Thermal Imaging Systems Market Revenue (Million) Forecast, by Application 2019 & 2032
- Table 16: Global APAC Thermal Imaging Systems Market Revenue Million Forecast, by Country 2019 & 2032
- Table 17: China APAC Thermal Imaging Systems Market Revenue (Million) Forecast, by Application 2019 & 2032
- Table 18: Japan APAC Thermal Imaging Systems Market Revenue (Million) Forecast, by Application 2019 & 2032
- Table 19: India APAC Thermal Imaging Systems Market Revenue (Million) Forecast, by Application 2019 & 2032
- Table 20: Rest of Asia Pacific APAC Thermal Imaging Systems Market Revenue (Million) Forecast, by Application 2019 & 2032
- Table 21: Global APAC Thermal Imaging Systems Market Revenue Million Forecast, by Country 2019 & 2032
- Table 22: Brazil APAC Thermal Imaging Systems Market Revenue (Million) Forecast, by Application 2019 & 2032
- Table 23: Mexico APAC Thermal Imaging Systems Market Revenue (Million) Forecast, by Application 2019 & 2032
- Table 24: Rest of Latin America APAC Thermal Imaging Systems Market Revenue (Million) Forecast, by Application 2019 & 2032
- Table 25: Global APAC Thermal Imaging Systems Market Revenue Million Forecast, by Country 2019 & 2032
- Table 26: APAC Thermal Imaging Systems Market Revenue (Million) Forecast, by Application 2019 & 2032
- Table 27: Global APAC Thermal Imaging Systems Market Revenue Million Forecast, by Application 2019 & 2032
- Table 28: Global APAC Thermal Imaging Systems Market Revenue Million Forecast, by Type 2019 & 2032
- Table 29: Global APAC Thermal Imaging Systems Market Revenue Million Forecast, by Product 2019 & 2032
- Table 30: Global APAC Thermal Imaging Systems Market Revenue Million Forecast, by End-User vertical 2019 & 2032
- Table 31: Global APAC Thermal Imaging Systems Market Revenue Million Forecast, by Country 2019 & 2032
- Table 32: China APAC Thermal Imaging Systems Market Revenue (Million) Forecast, by Application 2019 & 2032
- Table 33: India APAC Thermal Imaging Systems Market Revenue (Million) Forecast, by Application 2019 & 2032
- Table 34: Japan APAC Thermal Imaging Systems Market Revenue (Million) Forecast, by Application 2019 & 2032
- Table 35: South Korea APAC Thermal Imaging Systems Market Revenue (Million) Forecast, by Application 2019 & 2032
- Table 36: ASEAN APAC Thermal Imaging Systems Market Revenue (Million) Forecast, by Application 2019 & 2032
- Table 37: Oceania APAC Thermal Imaging Systems Market Revenue (Million) Forecast, by Application 2019 & 2032
- Table 38: Rest of Asia Pacific APAC Thermal Imaging Systems Market Revenue (Million) Forecast, by Application 2019 & 2032
Frequently Asked Questions
1. What is the projected Compound Annual Growth Rate (CAGR) of the APAC Thermal Imaging Systems Market?
The projected CAGR is approximately 5.60%.
2. Which companies are prominent players in the APAC Thermal Imaging Systems Market?
Key companies in the market include Thermoteknix Systems Ltd, Testo Inc, Trijicon Inc, LYNRED, Fluke Corporation, Opgal Optronic Industries Ltd, Flir Systems Inc, Dongguan Xintai Instrument Co Ltd.
3. What are the main segments of the APAC Thermal Imaging Systems Market?
The market segments include Application, Type, Product, End-User vertical.
4. Can you provide details about the market size?
The market size is estimated to be USD XX Million as of 2022.
5. What are some drivers contributing to market growth?
5.1 Reducing Cost of Thermal Imaging Systems has Led to the Adoption Across various End Users5.2 Increasing Spending by Government and Defense Activities.
6. What are the notable trends driving market growth?
Increasing Spending by Government and Defense Activities.
7. Are there any restraints impacting market growth?
6.1 Lack of Regular Support and Services.
8. Can you provide examples of recent developments in the market?
June 2021- FLIR launched A700f and A500f ruggedized thermal cameras that help in detection for extreme environments paired with on-camera analytics and alarm capabilities for industrial applications. In addition, the cameras help industrial organizations to protect assets, minimize maintenance costs and improve safety along with enhanced spot, line, polygon, area, and polyline analytic functions.
9. What pricing options are available for accessing the report?
Pricing options include single-user, multi-user, and enterprise licenses priced at USD 3800, USD 4500, and USD 5800 respectively.
10. Is the market size provided in terms of value or volume?
The market size is provided in terms of value, measured in Million.
11. Are there any specific market keywords associated with the report?
Yes, the market keyword associated with the report is "APAC Thermal Imaging Systems Market," which aids in identifying and referencing the specific market segment covered.
12. How do I determine which pricing option suits my needs best?
The pricing options vary based on user requirements and access needs. Individual users may opt for single-user licenses, while businesses requiring broader access may choose multi-user or enterprise licenses for cost-effective access to the report.
13. Are there any additional resources or data provided in the APAC Thermal Imaging Systems Market report?
While the report offers comprehensive insights, it's advisable to review the specific contents or supplementary materials provided to ascertain if additional resources or data are available.
14. How can I stay updated on further developments or reports in the APAC Thermal Imaging Systems Market?
To stay informed about further developments, trends, and reports in the APAC Thermal Imaging Systems Market, consider subscribing to industry newsletters, following relevant companies and organizations, or regularly checking reputable industry news sources and publications.
Methodology
Step 1 - Identification of Relevant Samples Size from Population Database


Step 2 - Approaches for Defining Global Market Size (Value, Volume* & Price*)

Note*: In applicable scenarios
Step 3 - Data Sources
Primary Research
- Web Analytics
- Survey Reports
- Research Institute
- Latest Research Reports
- Opinion Leaders
Secondary Research
- Annual Reports
- White Paper
- Latest Press Release
- Industry Association
- Paid Database
- Investor Presentations

Step 4 - Data Triangulation
Involves using different sources of information in order to increase the validity of a study
These sources are likely to be stakeholders in a program - participants, other researchers, program staff, other community members, and so on.
Then we put all data in single framework & apply various statistical tools to find out the dynamic on the market.
During the analysis stage, feedback from the stakeholder groups would be compared to determine areas of agreement as well as areas of divergence


