
Key Insights
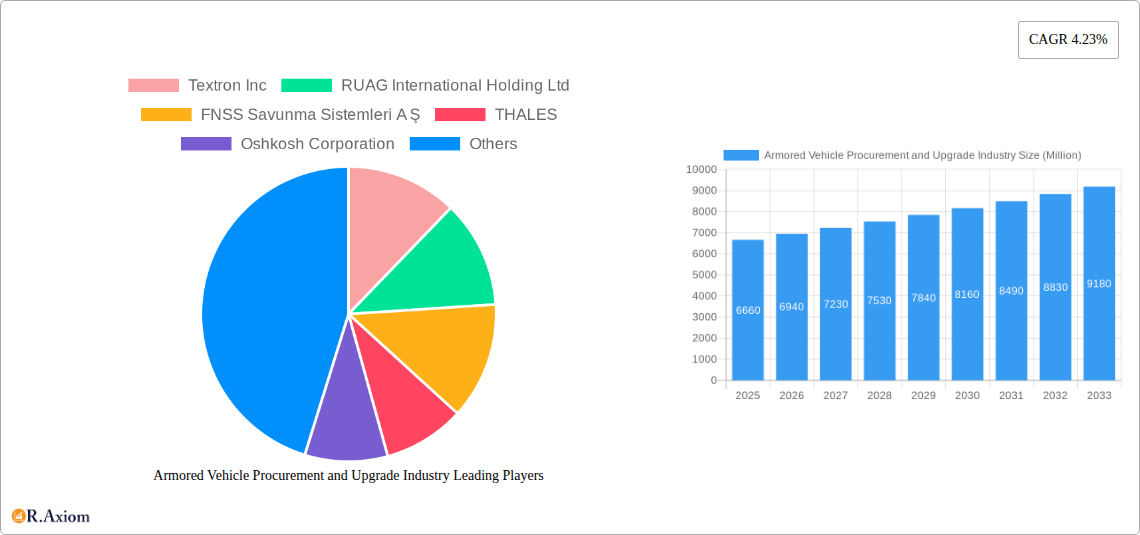
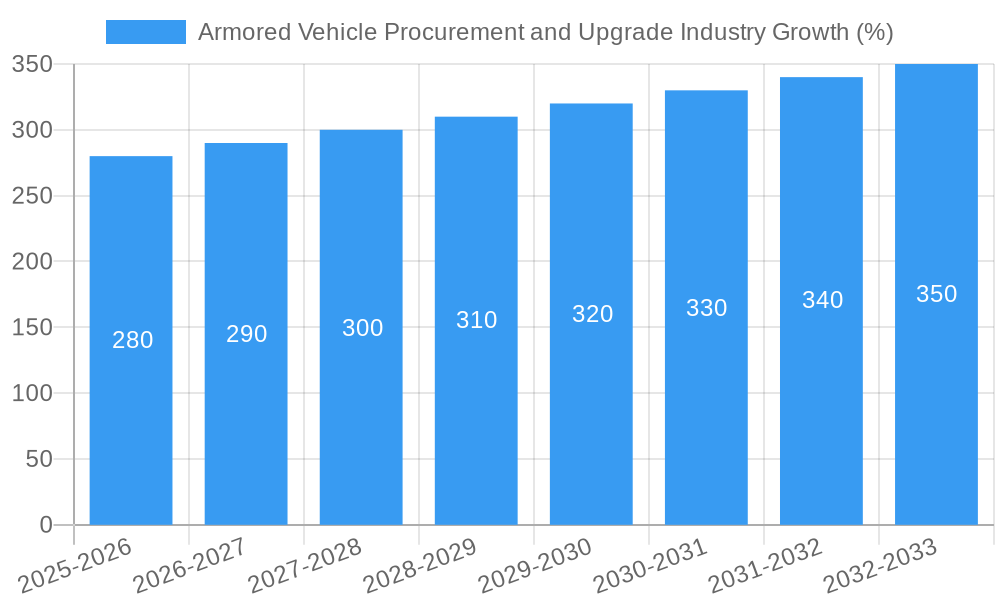
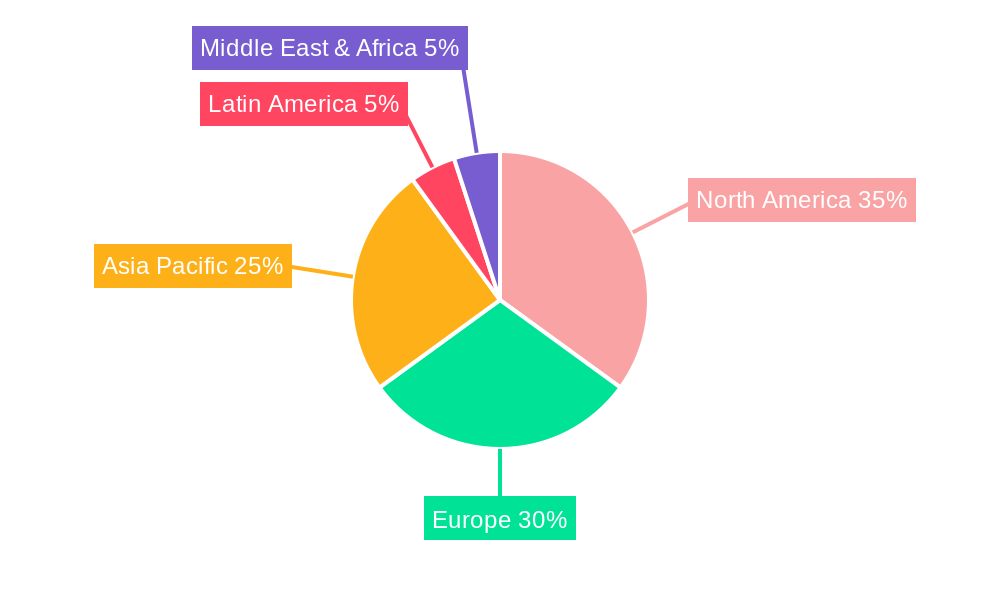
The global armored vehicle procurement and upgrade market is a dynamic sector experiencing steady growth, projected at a Compound Annual Growth Rate (CAGR) of 4.23% from 2025 to 2033. In 2025, the market size reached $6.66 billion. This expansion is driven by escalating geopolitical instability, increasing cross-border tensions, and the ongoing modernization efforts of armed forces worldwide. Demand is particularly strong for advanced vehicles like Mine-resistant Ambush Protected (MRAP) vehicles and Infantry Fighting Vehicles (IFVs), reflecting a prioritization of troop protection and enhanced battlefield capabilities. Technological advancements, such as the integration of advanced sensors, improved communication systems, and enhanced protection features, are further fueling market growth. Key players, including Textron, RUAG, FNSS, Thales, Oshkosh, General Dynamics, Rheinmetall, Elbit Systems, CMI Group, BMC, KNDS, Streit Group, IVECO, and BAE Systems, are actively competing through innovation and strategic partnerships to secure market share. Regional variations exist, with North America and Europe currently dominating the market due to established defense budgets and technological leadership. However, the Asia-Pacific region is expected to witness significant growth in the coming years, driven by increasing defense spending and modernization programs in countries like China and India.
The market faces certain restraints, including high procurement costs for advanced armored vehicles and budget constraints within certain nations. However, the long-term outlook remains positive due to the persistent need for enhanced military capabilities. The market segmentation by vehicle type highlights the diverse needs of various defense forces. The strong demand for APCs, IFVs, and MRAPs showcases the focus on personnel protection and adaptability across various terrains and conflict scenarios. Main Battle Tanks (MBTs) continue to be a crucial element, reflecting the enduring role of heavier armored platforms in conventional warfare. Ongoing technological advancements and the development of hybrid and electric-powered armored vehicles may further reshape the market landscape in the coming years, offering enhanced fuel efficiency and reduced environmental impact. The market's growth is intrinsically linked to global geopolitical stability and defense budgets, thus future projections should be viewed in the context of evolving international relations.
This comprehensive report provides a detailed analysis of the Armored Vehicle Procurement and Upgrade industry, covering the period 2019-2033. It offers in-depth insights into market dynamics, key players, technological advancements, and future growth prospects. This crucial resource is designed for industry stakeholders, investors, and strategic decision-makers seeking a comprehensive understanding of this vital sector.
Armored Vehicle Procurement and Upgrade Industry Market Concentration & Innovation
The Armored Vehicle Procurement and Upgrade industry exhibits a moderately concentrated market structure, with a few major players holding significant market share. The top ten companies—including Textron Inc., RUAG International Holding Ltd, FNSS Savunma Sistemleri A Ş, Thales, Oshkosh Corporation, General Dynamics Corporation, Rheinmetall AG, Elbit Systems Ltd, The CMI Group Inc, and BAE Systems plc—account for approximately xx% of the global market in 2025. Market share is influenced by factors such as technological capabilities, production capacity, and established customer relationships. Innovation is a key driver, fueled by the demand for enhanced protection, mobility, and lethality. Stringent regulatory frameworks, particularly concerning export controls and safety standards, significantly impact the industry. Product substitutes, such as unmanned ground vehicles (UGVs), are gaining traction but have not yet substantially disrupted the market. End-user preferences are increasingly focused on advanced technologies such as AI, autonomous systems, and improved survivability features. Mergers and acquisitions (M&A) activity has been moderate, with deal values averaging around xx Million USD in the last five years. Notable recent acquisitions include [Insert specific example if available, otherwise use xx].
Armored Vehicle Procurement and Upgrade Industry Industry Trends & Insights
The Armored Vehicle Procurement and Upgrade industry is characterized by steady growth, driven by geopolitical instability, increasing defense budgets in key regions, and modernization efforts by armed forces worldwide. The market is projected to witness a Compound Annual Growth Rate (CAGR) of xx% during the forecast period (2025-2033). This growth is primarily attributed to the rising demand for advanced armored vehicles with enhanced protection systems and sophisticated weaponry. Technological disruptions, such as the integration of AI and autonomous features, are reshaping the competitive landscape, leading to increased R&D investments and product differentiation. Consumer preferences are shifting towards lighter, more agile vehicles with improved fuel efficiency and enhanced crew survivability. Competitive dynamics are intense, with major players constantly striving for technological superiority and strategic partnerships to secure market share. Market penetration of advanced technologies like active protection systems (APS) and improved communication systems is expected to reach xx% by 2033.
Dominant Markets & Segments in Armored Vehicle Procurement and Upgrade Industry
The North American and European regions dominate the Armored Vehicle Procurement and Upgrade market, driven by high defense spending and technological advancements. Within vehicle types, Armored Personnel Carriers (APCs) and Infantry Fighting Vehicles (IFVs) constitute the largest segments, followed by Mine-Resistant Ambush Protected (MRAP) vehicles.
- Key Drivers for North America: High defense budgets, technological advancements, strong domestic production capabilities.
- Key Drivers for Europe: Geopolitical instability, modernization efforts, collaborative defense programs.
- APC Dominance: High demand from various military and peacekeeping operations.
- IFV Dominance: Requirement for mechanized infantry support in modern warfare.
The market share distribution among different vehicle types is influenced by specific operational requirements, technological advancements, and budgetary constraints of various armed forces. The continued demand for enhanced protection and firepower will fuel the growth of each segment throughout the forecast period.
Armored Vehicle Procurement and Upgrade Industry Product Developments
Recent innovations focus on lighter weight materials, advanced composite armor, enhanced mobility systems, improved situational awareness technologies (including thermal imaging and advanced sensors), and the integration of directed-energy weapons. These advancements are designed to improve battlefield survivability, operational effectiveness, and overall vehicle performance. Market fit is determined by balancing cost, performance, and operational requirements, while adapting to evolving combat scenarios.
Report Scope & Segmentation Analysis
This report segments the Armored Vehicle Procurement and Upgrade market by vehicle type:
- Armored Personnel Carrier (APC): This segment is projected to witness significant growth due to its versatility and wide applicability in various military and peacekeeping operations. The market is characterized by intense competition, with multiple players offering a range of APC variants. xx Million USD in 2025, projected to reach xx Million USD by 2033.
- Infantry Fighting Vehicle (IFV): This segment represents a substantial portion of the market, driven by the ongoing demand for modernized IFVs with increased firepower and protection capabilities. xx Million USD in 2025, projected to reach xx Million USD by 2033.
- Mine-Resistant Ambush Protected (MRAP): This segment shows moderate growth, driven by continued demand in conflict zones and peacekeeping missions. xx Million USD in 2025, projected to reach xx Million USD by 2033.
- Main Battle Tank (MBT): Growth in this segment is expected to be steady, with a focus on technological upgrades and modernization rather than significant fleet expansion. xx Million USD in 2025, projected to reach xx Million USD by 2033.
- Other Vehicle Types: This segment includes specialized vehicles such as command and control vehicles, recovery vehicles, and engineer vehicles. The growth of this segment will be influenced by specific operational requirements and technological advancements. xx Million USD in 2025, projected to reach xx Million USD by 2033.
Key Drivers of Armored Vehicle Procurement and Upgrade Industry Growth
Several factors drive the growth of the Armored Vehicle Procurement and Upgrade industry. Firstly, geopolitical instability and regional conflicts fuel demand for advanced defense systems, including armored vehicles. Secondly, increasing defense budgets globally, particularly in key regions, provide substantial funding for procurement and modernization programs. Thirdly, technological advancements in armor materials, weapon systems, and vehicle design lead to the development of more effective and efficient armored vehicles.
Challenges in the Armored Vehicle Procurement and Upgrade Industry Sector
The industry faces several challenges. Stringent export controls and regulatory hurdles can impede international trade and collaboration. Supply chain disruptions, particularly concerning specialized components, can impact production timelines and costs. Intense competition among major players necessitates continuous innovation and cost optimization. The high cost of development and procurement can limit adoption in countries with constrained defense budgets. These factors impact profitability and sustainable growth.
Emerging Opportunities in Armored Vehicle Procurement and Upgrade Industry
Emerging opportunities include the development of autonomous or semi-autonomous armored vehicles, the integration of advanced sensor systems and AI for enhanced situational awareness, and the use of lighter weight, more fuel-efficient materials. The growth of new markets in developing economies and the demand for customized solutions present further potential. These opportunities require substantial R&D investments and strategic partnerships to fully realize their potential.
Leading Players in the Armored Vehicle Procurement and Upgrade Industry Market
- Textron Inc
- RUAG International Holding Ltd
- FNSS Savunma Sistemleri A Ş
- THALES
- Oshkosh Corporation
- General Dynamics Corporation
- Rheinmetall AG
- Elbit Systems Ltd
- The CMI Group Inc
- BMC Otomotiv Sanayi ve Ticaret A Ş
- KNDS N V
- Streit Group
- IVECO S p A
- BAE Systems plc
Key Developments in Armored Vehicle Procurement and Upgrade Industry Industry
- May 2023: Elbit Systems Ltd. secured a contract under the British Army's Project Vulcan, significantly expanding its role in UK defense maintenance and training for armored vehicles and tanks. This highlights the importance of integrated training solutions alongside equipment provision.
- May 2023: BAE Systems plc received a USD 2.2 billion contract from the Czech MoD for 246 CV90 Mk IV IFVs, further solidifying the CV90's position in the European market and demonstrating significant market penetration in the IFV segment. The concurrent Slovakian order of 152 vehicles strengthens this trend.
Strategic Outlook for Armored Vehicle Procurement and Upgrade Industry Market
The Armored Vehicle Procurement and Upgrade market is poised for sustained growth, driven by continuous technological advancements, increasing defense spending, and geopolitical instability. The integration of cutting-edge technologies and the development of customized solutions will be crucial for success. Companies focusing on innovation, strategic partnerships, and efficient supply chains are well-positioned to capitalize on the substantial market opportunities anticipated in the coming years.
Armored Vehicle Procurement and Upgrade Industry Segmentation
-
1. Vehicle Type
- 1.1. Armored Personnel Carrier (APC)
- 1.2. Infantry Fighting Vehicle (IFV)
- 1.3. Mine-resistant Ambush Protected (MRAP)
- 1.4. Main Battle Tank (MBT)
- 1.5. Other Vehicle Types
Armored Vehicle Procurement and Upgrade Industry Segmentation By Geography
-
1. North America
- 1.1. United States
- 1.2. Canada
-
2. Europe
- 2.1. United Kingdom
- 2.2. France
- 2.3. Germany
- 2.4. Russia
- 2.5. Rest of Europe
-
3. Asia Pacific
- 3.1. China
- 3.2. India
- 3.3. Japan
- 3.4. South Korea
- 3.5. Australia
- 3.6. Rest of Asia Pacific
-
4. Latin America
- 4.1. Brazil
- 4.2. Mexico
- 4.3. Rest of Latin America
- 5. Middle East
-
6. United Arab Emirates
- 6.1. Saudi Arabia
- 6.2. Turkey
- 6.3. South Africa
- 6.4. Rest of Middle East and Africa
Armored Vehicle Procurement and Upgrade Industry REPORT HIGHLIGHTS
| Aspects | Details |
|---|---|
| Study Period | 2019-2033 |
| Base Year | 2024 |
| Estimated Year | 2025 |
| Forecast Period | 2025-2033 |
| Historical Period | 2019-2024 |
| Growth Rate | CAGR of 4.23% from 2019-2033 |
| Segmentation |
|
Table of Contents
- 1. Introduction
- 1.1. Research Scope
- 1.2. Market Segmentation
- 1.3. Research Methodology
- 1.4. Definitions and Assumptions
- 2. Executive Summary
- 2.1. Introduction
- 3. Market Dynamics
- 3.1. Introduction
- 3.2. Market Drivers
- 3.3. Market Restrains
- 3.4. Market Trends
- 3.4.1. The Infantry Fighting Vehicle Segment to Dominate Market Share
- 4. Market Factor Analysis
- 4.1. Porters Five Forces
- 4.2. Supply/Value Chain
- 4.3. PESTEL analysis
- 4.4. Market Entropy
- 4.5. Patent/Trademark Analysis
- 5. Global Armored Vehicle Procurement and Upgrade Industry Analysis, Insights and Forecast, 2019-2031
- 5.1. Market Analysis, Insights and Forecast - by Vehicle Type
- 5.1.1. Armored Personnel Carrier (APC)
- 5.1.2. Infantry Fighting Vehicle (IFV)
- 5.1.3. Mine-resistant Ambush Protected (MRAP)
- 5.1.4. Main Battle Tank (MBT)
- 5.1.5. Other Vehicle Types
- 5.2. Market Analysis, Insights and Forecast - by Region
- 5.2.1. North America
- 5.2.2. Europe
- 5.2.3. Asia Pacific
- 5.2.4. Latin America
- 5.2.5. Middle East
- 5.2.6. United Arab Emirates
- 5.1. Market Analysis, Insights and Forecast - by Vehicle Type
- 6. North America Armored Vehicle Procurement and Upgrade Industry Analysis, Insights and Forecast, 2019-2031
- 6.1. Market Analysis, Insights and Forecast - by Vehicle Type
- 6.1.1. Armored Personnel Carrier (APC)
- 6.1.2. Infantry Fighting Vehicle (IFV)
- 6.1.3. Mine-resistant Ambush Protected (MRAP)
- 6.1.4. Main Battle Tank (MBT)
- 6.1.5. Other Vehicle Types
- 6.1. Market Analysis, Insights and Forecast - by Vehicle Type
- 7. Europe Armored Vehicle Procurement and Upgrade Industry Analysis, Insights and Forecast, 2019-2031
- 7.1. Market Analysis, Insights and Forecast - by Vehicle Type
- 7.1.1. Armored Personnel Carrier (APC)
- 7.1.2. Infantry Fighting Vehicle (IFV)
- 7.1.3. Mine-resistant Ambush Protected (MRAP)
- 7.1.4. Main Battle Tank (MBT)
- 7.1.5. Other Vehicle Types
- 7.1. Market Analysis, Insights and Forecast - by Vehicle Type
- 8. Asia Pacific Armored Vehicle Procurement and Upgrade Industry Analysis, Insights and Forecast, 2019-2031
- 8.1. Market Analysis, Insights and Forecast - by Vehicle Type
- 8.1.1. Armored Personnel Carrier (APC)
- 8.1.2. Infantry Fighting Vehicle (IFV)
- 8.1.3. Mine-resistant Ambush Protected (MRAP)
- 8.1.4. Main Battle Tank (MBT)
- 8.1.5. Other Vehicle Types
- 8.1. Market Analysis, Insights and Forecast - by Vehicle Type
- 9. Latin America Armored Vehicle Procurement and Upgrade Industry Analysis, Insights and Forecast, 2019-2031
- 9.1. Market Analysis, Insights and Forecast - by Vehicle Type
- 9.1.1. Armored Personnel Carrier (APC)
- 9.1.2. Infantry Fighting Vehicle (IFV)
- 9.1.3. Mine-resistant Ambush Protected (MRAP)
- 9.1.4. Main Battle Tank (MBT)
- 9.1.5. Other Vehicle Types
- 9.1. Market Analysis, Insights and Forecast - by Vehicle Type
- 10. Middle East Armored Vehicle Procurement and Upgrade Industry Analysis, Insights and Forecast, 2019-2031
- 10.1. Market Analysis, Insights and Forecast - by Vehicle Type
- 10.1.1. Armored Personnel Carrier (APC)
- 10.1.2. Infantry Fighting Vehicle (IFV)
- 10.1.3. Mine-resistant Ambush Protected (MRAP)
- 10.1.4. Main Battle Tank (MBT)
- 10.1.5. Other Vehicle Types
- 10.1. Market Analysis, Insights and Forecast - by Vehicle Type
- 11. United Arab Emirates Armored Vehicle Procurement and Upgrade Industry Analysis, Insights and Forecast, 2019-2031
- 11.1. Market Analysis, Insights and Forecast - by Vehicle Type
- 11.1.1. Armored Personnel Carrier (APC)
- 11.1.2. Infantry Fighting Vehicle (IFV)
- 11.1.3. Mine-resistant Ambush Protected (MRAP)
- 11.1.4. Main Battle Tank (MBT)
- 11.1.5. Other Vehicle Types
- 11.1. Market Analysis, Insights and Forecast - by Vehicle Type
- 12. North America Armored Vehicle Procurement and Upgrade Industry Analysis, Insights and Forecast, 2019-2031
- 12.1. Market Analysis, Insights and Forecast - By Country/Sub-region
- 12.1.1 United States
- 12.1.2 Canada
- 13. Europe Armored Vehicle Procurement and Upgrade Industry Analysis, Insights and Forecast, 2019-2031
- 13.1. Market Analysis, Insights and Forecast - By Country/Sub-region
- 13.1.1 United Kingdom
- 13.1.2 France
- 13.1.3 Germany
- 13.1.4 Russia
- 13.1.5 Rest of Europe
- 14. Asia Pacific Armored Vehicle Procurement and Upgrade Industry Analysis, Insights and Forecast, 2019-2031
- 14.1. Market Analysis, Insights and Forecast - By Country/Sub-region
- 14.1.1 China
- 14.1.2 India
- 14.1.3 Japan
- 14.1.4 South Korea
- 14.1.5 Australia
- 14.1.6 Rest of Asia Pacific
- 15. Latin America Armored Vehicle Procurement and Upgrade Industry Analysis, Insights and Forecast, 2019-2031
- 15.1. Market Analysis, Insights and Forecast - By Country/Sub-region
- 15.1.1 Brazil
- 15.1.2 Mexico
- 15.1.3 Rest of Latin America
- 16. Middle East Armored Vehicle Procurement and Upgrade Industry Analysis, Insights and Forecast, 2019-2031
- 16.1. Market Analysis, Insights and Forecast - By Country/Sub-region
- 16.1.1.
- 17. United Arab Emirates Armored Vehicle Procurement and Upgrade Industry Analysis, Insights and Forecast, 2019-2031
- 17.1. Market Analysis, Insights and Forecast - By Country/Sub-region
- 17.1.1 Saudi Arabia
- 17.1.2 Turkey
- 17.1.3 South Africa
- 17.1.4 Rest of Middle East and Africa
- 18. Competitive Analysis
- 18.1. Global Market Share Analysis 2024
- 18.2. Company Profiles
- 18.2.1 Textron Inc
- 18.2.1.1. Overview
- 18.2.1.2. Products
- 18.2.1.3. SWOT Analysis
- 18.2.1.4. Recent Developments
- 18.2.1.5. Financials (Based on Availability)
- 18.2.2 RUAG International Holding Ltd
- 18.2.2.1. Overview
- 18.2.2.2. Products
- 18.2.2.3. SWOT Analysis
- 18.2.2.4. Recent Developments
- 18.2.2.5. Financials (Based on Availability)
- 18.2.3 FNSS Savunma Sistemleri A Ş
- 18.2.3.1. Overview
- 18.2.3.2. Products
- 18.2.3.3. SWOT Analysis
- 18.2.3.4. Recent Developments
- 18.2.3.5. Financials (Based on Availability)
- 18.2.4 THALES
- 18.2.4.1. Overview
- 18.2.4.2. Products
- 18.2.4.3. SWOT Analysis
- 18.2.4.4. Recent Developments
- 18.2.4.5. Financials (Based on Availability)
- 18.2.5 Oshkosh Corporation
- 18.2.5.1. Overview
- 18.2.5.2. Products
- 18.2.5.3. SWOT Analysis
- 18.2.5.4. Recent Developments
- 18.2.5.5. Financials (Based on Availability)
- 18.2.6 General Dynamics Corporation
- 18.2.6.1. Overview
- 18.2.6.2. Products
- 18.2.6.3. SWOT Analysis
- 18.2.6.4. Recent Developments
- 18.2.6.5. Financials (Based on Availability)
- 18.2.7 Rheinmetall AG
- 18.2.7.1. Overview
- 18.2.7.2. Products
- 18.2.7.3. SWOT Analysis
- 18.2.7.4. Recent Developments
- 18.2.7.5. Financials (Based on Availability)
- 18.2.8 Elbit Systems Ltd
- 18.2.8.1. Overview
- 18.2.8.2. Products
- 18.2.8.3. SWOT Analysis
- 18.2.8.4. Recent Developments
- 18.2.8.5. Financials (Based on Availability)
- 18.2.9 The CMI Group Inc
- 18.2.9.1. Overview
- 18.2.9.2. Products
- 18.2.9.3. SWOT Analysis
- 18.2.9.4. Recent Developments
- 18.2.9.5. Financials (Based on Availability)
- 18.2.10 BMC Otomotiv Sanayi ve Ticaret A Ş
- 18.2.10.1. Overview
- 18.2.10.2. Products
- 18.2.10.3. SWOT Analysis
- 18.2.10.4. Recent Developments
- 18.2.10.5. Financials (Based on Availability)
- 18.2.11 KNDS N V
- 18.2.11.1. Overview
- 18.2.11.2. Products
- 18.2.11.3. SWOT Analysis
- 18.2.11.4. Recent Developments
- 18.2.11.5. Financials (Based on Availability)
- 18.2.12 Streit Grou
- 18.2.12.1. Overview
- 18.2.12.2. Products
- 18.2.12.3. SWOT Analysis
- 18.2.12.4. Recent Developments
- 18.2.12.5. Financials (Based on Availability)
- 18.2.13 IVECO S p A
- 18.2.13.1. Overview
- 18.2.13.2. Products
- 18.2.13.3. SWOT Analysis
- 18.2.13.4. Recent Developments
- 18.2.13.5. Financials (Based on Availability)
- 18.2.14 BAE Systems plc
- 18.2.14.1. Overview
- 18.2.14.2. Products
- 18.2.14.3. SWOT Analysis
- 18.2.14.4. Recent Developments
- 18.2.14.5. Financials (Based on Availability)
- 18.2.1 Textron Inc
List of Figures
- Figure 1: Global Armored Vehicle Procurement and Upgrade Industry Revenue Breakdown (Million, %) by Region 2024 & 2032
- Figure 2: North America Armored Vehicle Procurement and Upgrade Industry Revenue (Million), by Country 2024 & 2032
- Figure 3: North America Armored Vehicle Procurement and Upgrade Industry Revenue Share (%), by Country 2024 & 2032
- Figure 4: Europe Armored Vehicle Procurement and Upgrade Industry Revenue (Million), by Country 2024 & 2032
- Figure 5: Europe Armored Vehicle Procurement and Upgrade Industry Revenue Share (%), by Country 2024 & 2032
- Figure 6: Asia Pacific Armored Vehicle Procurement and Upgrade Industry Revenue (Million), by Country 2024 & 2032
- Figure 7: Asia Pacific Armored Vehicle Procurement and Upgrade Industry Revenue Share (%), by Country 2024 & 2032
- Figure 8: Latin America Armored Vehicle Procurement and Upgrade Industry Revenue (Million), by Country 2024 & 2032
- Figure 9: Latin America Armored Vehicle Procurement and Upgrade Industry Revenue Share (%), by Country 2024 & 2032
- Figure 10: Middle East Armored Vehicle Procurement and Upgrade Industry Revenue (Million), by Country 2024 & 2032
- Figure 11: Middle East Armored Vehicle Procurement and Upgrade Industry Revenue Share (%), by Country 2024 & 2032
- Figure 12: United Arab Emirates Armored Vehicle Procurement and Upgrade Industry Revenue (Million), by Country 2024 & 2032
- Figure 13: United Arab Emirates Armored Vehicle Procurement and Upgrade Industry Revenue Share (%), by Country 2024 & 2032
- Figure 14: North America Armored Vehicle Procurement and Upgrade Industry Revenue (Million), by Vehicle Type 2024 & 2032
- Figure 15: North America Armored Vehicle Procurement and Upgrade Industry Revenue Share (%), by Vehicle Type 2024 & 2032
- Figure 16: North America Armored Vehicle Procurement and Upgrade Industry Revenue (Million), by Country 2024 & 2032
- Figure 17: North America Armored Vehicle Procurement and Upgrade Industry Revenue Share (%), by Country 2024 & 2032
- Figure 18: Europe Armored Vehicle Procurement and Upgrade Industry Revenue (Million), by Vehicle Type 2024 & 2032
- Figure 19: Europe Armored Vehicle Procurement and Upgrade Industry Revenue Share (%), by Vehicle Type 2024 & 2032
- Figure 20: Europe Armored Vehicle Procurement and Upgrade Industry Revenue (Million), by Country 2024 & 2032
- Figure 21: Europe Armored Vehicle Procurement and Upgrade Industry Revenue Share (%), by Country 2024 & 2032
- Figure 22: Asia Pacific Armored Vehicle Procurement and Upgrade Industry Revenue (Million), by Vehicle Type 2024 & 2032
- Figure 23: Asia Pacific Armored Vehicle Procurement and Upgrade Industry Revenue Share (%), by Vehicle Type 2024 & 2032
- Figure 24: Asia Pacific Armored Vehicle Procurement and Upgrade Industry Revenue (Million), by Country 2024 & 2032
- Figure 25: Asia Pacific Armored Vehicle Procurement and Upgrade Industry Revenue Share (%), by Country 2024 & 2032
- Figure 26: Latin America Armored Vehicle Procurement and Upgrade Industry Revenue (Million), by Vehicle Type 2024 & 2032
- Figure 27: Latin America Armored Vehicle Procurement and Upgrade Industry Revenue Share (%), by Vehicle Type 2024 & 2032
- Figure 28: Latin America Armored Vehicle Procurement and Upgrade Industry Revenue (Million), by Country 2024 & 2032
- Figure 29: Latin America Armored Vehicle Procurement and Upgrade Industry Revenue Share (%), by Country 2024 & 2032
- Figure 30: Middle East Armored Vehicle Procurement and Upgrade Industry Revenue (Million), by Vehicle Type 2024 & 2032
- Figure 31: Middle East Armored Vehicle Procurement and Upgrade Industry Revenue Share (%), by Vehicle Type 2024 & 2032
- Figure 32: Middle East Armored Vehicle Procurement and Upgrade Industry Revenue (Million), by Country 2024 & 2032
- Figure 33: Middle East Armored Vehicle Procurement and Upgrade Industry Revenue Share (%), by Country 2024 & 2032
- Figure 34: United Arab Emirates Armored Vehicle Procurement and Upgrade Industry Revenue (Million), by Vehicle Type 2024 & 2032
- Figure 35: United Arab Emirates Armored Vehicle Procurement and Upgrade Industry Revenue Share (%), by Vehicle Type 2024 & 2032
- Figure 36: United Arab Emirates Armored Vehicle Procurement and Upgrade Industry Revenue (Million), by Country 2024 & 2032
- Figure 37: United Arab Emirates Armored Vehicle Procurement and Upgrade Industry Revenue Share (%), by Country 2024 & 2032
List of Tables
- Table 1: Global Armored Vehicle Procurement and Upgrade Industry Revenue Million Forecast, by Region 2019 & 2032
- Table 2: Global Armored Vehicle Procurement and Upgrade Industry Revenue Million Forecast, by Vehicle Type 2019 & 2032
- Table 3: Global Armored Vehicle Procurement and Upgrade Industry Revenue Million Forecast, by Region 2019 & 2032
- Table 4: Global Armored Vehicle Procurement and Upgrade Industry Revenue Million Forecast, by Country 2019 & 2032
- Table 5: United States Armored Vehicle Procurement and Upgrade Industry Revenue (Million) Forecast, by Application 2019 & 2032
- Table 6: Canada Armored Vehicle Procurement and Upgrade Industry Revenue (Million) Forecast, by Application 2019 & 2032
- Table 7: Global Armored Vehicle Procurement and Upgrade Industry Revenue Million Forecast, by Country 2019 & 2032
- Table 8: United Kingdom Armored Vehicle Procurement and Upgrade Industry Revenue (Million) Forecast, by Application 2019 & 2032
- Table 9: France Armored Vehicle Procurement and Upgrade Industry Revenue (Million) Forecast, by Application 2019 & 2032
- Table 10: Germany Armored Vehicle Procurement and Upgrade Industry Revenue (Million) Forecast, by Application 2019 & 2032
- Table 11: Russia Armored Vehicle Procurement and Upgrade Industry Revenue (Million) Forecast, by Application 2019 & 2032
- Table 12: Rest of Europe Armored Vehicle Procurement and Upgrade Industry Revenue (Million) Forecast, by Application 2019 & 2032
- Table 13: Global Armored Vehicle Procurement and Upgrade Industry Revenue Million Forecast, by Country 2019 & 2032
- Table 14: China Armored Vehicle Procurement and Upgrade Industry Revenue (Million) Forecast, by Application 2019 & 2032
- Table 15: India Armored Vehicle Procurement and Upgrade Industry Revenue (Million) Forecast, by Application 2019 & 2032
- Table 16: Japan Armored Vehicle Procurement and Upgrade Industry Revenue (Million) Forecast, by Application 2019 & 2032
- Table 17: South Korea Armored Vehicle Procurement and Upgrade Industry Revenue (Million) Forecast, by Application 2019 & 2032
- Table 18: Australia Armored Vehicle Procurement and Upgrade Industry Revenue (Million) Forecast, by Application 2019 & 2032
- Table 19: Rest of Asia Pacific Armored Vehicle Procurement and Upgrade Industry Revenue (Million) Forecast, by Application 2019 & 2032
- Table 20: Global Armored Vehicle Procurement and Upgrade Industry Revenue Million Forecast, by Country 2019 & 2032
- Table 21: Brazil Armored Vehicle Procurement and Upgrade Industry Revenue (Million) Forecast, by Application 2019 & 2032
- Table 22: Mexico Armored Vehicle Procurement and Upgrade Industry Revenue (Million) Forecast, by Application 2019 & 2032
- Table 23: Rest of Latin America Armored Vehicle Procurement and Upgrade Industry Revenue (Million) Forecast, by Application 2019 & 2032
- Table 24: Global Armored Vehicle Procurement and Upgrade Industry Revenue Million Forecast, by Country 2019 & 2032
- Table 25: Armored Vehicle Procurement and Upgrade Industry Revenue (Million) Forecast, by Application 2019 & 2032
- Table 26: Global Armored Vehicle Procurement and Upgrade Industry Revenue Million Forecast, by Country 2019 & 2032
- Table 27: Saudi Arabia Armored Vehicle Procurement and Upgrade Industry Revenue (Million) Forecast, by Application 2019 & 2032
- Table 28: Turkey Armored Vehicle Procurement and Upgrade Industry Revenue (Million) Forecast, by Application 2019 & 2032
- Table 29: South Africa Armored Vehicle Procurement and Upgrade Industry Revenue (Million) Forecast, by Application 2019 & 2032
- Table 30: Rest of Middle East and Africa Armored Vehicle Procurement and Upgrade Industry Revenue (Million) Forecast, by Application 2019 & 2032
- Table 31: Global Armored Vehicle Procurement and Upgrade Industry Revenue Million Forecast, by Vehicle Type 2019 & 2032
- Table 32: Global Armored Vehicle Procurement and Upgrade Industry Revenue Million Forecast, by Country 2019 & 2032
- Table 33: United States Armored Vehicle Procurement and Upgrade Industry Revenue (Million) Forecast, by Application 2019 & 2032
- Table 34: Canada Armored Vehicle Procurement and Upgrade Industry Revenue (Million) Forecast, by Application 2019 & 2032
- Table 35: Global Armored Vehicle Procurement and Upgrade Industry Revenue Million Forecast, by Vehicle Type 2019 & 2032
- Table 36: Global Armored Vehicle Procurement and Upgrade Industry Revenue Million Forecast, by Country 2019 & 2032
- Table 37: United Kingdom Armored Vehicle Procurement and Upgrade Industry Revenue (Million) Forecast, by Application 2019 & 2032
- Table 38: France Armored Vehicle Procurement and Upgrade Industry Revenue (Million) Forecast, by Application 2019 & 2032
- Table 39: Germany Armored Vehicle Procurement and Upgrade Industry Revenue (Million) Forecast, by Application 2019 & 2032
- Table 40: Russia Armored Vehicle Procurement and Upgrade Industry Revenue (Million) Forecast, by Application 2019 & 2032
- Table 41: Rest of Europe Armored Vehicle Procurement and Upgrade Industry Revenue (Million) Forecast, by Application 2019 & 2032
- Table 42: Global Armored Vehicle Procurement and Upgrade Industry Revenue Million Forecast, by Vehicle Type 2019 & 2032
- Table 43: Global Armored Vehicle Procurement and Upgrade Industry Revenue Million Forecast, by Country 2019 & 2032
- Table 44: China Armored Vehicle Procurement and Upgrade Industry Revenue (Million) Forecast, by Application 2019 & 2032
- Table 45: India Armored Vehicle Procurement and Upgrade Industry Revenue (Million) Forecast, by Application 2019 & 2032
- Table 46: Japan Armored Vehicle Procurement and Upgrade Industry Revenue (Million) Forecast, by Application 2019 & 2032
- Table 47: South Korea Armored Vehicle Procurement and Upgrade Industry Revenue (Million) Forecast, by Application 2019 & 2032
- Table 48: Australia Armored Vehicle Procurement and Upgrade Industry Revenue (Million) Forecast, by Application 2019 & 2032
- Table 49: Rest of Asia Pacific Armored Vehicle Procurement and Upgrade Industry Revenue (Million) Forecast, by Application 2019 & 2032
- Table 50: Global Armored Vehicle Procurement and Upgrade Industry Revenue Million Forecast, by Vehicle Type 2019 & 2032
- Table 51: Global Armored Vehicle Procurement and Upgrade Industry Revenue Million Forecast, by Country 2019 & 2032
- Table 52: Brazil Armored Vehicle Procurement and Upgrade Industry Revenue (Million) Forecast, by Application 2019 & 2032
- Table 53: Mexico Armored Vehicle Procurement and Upgrade Industry Revenue (Million) Forecast, by Application 2019 & 2032
- Table 54: Rest of Latin America Armored Vehicle Procurement and Upgrade Industry Revenue (Million) Forecast, by Application 2019 & 2032
- Table 55: Global Armored Vehicle Procurement and Upgrade Industry Revenue Million Forecast, by Vehicle Type 2019 & 2032
- Table 56: Global Armored Vehicle Procurement and Upgrade Industry Revenue Million Forecast, by Country 2019 & 2032
- Table 57: Global Armored Vehicle Procurement and Upgrade Industry Revenue Million Forecast, by Vehicle Type 2019 & 2032
- Table 58: Global Armored Vehicle Procurement and Upgrade Industry Revenue Million Forecast, by Country 2019 & 2032
- Table 59: Saudi Arabia Armored Vehicle Procurement and Upgrade Industry Revenue (Million) Forecast, by Application 2019 & 2032
- Table 60: Turkey Armored Vehicle Procurement and Upgrade Industry Revenue (Million) Forecast, by Application 2019 & 2032
- Table 61: South Africa Armored Vehicle Procurement and Upgrade Industry Revenue (Million) Forecast, by Application 2019 & 2032
- Table 62: Rest of Middle East and Africa Armored Vehicle Procurement and Upgrade Industry Revenue (Million) Forecast, by Application 2019 & 2032
Frequently Asked Questions
1. What is the projected Compound Annual Growth Rate (CAGR) of the Armored Vehicle Procurement and Upgrade Industry?
The projected CAGR is approximately 4.23%.
2. Which companies are prominent players in the Armored Vehicle Procurement and Upgrade Industry?
Key companies in the market include Textron Inc, RUAG International Holding Ltd, FNSS Savunma Sistemleri A Ş, THALES, Oshkosh Corporation, General Dynamics Corporation, Rheinmetall AG, Elbit Systems Ltd, The CMI Group Inc, BMC Otomotiv Sanayi ve Ticaret A Ş, KNDS N V, Streit Grou, IVECO S p A, BAE Systems plc.
3. What are the main segments of the Armored Vehicle Procurement and Upgrade Industry?
The market segments include Vehicle Type.
4. Can you provide details about the market size?
The market size is estimated to be USD 6.66 Million as of 2022.
5. What are some drivers contributing to market growth?
N/A
6. What are the notable trends driving market growth?
The Infantry Fighting Vehicle Segment to Dominate Market Share.
7. Are there any restraints impacting market growth?
N/A
8. Can you provide examples of recent developments in the market?
May 2023: Elbit Systems Ltd. was awarded a contract under the British Army's Project Vulcan to maintain and operate the Ground Manoeuvre Synthetic Trainer system (GMST), the Boxer armored vehicles, and Challenger 3 tanks. The contract includes a training management system with high-fidelity driver trainers and cabins for turret and armament variants.
9. What pricing options are available for accessing the report?
Pricing options include single-user, multi-user, and enterprise licenses priced at USD 4750, USD 5250, and USD 8750 respectively.
10. Is the market size provided in terms of value or volume?
The market size is provided in terms of value, measured in Million.
11. Are there any specific market keywords associated with the report?
Yes, the market keyword associated with the report is "Armored Vehicle Procurement and Upgrade Industry," which aids in identifying and referencing the specific market segment covered.
12. How do I determine which pricing option suits my needs best?
The pricing options vary based on user requirements and access needs. Individual users may opt for single-user licenses, while businesses requiring broader access may choose multi-user or enterprise licenses for cost-effective access to the report.
13. Are there any additional resources or data provided in the Armored Vehicle Procurement and Upgrade Industry report?
While the report offers comprehensive insights, it's advisable to review the specific contents or supplementary materials provided to ascertain if additional resources or data are available.
14. How can I stay updated on further developments or reports in the Armored Vehicle Procurement and Upgrade Industry?
To stay informed about further developments, trends, and reports in the Armored Vehicle Procurement and Upgrade Industry, consider subscribing to industry newsletters, following relevant companies and organizations, or regularly checking reputable industry news sources and publications.
Methodology
Step 1 - Identification of Relevant Samples Size from Population Database


Step 2 - Approaches for Defining Global Market Size (Value, Volume* & Price*)

Note*: In applicable scenarios
Step 3 - Data Sources
Primary Research
- Web Analytics
- Survey Reports
- Research Institute
- Latest Research Reports
- Opinion Leaders
Secondary Research
- Annual Reports
- White Paper
- Latest Press Release
- Industry Association
- Paid Database
- Investor Presentations

Step 4 - Data Triangulation
Involves using different sources of information in order to increase the validity of a study
These sources are likely to be stakeholders in a program - participants, other researchers, program staff, other community members, and so on.
Then we put all data in single framework & apply various statistical tools to find out the dynamic on the market.
During the analysis stage, feedback from the stakeholder groups would be compared to determine areas of agreement as well as areas of divergence


