

Key Insights
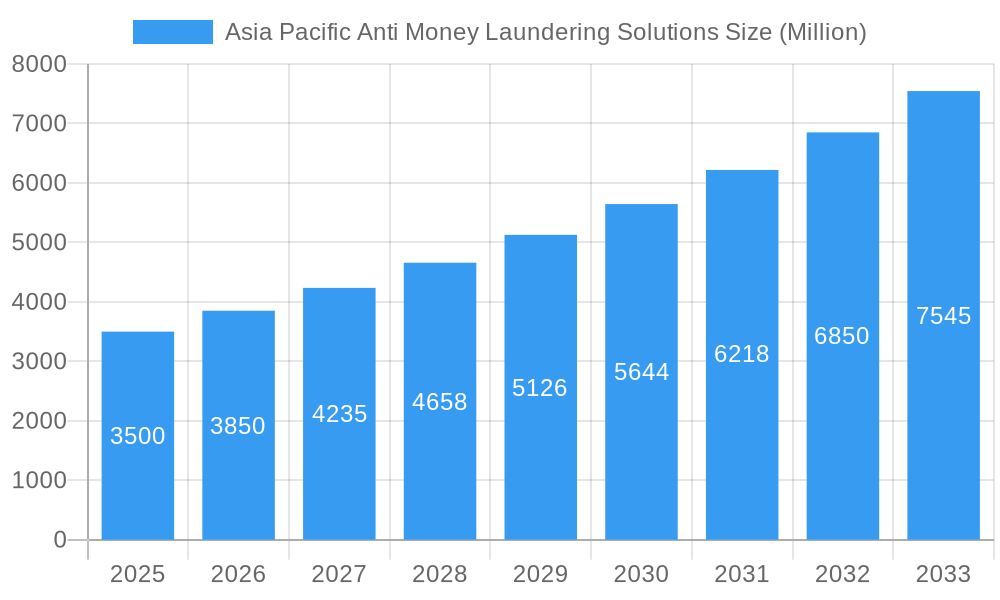
The Asia-Pacific Anti-Money Laundering (AML) solutions market is poised for significant expansion, driven by escalating cross-border financial activity, stringent compliance mandates, and the increasing sophistication of financial crime. The market, valued at $4.13 billion in the base year 2025, is projected to grow at a Compound Annual Growth Rate (CAGR) of 17.8% through 2033. Key growth drivers include the rapid digitalization of financial services, which expands the landscape for illicit activities, compelling the adoption of advanced AML tools. Furthermore, Asia-Pacific governments are intensifying AML regulations and enforcement, pressuring financial institutions to implement robust compliance frameworks. Major markets include China, India, Japan, and Australia, due to their strong financial sectors and regulatory oversight. The software segment is expected to dominate revenue, driven by the integration of AML solutions with existing financial systems. Cloud-based deployments are gaining traction for their scalability and cost-effectiveness. Know Your Customer (KYC) and transaction monitoring solutions are in high demand for identifying suspicious activities. While the Banking, Financial Services, and Insurance (BFSI) sector is the primary adopter, growth is also observed in healthcare and retail.
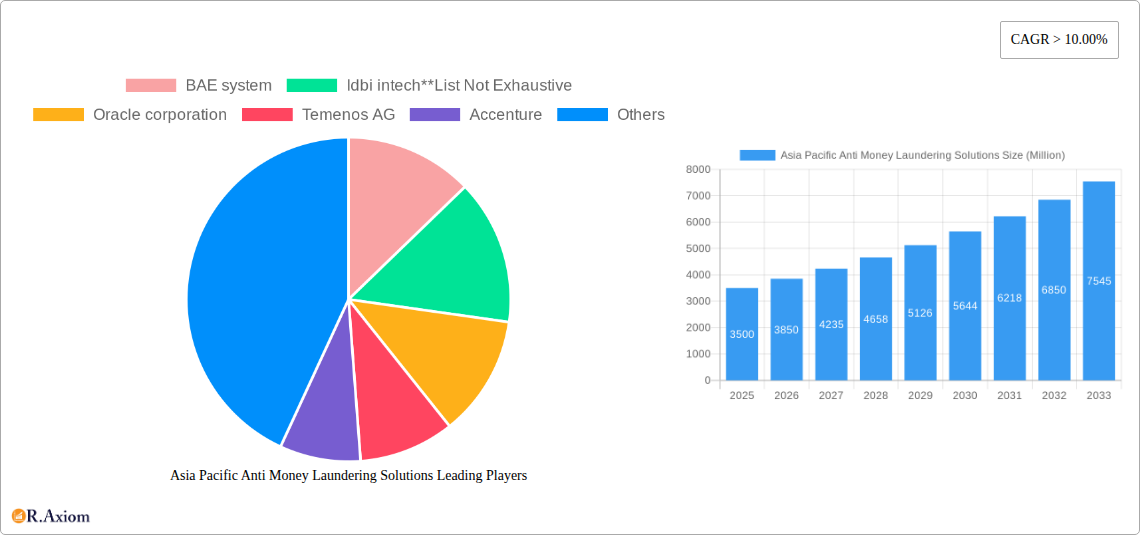
Asia Pacific Anti Money Laundering Solutions Market Size (In Billion)
The competitive environment features established providers like IBM, Oracle, and BAE Systems, alongside specialized firms such as Eastnets and NICE Systems. These companies are investing in R&D to enhance product offerings, incorporating Artificial Intelligence (AI) and machine learning to meet evolving regulatory and technological demands. The rise of fintech and digital payment systems will further stimulate market growth. Potential growth moderation may arise from implementation costs, integration challenges, and the need for continuous regulatory updates. Despite these factors, the long-term outlook for the Asia-Pacific AML solutions market remains highly positive, underscored by the essential need for effective financial crime prevention.
Asia Pacific Anti Money Laundering Solutions Company Market Share
Asia Pacific Anti Money Laundering Solutions Market Report: 2019-2033
This comprehensive report provides an in-depth analysis of the Asia Pacific Anti-Money Laundering (AML) Solutions market, offering invaluable insights for stakeholders across the industry. The study covers the period from 2019 to 2033, with a focus on 2025 as the base and estimated year. The forecast period extends from 2025 to 2033, while the historical period analyzed spans from 2019 to 2024. The market is segmented by country (China, India, Australia, Japan, Singapore, South Korea, Rest of Asia-Pacific), type (Software, Services), deployment (On-premise, Cloud), solution (Know Your Customer (KYC) systems, Compliance reporting, Transaction monitoring, Auditing & reporting, Other solutions), and industry (Healthcare, BFSI, Retail, IT & Telecom, Government & others). The report features analysis of key players like BAE Systems, IDBI Intech, Oracle Corporation, Temenos AG, Accenture, Open Text Corporation, Eastnets, ACI Worldwide, IBM Corporation, SAS Institute, Fiserv, and NICE Systems. The total market value in 2025 is estimated at xx Million.
Asia Pacific Anti Money Laundering Solutions Market Concentration & Innovation
The Asia Pacific AML solutions market exhibits a moderately concentrated landscape, with a few dominant players holding significant market share. In 2025, the top 5 players are estimated to hold approximately 45% of the market, with Oracle, IBM, and Accenture leading the pack. However, the market is experiencing increasing competition from specialized niche players and innovative startups.
Several factors drive innovation within the market:
- Stringent Regulatory Frameworks: Increased regulatory scrutiny and compliance requirements across the region are pushing companies to adopt more sophisticated AML solutions.
- Technological Advancements: The adoption of AI, machine learning, and blockchain technologies is transforming AML processes, leading to more efficient and effective solutions.
- Rising Cyber Threats: The increasing sophistication of financial crimes is driving demand for advanced technologies to detect and prevent money laundering.
Mergers and acquisitions (M&A) activity within the sector has been moderate, with deal values averaging approximately xx Million per transaction in the past five years. Notable deals include (examples would be listed here if data is available, otherwise replace with "Specific deal details are not publicly available"). The market is predicted to see increased consolidation in the coming years as larger players seek to expand their market share and product offerings.
End-user trends indicate a preference for cloud-based solutions due to their scalability, cost-effectiveness, and accessibility. However, concerns around data security and regulatory compliance continue to influence deployment decisions.
Asia Pacific Anti Money Laundering Solutions Industry Trends & Insights
The Asia Pacific (APAC) Anti-Money Laundering (AML) solutions market is on a significant upward trajectory, propelled by a dynamic interplay of economic expansion, evolving regulatory landscapes, and technological advancements. Projections indicate a robust Compound Annual Growth Rate (CAGR) of approximately XX% during the forecast period (2025-2033), with the market anticipated to reach a substantial value of XX Million by 2033. This impressive growth is underpinned by several key drivers:
- Surge in Cross-Border Transactions: The continuous expansion of international trade and an increasing volume of cross-border financial activities inherently elevate the risk of money laundering. Consequently, there is a heightened demand for sophisticated and comprehensive AML solutions to combat these illicit flows effectively.
- Proactive Government Initiatives and Regulatory Stringency: Governments across the APAC region are demonstrating a strong commitment to combating financial crime. This is evidenced by the consistent introduction of more stringent AML regulations, enhanced enforcement mechanisms, and a greater emphasis on compliance, compelling businesses to invest in robust AML frameworks.
- Heightened Awareness of AML Risks: Financial institutions and businesses are increasingly cognizant of the severe financial penalties, reputational damage, and operational disruptions that can arise from non-compliance with AML regulations and succumbing to money laundering activities. This heightened awareness is a significant catalyst for the adoption of advanced AML systems.
- Transformative Technological Disruptions: The rapid evolution and integration of cutting-edge technologies such as Artificial Intelligence (AI), Machine Learning (ML), and blockchain are fundamentally reshaping the AML solutions market. These technologies empower more precise and efficient detection of suspicious activities, anomaly identification, and risk assessment, thereby improving the efficacy of AML efforts.
Market penetration of AML solutions presents a varied picture across the APAC region. More mature economies, including Japan and Australia, generally exhibit higher adoption rates due to well-established regulatory frameworks and a proactive approach to financial crime prevention. Conversely, emerging markets are witnessing accelerated adoption, driven by increasing financial crime rates and supportive government initiatives aimed at strengthening their AML infrastructure. The competitive landscape is characterized by intense rivalry between established global players and innovative, specialized solution providers emerging within the region.
Dominant Markets & Segments in Asia Pacific Anti Money Laundering Solutions
-
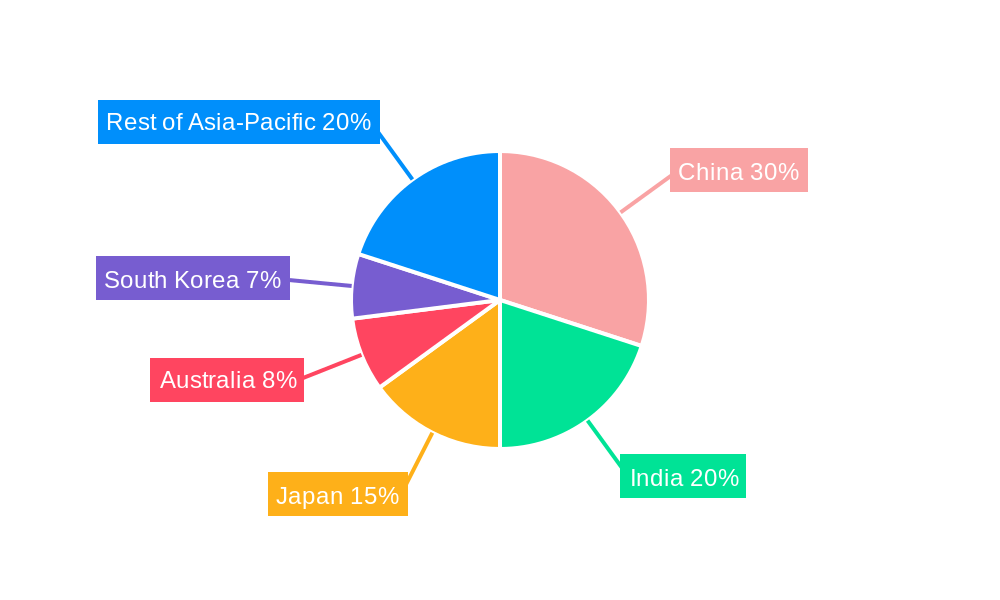
By Country: China and India stand out as the largest markets, largely owing to their massive economies and substantial transaction volumes. Japan and Australia also command significant market share, benefiting from advanced regulatory frameworks and high AML solution adoption rates.
-
By Type: Software solutions currently lead the market due to their inherent versatility, scalability, and ability to integrate advanced functionalities. Services, including implementation, customization, training, and ongoing maintenance, also play a crucial role, contributing substantially to the overall market value.
-
By Deployment: Cloud-based deployment models are rapidly gaining prominence, progressively surpassing traditional on-premise solutions. This shift is driven by the appeal of greater flexibility, reduced upfront costs, enhanced scalability, and easier accessibility offered by cloud platforms.
-
By Solution: Transaction monitoring systems continue to hold the largest market share, forming the cornerstone of AML compliance. Know Your Customer (KYC) and customer due diligence (CDD) systems are also critical, followed by compliance reporting solutions. There is a growing demand for advanced auditing tools and risk assessment platforms.
-
By Industry: The Banking, Financial Services, and Insurance (BFSI) sector remains the largest contributor to the AML solutions market, owing to its inherent susceptibility to money laundering activities and stringent regulatory oversight. However, other sectors, including retail, healthcare, and government agencies, are increasingly recognizing the importance of AML compliance and are expanding their adoption of these solutions.
China's market leadership is a testament to its vast financial ecosystem and robust regulatory enforcement. India's rapid growth is being propelled by its digital transformation initiatives and a burgeoning volume of financial transactions. Australia and Japan's strong performance is attributable to their mature financial markets and sophisticated regulatory compliance environments.
Asia Pacific Anti Money Laundering Solutions Product Developments
Recent product innovations in the APAC AML solutions market are heavily focused on the integration of Artificial Intelligence (AI) and Machine Learning (ML) to significantly enhance the efficacy of transaction monitoring and Know Your Customer (KYC) processes. These advanced capabilities enable real-time analysis of massive datasets, leading to more accurate identification of suspicious patterns and a marked reduction in false positives. The trend towards cloud-based solutions is also a significant development, offering improved scalability, accessibility, and cost-effectiveness. Furthermore, specialized solutions are being developed to cater to the unique AML challenges faced by specific industries. Competitive advantage in this evolving market is increasingly determined by the accuracy, speed, and user-friendliness of these solutions, empowering businesses to navigate complex regulatory landscapes and effectively mitigate AML risks.
Report Scope & Segmentation Analysis
This comprehensive report delves into the entirety of the Asia-Pacific AML solutions market, offering in-depth segmentation by country, type, deployment model, solution category, and industry vertical. Detailed analysis includes growth projections, market size estimations, and a thorough examination of the competitive landscape for each segment. For example, the software solutions segment is projected to experience a higher growth rate compared to services, primarily due to rapid technological advancements and the escalating demand for sophisticated features. The cloud deployment segment is anticipated to witness exponential growth, fueled by the inherent advantages of scalability and cost efficiency.
Within the solution categories, KYC and customer due diligence systems are expected to exhibit significant growth, driven by increasing regulatory scrutiny and the imperative for thorough customer vetting. The BFSI sector will continue to be a primary driver of market expansion, although adoption rates in other key industries are steadily on the rise.
Key Drivers of Asia Pacific Anti Money Laundering Solutions Growth
The growth of the Asia Pacific AML solutions market is primarily driven by:
- Strengthening Regulatory Environment: Governments are enacting stricter AML regulations to combat financial crimes, driving demand for compliant solutions.
- Technological Advancements: AI, machine learning, and blockchain technologies enhance AML solutions' effectiveness and efficiency.
- Rising Financial Crime Rates: The increasing sophistication of financial crimes necessitates more advanced AML solutions to detect and prevent them.
- Increased Cross-border Transactions: Globalization and the growth of e-commerce increase the risk of money laundering, spurring demand for AML solutions.
Challenges in the Asia Pacific Anti Money Laundering Solutions Sector
The Asia Pacific AML solutions sector faces challenges, including:
- Data Privacy Concerns: Balancing the need for effective AML monitoring with data privacy regulations presents a significant hurdle.
- High Implementation Costs: Implementing sophisticated AML solutions can be expensive, particularly for smaller businesses.
- Skills Gap: A shortage of skilled professionals to manage and maintain complex AML systems hinders widespread adoption.
- Integration Complexity: Integrating AML solutions with existing systems can be challenging and time-consuming.
Emerging Opportunities in Asia Pacific Anti Money Laundering Solutions
Opportunities exist in:
- Expansion into Underserved Markets: Many smaller economies in the Asia-Pacific region have limited AML infrastructure, presenting significant growth potential.
- Development of Specialized Solutions: Tailoring AML solutions to meet the specific needs of different industries can create new market opportunities.
- Integration of Emerging Technologies: Further integrating AI, blockchain, and other emerging technologies will lead to more efficient and effective AML solutions.
- Growth in Cloud-Based Solutions: The growing demand for flexible and scalable solutions increases opportunities for cloud-based providers.
Leading Players in the Asia Pacific Anti Money Laundering Solutions Market
Key Developments in Asia Pacific Anti Money Laundering Solutions Industry
- 2022-Q4: Oracle launched a new AI-powered AML solution designed to enhance threat detection and compliance.
- 2023-Q1: Accenture strategically acquired a specialized AML consultancy firm to bolster its compliance and risk management services in the region.
- 2023-Q3: Singapore implemented new, more stringent regulations aimed at strengthening AML and Counter-Terrorist Financing (CTF) frameworks, impacting the requirements for AML solutions in the country.
- 2024-Q1: A leading fintech company in India unveiled a new blockchain-based KYC solution to streamline onboarding processes and enhance security.
- Ongoing: Significant investment continues in R&D for predictive analytics and anomaly detection capabilities within AML software.
Strategic Outlook for Asia Pacific Anti Money Laundering Solutions Market
The Asia Pacific AML solutions market exhibits significant growth potential, driven by evolving regulatory landscapes, technological advancements, and rising financial crime rates. The increasing adoption of cloud-based solutions and the integration of AI and machine learning capabilities will further enhance market dynamics. The market is poised for continued expansion, with opportunities for both established players and emerging innovators. Focusing on specialized solutions tailored to specific industries and expanding into underserved markets will be key to success.
Asia Pacific Anti Money Laundering Solutions Segmentation
-
1. Type
- 1.1. Software
- 1.2. Services
-
2. Deployment
- 2.1. On-premise
- 2.2. cloud
-
3. Solution
- 3.1. Know your customer systems
- 3.2. Compliance reporting
- 3.3. Transaction monitoring
- 3.4. Auditing & reporting
- 3.5. Other solutions
-
4. Industry
- 4.1. Healthcare
- 4.2. BFSI
- 4.3. Retail
- 4.4. IT & telecom
- 4.5. Government & others
Asia Pacific Anti Money Laundering Solutions Segmentation By Geography
-
1. Asia Pacific
- 1.1. China
- 1.2. Japan
- 1.3. South Korea
- 1.4. India
- 1.5. Australia
- 1.6. New Zealand
- 1.7. Indonesia
- 1.8. Malaysia
- 1.9. Singapore
- 1.10. Thailand
- 1.11. Vietnam
- 1.12. Philippines
Asia Pacific Anti Money Laundering Solutions Regional Market Share
Geographic Coverage of Asia Pacific Anti Money Laundering Solutions
Asia Pacific Anti Money Laundering Solutions REPORT HIGHLIGHTS
| Aspects | Details |
|---|---|
| Study Period | 2020-2034 |
| Base Year | 2025 |
| Estimated Year | 2026 |
| Forecast Period | 2026-2034 |
| Historical Period | 2020-2025 |
| Growth Rate | CAGR of 17.8% from 2020-2034 |
| Segmentation |
|
Table of Contents
- 1. Introduction
- 1.1. Research Scope
- 1.2. Market Segmentation
- 1.3. Research Objective
- 1.4. Definitions and Assumptions
- 2. Executive Summary
- 2.1. Market Snapshot
- 3. Market Dynamics
- 3.1. Market Drivers
- 3.2. Market Restrains
- 3.3. Market Trends
- 3.4. Market Opportunities
- 4. Market Factor Analysis
- 4.1. Porters Five Forces
- 4.1.1. Bargaining Power of Suppliers
- 4.1.2. Bargaining Power of Buyers
- 4.1.3. Threat of New Entrants
- 4.1.4. Threat of Substitutes
- 4.1.5. Competitive Rivalry
- 4.2. PESTEL analysis
- 4.3. BCG Analysis
- 4.3.1. Stars (High Growth, High Market Share)
- 4.3.2. Cash Cows (Low Growth, High Market Share)
- 4.3.3. Question Mark (High Growth, Low Market Share)
- 4.3.4. Dogs (Low Growth, Low Market Share)
- 4.4. Ansoff Matrix Analysis
- 4.5. Supply Chain Analysis
- 4.6. Regulatory Landscape
- 4.7. Current Market Potential and Opportunity Assessment (TAM–SAM–SOM Framework)
- 4.8. RAX Analyst Note
- 4.1. Porters Five Forces
- 5. Market Analysis, Insights and Forecast 2021-2033
- 5.1. Market Analysis, Insights and Forecast - by Type
- 5.1.1. Software
- 5.1.2. Services
- 5.2. Market Analysis, Insights and Forecast - by Deployment
- 5.2.1. On-premise
- 5.2.2. cloud
- 5.3. Market Analysis, Insights and Forecast - by Solution
- 5.3.1. Know your customer systems
- 5.3.2. Compliance reporting
- 5.3.3. Transaction monitoring
- 5.3.4. Auditing & reporting
- 5.3.5. Other solutions
- 5.4. Market Analysis, Insights and Forecast - by Industry
- 5.4.1. Healthcare
- 5.4.2. BFSI
- 5.4.3. Retail
- 5.4.4. IT & telecom
- 5.4.5. Government & others
- 5.5. Market Analysis, Insights and Forecast - by Region
- 5.5.1. Asia Pacific
- 5.1. Market Analysis, Insights and Forecast - by Type
- 6. Asia Pacific Anti Money Laundering Solutions Analysis, Insights and Forecast, 2021-2033
- 6.1. Market Analysis, Insights and Forecast - by Type
- 6.1.1. Software
- 6.1.2. Services
- 6.2. Market Analysis, Insights and Forecast - by Deployment
- 6.2.1. On-premise
- 6.2.2. cloud
- 6.3. Market Analysis, Insights and Forecast - by Solution
- 6.3.1. Know your customer systems
- 6.3.2. Compliance reporting
- 6.3.3. Transaction monitoring
- 6.3.4. Auditing & reporting
- 6.3.5. Other solutions
- 6.4. Market Analysis, Insights and Forecast - by Industry
- 6.4.1. Healthcare
- 6.4.2. BFSI
- 6.4.3. Retail
- 6.4.4. IT & telecom
- 6.4.5. Government & others
- 6.1. Market Analysis, Insights and Forecast - by Type
- 7. Competitive Analysis
- 7.1. Company Profiles
- 7.1.1 BAE system
- 7.1.1.1. Company Overview
- 7.1.1.2. Products
- 7.1.1.3. Company Financials
- 7.1.1.4. SWOT Analysis
- 7.1.2 Idbi intech**List Not Exhaustive
- 7.1.2.1. Company Overview
- 7.1.2.2. Products
- 7.1.2.3. Company Financials
- 7.1.2.4. SWOT Analysis
- 7.1.3 Oracle corporation
- 7.1.3.1. Company Overview
- 7.1.3.2. Products
- 7.1.3.3. Company Financials
- 7.1.3.4. SWOT Analysis
- 7.1.4 Temenos AG
- 7.1.4.1. Company Overview
- 7.1.4.2. Products
- 7.1.4.3. Company Financials
- 7.1.4.4. SWOT Analysis
- 7.1.5 Accenture
- 7.1.5.1. Company Overview
- 7.1.5.2. Products
- 7.1.5.3. Company Financials
- 7.1.5.4. SWOT Analysis
- 7.1.6 Open text corporation
- 7.1.6.1. Company Overview
- 7.1.6.2. Products
- 7.1.6.3. Company Financials
- 7.1.6.4. SWOT Analysis
- 7.1.7 eastnets
- 7.1.7.1. Company Overview
- 7.1.7.2. Products
- 7.1.7.3. Company Financials
- 7.1.7.4. SWOT Analysis
- 7.1.8 ACI worldwide
- 7.1.8.1. Company Overview
- 7.1.8.2. Products
- 7.1.8.3. Company Financials
- 7.1.8.4. SWOT Analysis
- 7.1.9 IBM corporation
- 7.1.9.1. Company Overview
- 7.1.9.2. Products
- 7.1.9.3. Company Financials
- 7.1.9.4. SWOT Analysis
- 7.1.10 SAS Institute
- 7.1.10.1. Company Overview
- 7.1.10.2. Products
- 7.1.10.3. Company Financials
- 7.1.10.4. SWOT Analysis
- 7.1.11 Fiserv
- 7.1.11.1. Company Overview
- 7.1.11.2. Products
- 7.1.11.3. Company Financials
- 7.1.11.4. SWOT Analysis
- 7.1.12 NICE systems
- 7.1.12.1. Company Overview
- 7.1.12.2. Products
- 7.1.12.3. Company Financials
- 7.1.12.4. SWOT Analysis
- 7.1.1 BAE system
- 7.2. Market Entropy
- 7.2.1 Company's Key Areas Served
- 7.2.2 Recent Developments
- 7.3. Company Market Share Analysis 2025
- 7.3.1 Top 5 Companies Market Share Analysis
- 7.3.2 Top 3 Companies Market Share Analysis
- 7.4. List of Potential Customers
- 8. Research Methodology
List of Figures
- Figure 1: Asia Pacific Anti Money Laundering Solutions Revenue Breakdown (billion, %) by Product 2025 & 2033
- Figure 2: Asia Pacific Anti Money Laundering Solutions Share (%) by Company 2025
List of Tables
- Table 1: Asia Pacific Anti Money Laundering Solutions Revenue billion Forecast, by Type 2020 & 2033
- Table 2: Asia Pacific Anti Money Laundering Solutions Revenue billion Forecast, by Deployment 2020 & 2033
- Table 3: Asia Pacific Anti Money Laundering Solutions Revenue billion Forecast, by Solution 2020 & 2033
- Table 4: Asia Pacific Anti Money Laundering Solutions Revenue billion Forecast, by Industry 2020 & 2033
- Table 5: Asia Pacific Anti Money Laundering Solutions Revenue billion Forecast, by Region 2020 & 2033
- Table 6: Asia Pacific Anti Money Laundering Solutions Revenue billion Forecast, by Type 2020 & 2033
- Table 7: Asia Pacific Anti Money Laundering Solutions Revenue billion Forecast, by Deployment 2020 & 2033
- Table 8: Asia Pacific Anti Money Laundering Solutions Revenue billion Forecast, by Solution 2020 & 2033
- Table 9: Asia Pacific Anti Money Laundering Solutions Revenue billion Forecast, by Industry 2020 & 2033
- Table 10: Asia Pacific Anti Money Laundering Solutions Revenue billion Forecast, by Country 2020 & 2033
- Table 11: China Asia Pacific Anti Money Laundering Solutions Revenue (billion) Forecast, by Application 2020 & 2033
- Table 12: Japan Asia Pacific Anti Money Laundering Solutions Revenue (billion) Forecast, by Application 2020 & 2033
- Table 13: South Korea Asia Pacific Anti Money Laundering Solutions Revenue (billion) Forecast, by Application 2020 & 2033
- Table 14: India Asia Pacific Anti Money Laundering Solutions Revenue (billion) Forecast, by Application 2020 & 2033
- Table 15: Australia Asia Pacific Anti Money Laundering Solutions Revenue (billion) Forecast, by Application 2020 & 2033
- Table 16: New Zealand Asia Pacific Anti Money Laundering Solutions Revenue (billion) Forecast, by Application 2020 & 2033
- Table 17: Indonesia Asia Pacific Anti Money Laundering Solutions Revenue (billion) Forecast, by Application 2020 & 2033
- Table 18: Malaysia Asia Pacific Anti Money Laundering Solutions Revenue (billion) Forecast, by Application 2020 & 2033
- Table 19: Singapore Asia Pacific Anti Money Laundering Solutions Revenue (billion) Forecast, by Application 2020 & 2033
- Table 20: Thailand Asia Pacific Anti Money Laundering Solutions Revenue (billion) Forecast, by Application 2020 & 2033
- Table 21: Vietnam Asia Pacific Anti Money Laundering Solutions Revenue (billion) Forecast, by Application 2020 & 2033
- Table 22: Philippines Asia Pacific Anti Money Laundering Solutions Revenue (billion) Forecast, by Application 2020 & 2033
Frequently Asked Questions
1. What is the projected Compound Annual Growth Rate (CAGR) of the Asia Pacific Anti Money Laundering Solutions?
The projected CAGR is approximately 17.8%.
2. Which companies are prominent players in the Asia Pacific Anti Money Laundering Solutions?
Key companies in the market include BAE system, Idbi intech**List Not Exhaustive, Oracle corporation, Temenos AG, Accenture, Open text corporation, eastnets, ACI worldwide, IBM corporation, SAS Institute, Fiserv, NICE systems.
3. What are the main segments of the Asia Pacific Anti Money Laundering Solutions?
The market segments include Type, Deployment, Solution, Industry.
4. Can you provide details about the market size?
The market size is estimated to be USD 4.13 billion as of 2022.
5. What are some drivers contributing to market growth?
Embedded Insurance is Driving the Market.
6. What are the notable trends driving market growth?
Rise in the Volume of Wired Transactions Driving the Market.
7. Are there any restraints impacting market growth?
Inflation is Restraining the Property and Casualty Insurance Market of Singapore.
8. Can you provide examples of recent developments in the market?
N/A
9. What pricing options are available for accessing the report?
Pricing options include single-user, multi-user, and enterprise licenses priced at USD 3800, USD 4500, and USD 5800 respectively.
10. Is the market size provided in terms of value or volume?
The market size is provided in terms of value, measured in billion.
11. Are there any specific market keywords associated with the report?
Yes, the market keyword associated with the report is "Asia Pacific Anti Money Laundering Solutions," which aids in identifying and referencing the specific market segment covered.
12. How do I determine which pricing option suits my needs best?
The pricing options vary based on user requirements and access needs. Individual users may opt for single-user licenses, while businesses requiring broader access may choose multi-user or enterprise licenses for cost-effective access to the report.
13. Are there any additional resources or data provided in the Asia Pacific Anti Money Laundering Solutions report?
While the report offers comprehensive insights, it's advisable to review the specific contents or supplementary materials provided to ascertain if additional resources or data are available.
14. How can I stay updated on further developments or reports in the Asia Pacific Anti Money Laundering Solutions?
To stay informed about further developments, trends, and reports in the Asia Pacific Anti Money Laundering Solutions, consider subscribing to industry newsletters, following relevant companies and organizations, or regularly checking reputable industry news sources and publications.
Methodology
Step 1 - Identification of Relevant Samples Size from Population Database


Step 2 - Approaches for Defining Global Market Size (Value, Volume* & Price*)

Note*: In applicable scenarios
Step 3 - Data Sources
Primary Research
- Web Analytics
- Survey Reports
- Research Institute
- Latest Research Reports
- Opinion Leaders
Secondary Research
- Annual Reports
- White Paper
- Latest Press Release
- Industry Association
- Paid Database
- Investor Presentations

Step 4 - Data Triangulation
Involves using different sources of information in order to increase the validity of a study
These sources are likely to be stakeholders in a program - participants, other researchers, program staff, other community members, and so on.
Then we put all data in single framework & apply various statistical tools to find out the dynamic on the market.
During the analysis stage, feedback from the stakeholder groups would be compared to determine areas of agreement as well as areas of divergence