

Key Insights
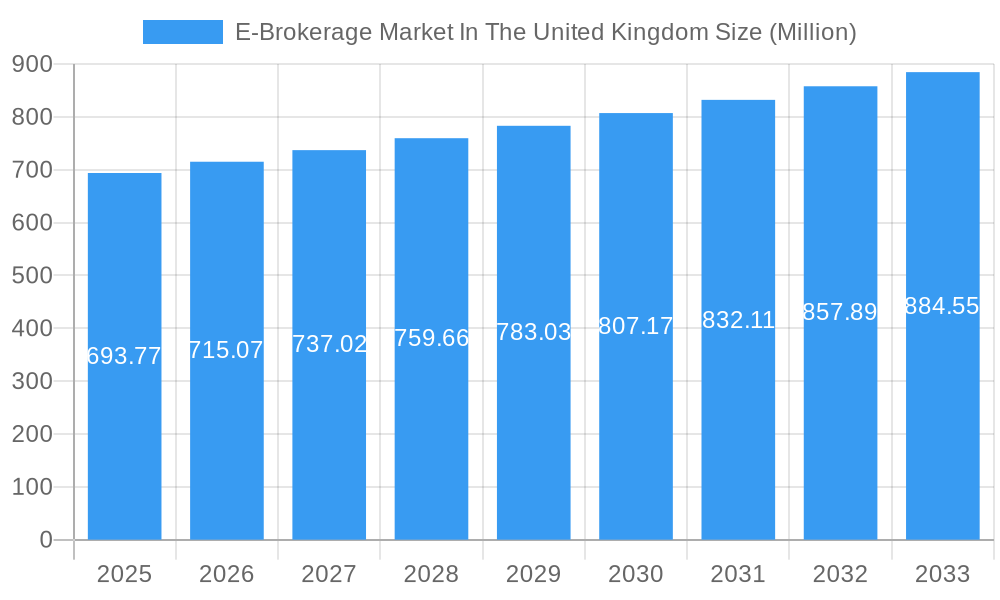
The UK e-brokerage market, valued at £693.77 million in 2025, is projected to experience steady growth, driven by increasing smartphone penetration, rising internet usage, and a growing preference for convenient, digital investment platforms among retail investors. The market's Compound Annual Growth Rate (CAGR) of 2.83% from 2025 to 2033 indicates a consistent expansion, albeit at a moderate pace. This growth is fueled by the increasing availability of sophisticated trading tools and educational resources provided by e-brokerage firms, catering to both novice and experienced traders. Furthermore, competitive pricing strategies and promotions are attracting a wider range of investors. However, regulatory changes, concerns about cybersecurity and data privacy, and the potential impact of economic downturns pose challenges to sustained market expansion. The market is highly competitive, with established players like eToro, Pepperstone, Plus500, Capital.com, IG Group, City Index, and newer entrants like Robinhood and AvaTrade vying for market share. The segmentation of the market likely includes various offerings such as stock trading, forex trading, CFDs, and other investment products, catering to different investor profiles and risk appetites.
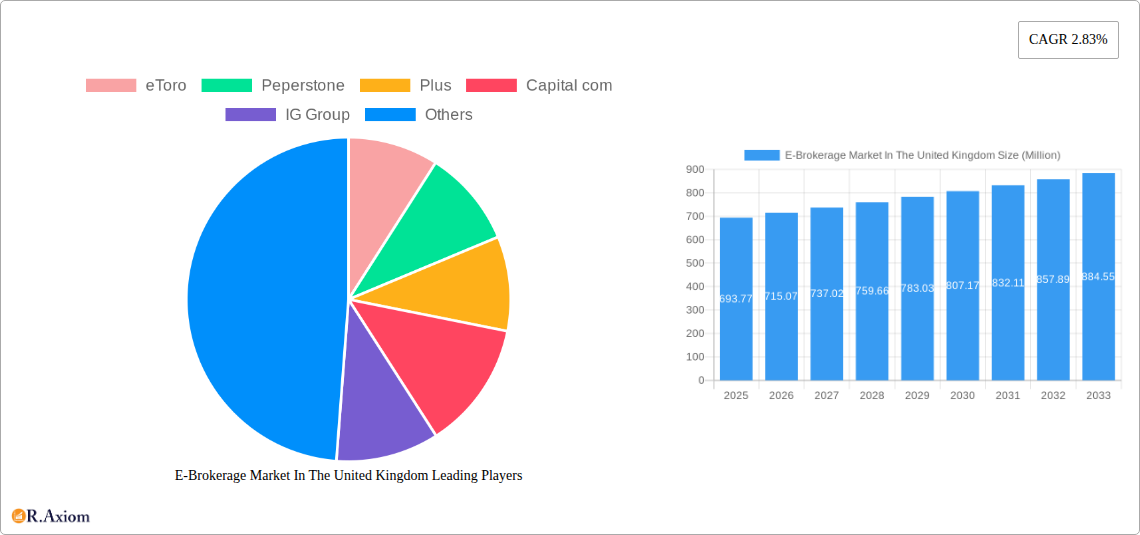
E-Brokerage Market In The United Kingdom Market Size (In Million)
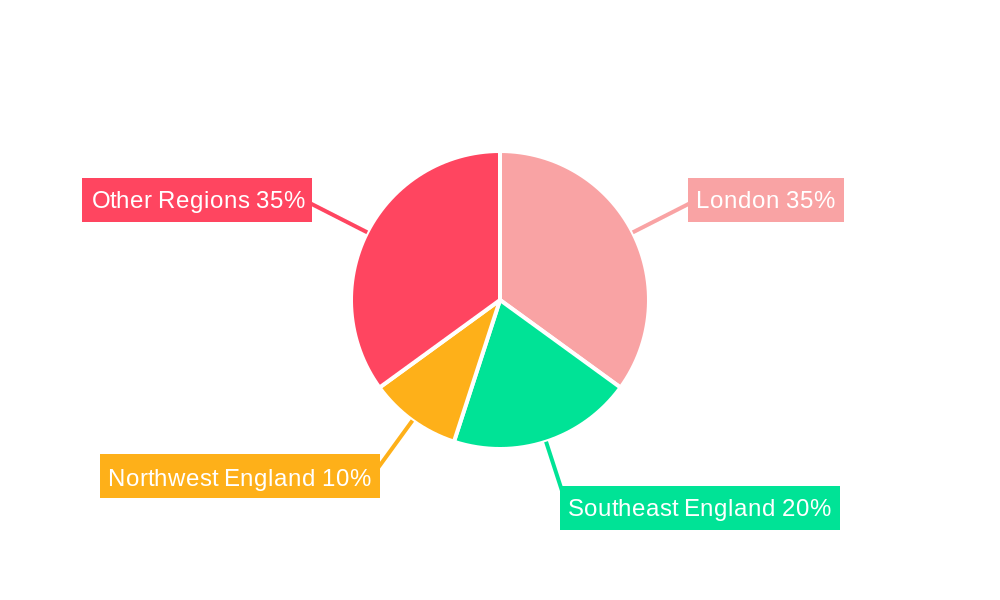
The competitive landscape is likely to intensify in the coming years, driven by technological innovations and the emergence of new fintech companies. Companies are focusing on enhancing their mobile applications, improving user interfaces, and offering personalized investment solutions to attract and retain customers. The regulatory environment plays a crucial role in shaping market dynamics, with stricter regulations potentially impacting the operational costs and profitability of e-brokerage firms. Therefore, the market’s long-term success hinges on the companies' ability to adapt to evolving regulatory requirements, maintain robust security measures, and continuously innovate to meet the evolving needs of the increasingly sophisticated investor base. Geographic distribution within the UK, while not explicitly detailed, likely reflects population density and economic activity, with major urban centers exhibiting higher adoption rates.
E-Brokerage Market In The United Kingdom Company Market Share
E-Brokerage Market In The United Kingdom: A Comprehensive Report (2019-2033)
This in-depth report provides a comprehensive analysis of the UK e-brokerage market, covering the period 2019-2033. It examines market dynamics, competitive landscapes, emerging trends, and growth opportunities, offering actionable insights for stakeholders. The report utilizes robust data and projections to forecast market size, segment performance, and identify key players.
E-Brokerage Market In The United Kingdom Market Concentration & Innovation
This section analyzes the UK e-brokerage market's concentration, innovation drivers, regulatory landscape, and competitive dynamics. We assess market share distribution among key players like eToro, Peperstone, Plus500, Capital.com, IG Group, City Index, Robinhood, AvaTrade, Monesta Markets, and Stocktrade, quantifying their relative strengths. The report also delves into the impact of mergers and acquisitions (M&A) activity, such as the Cenkos-FinnCap merger in March 2023, and estimates their influence on market share and competitive dynamics. Innovation drivers, including technological advancements (e.g., AI-powered trading tools, mobile-first platforms) and regulatory changes, are explored alongside the evolution of product offerings and the rise of commission-free trading models. The report also examines the impact of substitute products (e.g., robo-advisors) and evolving end-user trends.
- Market Concentration: The market is characterized by xx concentration level in 2025, with the top 5 players holding approximately xx% of the market share.
- M&A Activity: The Cenkos-FinnCap merger in 2023 valued at xx Million signifies a trend towards consolidation. Other M&A deals (if any) are also analyzed and their impact is assessed.
- Innovation Drivers: Technological advancements, including AI-driven trading platforms and improved mobile apps, are key innovation drivers, influencing trading experience and accessibility.
- Regulatory Framework: The Financial Conduct Authority (FCA) plays a vital role in shaping the regulatory landscape, impacting market stability and investor protection.
E-Brokerage Market In The United Kingdom Industry Trends & Insights
This section details the UK e-brokerage market's growth trajectory, examining key drivers, technological disruptions, and consumer preferences over the study period (2019-2033). The report presents a comprehensive picture of market dynamics through granular analysis of historical data (2019-2024), a detailed review of the base year (2025), and robust forecasts for the future (2025-2033). Growth drivers like increasing smartphone penetration, rising retail investor participation, and the expansion of commission-free trading are analyzed. Technological disruptions, including the introduction of innovative trading platforms and the increasing adoption of cryptocurrencies, are examined for their impact on market growth and competitive landscapes. Specific metrics such as the Compound Annual Growth Rate (CAGR) and market penetration are calculated and presented to give a clear picture of market evolution. We will also analyze the influence of consumer preferences (e.g., demand for diverse investment products, ease of use) and competitive dynamics in shaping market growth and evolution.
Dominant Markets & Segments in E-Brokerage Market In The United Kingdom
This section identifies the leading segments and regions within the UK e-brokerage market. The analysis delves into factors driving segment dominance, considering economic policies, infrastructure development, and demographic trends. Key characteristics of dominant segments will be detailed, offering insightful perspectives on market dynamics and growth opportunities.
- Key Drivers: Factors driving dominance may include favourable regulatory environments, strong economic growth, and high levels of technological adoption.
- Dominance Analysis: Specific regions or segments demonstrating exceptionally strong growth will be analyzed in detail, highlighting the underlying reasons for their performance.
E-Brokerage Market In The United Kingdom Product Developments
This section summarizes recent product innovations, emphasizing technological trends and their impact on market competitiveness. We examine how new features and functionalities are enhancing the user experience and creating competitive advantages. The report will highlight the role of technological advancements in shaping market dynamics, focusing on areas such as AI-powered tools, enhanced mobile applications, and the integration of diverse investment products.
Report Scope & Segmentation Analysis
This section provides a detailed overview of the market segmentation used in the report. Market size, growth projections, and competitive dynamics are analyzed for each segment. Specific details on the segments explored in this report will be listed here (e.g., by asset class, platform type, or investor demographic). Each segment’s growth trajectory, major players, and competitive forces will be discussed individually.
Key Drivers of E-Brokerage Market In The United Kingdom Growth
This section outlines the key factors driving market growth. We analyze the influence of technological advancements, economic conditions, and regulatory frameworks on market expansion, providing specific examples to illustrate their impacts. The interplay of these factors and their contribution to overall market growth are analyzed.
Challenges in the E-Brokerage Market In The United Kingdom Sector
This section identifies the key challenges faced by the UK e-brokerage market. We discuss the impacts of regulatory hurdles, supply chain disruptions, and competitive pressures on market performance, providing quantitative assessments where possible to illustrate their magnitude.
Emerging Opportunities in E-Brokerage Market In The United Kingdom
This section explores the emerging trends and opportunities within the UK e-brokerage market. We highlight new market segments, technological advancements, and evolving consumer preferences that could drive future growth. Examples of promising avenues are provided.
Leading Players in the E-Brokerage Market In The United Kingdom Market
- eToro
- Peperstone
- Plus500
- Capital.com
- IG Group
- City Index
- Robinhood
- AvaTrade
- Monesta Markets
- Stocktrade
Key Developments in E-Brokerage Market In The United Kingdom Industry
- March 2023: Cenkos and FinnCap merge, creating a larger firm with increased client base and market share. This consolidation impacts market concentration.
- July 2023: Public, a US brokerage firm, launches in the UK, offering commission-free trading on US stocks. This introduces a new competitor and alters the competitive landscape.
Strategic Outlook for E-Brokerage Market In The United Kingdom Market
This section provides a concise overview of the future growth potential of the UK e-brokerage market. We discuss the long-term outlook, considering the factors identified throughout the report and their implications for market evolution and opportunities. The strategic outlook emphasizes the significant growth potential driven by technological advancements, increasing retail investor participation, and the ongoing evolution of trading platforms.
E-Brokerage Market In The United Kingdom Segmentation
-
1. Investor
- 1.1. Retail
- 1.2. Institutional
-
2. Operation
- 2.1. Domestic
- 2.2. Foreign
E-Brokerage Market In The United Kingdom Segmentation By Geography
-
1. North America
- 1.1. United States
- 1.2. Canada
- 1.3. Mexico
-
2. South America
- 2.1. Brazil
- 2.2. Argentina
- 2.3. Rest of South America
-
3. Europe
- 3.1. United Kingdom
- 3.2. Germany
- 3.3. France
- 3.4. Italy
- 3.5. Spain
- 3.6. Russia
- 3.7. Benelux
- 3.8. Nordics
- 3.9. Rest of Europe
-
4. Middle East & Africa
- 4.1. Turkey
- 4.2. Israel
- 4.3. GCC
- 4.4. North Africa
- 4.5. South Africa
- 4.6. Rest of Middle East & Africa
-
5. Asia Pacific
- 5.1. China
- 5.2. India
- 5.3. Japan
- 5.4. South Korea
- 5.5. ASEAN
- 5.6. Oceania
- 5.7. Rest of Asia Pacific
E-Brokerage Market In The United Kingdom Regional Market Share
Geographic Coverage of E-Brokerage Market In The United Kingdom
E-Brokerage Market In The United Kingdom REPORT HIGHLIGHTS
| Aspects | Details |
|---|---|
| Study Period | 2020-2034 |
| Base Year | 2025 |
| Estimated Year | 2026 |
| Forecast Period | 2026-2034 |
| Historical Period | 2020-2025 |
| Growth Rate | CAGR of 2.83% from 2020-2034 |
| Segmentation |
|
Table of Contents
- 1. Introduction
- 1.1. Research Scope
- 1.2. Market Segmentation
- 1.3. Research Objective
- 1.4. Definitions and Assumptions
- 2. Executive Summary
- 2.1. Market Snapshot
- 3. Market Dynamics
- 3.1. Market Drivers
- 3.2. Market Restrains
- 3.3. Market Trends
- 3.4. Market Opportunities
- 4. Market Factor Analysis
- 4.1. Porters Five Forces
- 4.1.1. Bargaining Power of Suppliers
- 4.1.2. Bargaining Power of Buyers
- 4.1.3. Threat of New Entrants
- 4.1.4. Threat of Substitutes
- 4.1.5. Competitive Rivalry
- 4.2. PESTEL analysis
- 4.3. BCG Analysis
- 4.3.1. Stars (High Growth, High Market Share)
- 4.3.2. Cash Cows (Low Growth, High Market Share)
- 4.3.3. Question Mark (High Growth, Low Market Share)
- 4.3.4. Dogs (Low Growth, Low Market Share)
- 4.4. Ansoff Matrix Analysis
- 4.5. Supply Chain Analysis
- 4.6. Regulatory Landscape
- 4.7. Current Market Potential and Opportunity Assessment (TAM–SAM–SOM Framework)
- 4.8. RAX Analyst Note
- 4.1. Porters Five Forces
- 5. Market Analysis, Insights and Forecast 2021-2033
- 5.1. Market Analysis, Insights and Forecast - by Investor
- 5.1.1. Retail
- 5.1.2. Institutional
- 5.2. Market Analysis, Insights and Forecast - by Operation
- 5.2.1. Domestic
- 5.2.2. Foreign
- 5.3. Market Analysis, Insights and Forecast - by Region
- 5.3.1. North America
- 5.3.2. South America
- 5.3.3. Europe
- 5.3.4. Middle East & Africa
- 5.3.5. Asia Pacific
- 5.1. Market Analysis, Insights and Forecast - by Investor
- 6. Global E-Brokerage Market In The United Kingdom Analysis, Insights and Forecast, 2021-2033
- 6.1. Market Analysis, Insights and Forecast - by Investor
- 6.1.1. Retail
- 6.1.2. Institutional
- 6.2. Market Analysis, Insights and Forecast - by Operation
- 6.2.1. Domestic
- 6.2.2. Foreign
- 6.1. Market Analysis, Insights and Forecast - by Investor
- 7. North America E-Brokerage Market In The United Kingdom Analysis, Insights and Forecast, 2020-2032
- 7.1. Market Analysis, Insights and Forecast - by Investor
- 7.1.1. Retail
- 7.1.2. Institutional
- 7.2. Market Analysis, Insights and Forecast - by Operation
- 7.2.1. Domestic
- 7.2.2. Foreign
- 7.1. Market Analysis, Insights and Forecast - by Investor
- 8. South America E-Brokerage Market In The United Kingdom Analysis, Insights and Forecast, 2020-2032
- 8.1. Market Analysis, Insights and Forecast - by Investor
- 8.1.1. Retail
- 8.1.2. Institutional
- 8.2. Market Analysis, Insights and Forecast - by Operation
- 8.2.1. Domestic
- 8.2.2. Foreign
- 8.1. Market Analysis, Insights and Forecast - by Investor
- 9. Europe E-Brokerage Market In The United Kingdom Analysis, Insights and Forecast, 2020-2032
- 9.1. Market Analysis, Insights and Forecast - by Investor
- 9.1.1. Retail
- 9.1.2. Institutional
- 9.2. Market Analysis, Insights and Forecast - by Operation
- 9.2.1. Domestic
- 9.2.2. Foreign
- 9.1. Market Analysis, Insights and Forecast - by Investor
- 10. Middle East & Africa E-Brokerage Market In The United Kingdom Analysis, Insights and Forecast, 2020-2032
- 10.1. Market Analysis, Insights and Forecast - by Investor
- 10.1.1. Retail
- 10.1.2. Institutional
- 10.2. Market Analysis, Insights and Forecast - by Operation
- 10.2.1. Domestic
- 10.2.2. Foreign
- 10.1. Market Analysis, Insights and Forecast - by Investor
- 11. Asia Pacific E-Brokerage Market In The United Kingdom Analysis, Insights and Forecast, 2020-2032
- 11.1. Market Analysis, Insights and Forecast - by Investor
- 11.1.1. Retail
- 11.1.2. Institutional
- 11.2. Market Analysis, Insights and Forecast - by Operation
- 11.2.1. Domestic
- 11.2.2. Foreign
- 11.1. Market Analysis, Insights and Forecast - by Investor
- 12. Competitive Analysis
- 12.1. Company Profiles
- 12.1.1 eToro
- 12.1.1.1. Company Overview
- 12.1.1.2. Products
- 12.1.1.3. Company Financials
- 12.1.1.4. SWOT Analysis
- 12.1.2 Peperstone
- 12.1.2.1. Company Overview
- 12.1.2.2. Products
- 12.1.2.3. Company Financials
- 12.1.2.4. SWOT Analysis
- 12.1.3 Plus
- 12.1.3.1. Company Overview
- 12.1.3.2. Products
- 12.1.3.3. Company Financials
- 12.1.3.4. SWOT Analysis
- 12.1.4 Capital com
- 12.1.4.1. Company Overview
- 12.1.4.2. Products
- 12.1.4.3. Company Financials
- 12.1.4.4. SWOT Analysis
- 12.1.5 IG Group
- 12.1.5.1. Company Overview
- 12.1.5.2. Products
- 12.1.5.3. Company Financials
- 12.1.5.4. SWOT Analysis
- 12.1.6 City Index
- 12.1.6.1. Company Overview
- 12.1.6.2. Products
- 12.1.6.3. Company Financials
- 12.1.6.4. SWOT Analysis
- 12.1.7 Robinhood
- 12.1.7.1. Company Overview
- 12.1.7.2. Products
- 12.1.7.3. Company Financials
- 12.1.7.4. SWOT Analysis
- 12.1.8 AvaTrade
- 12.1.8.1. Company Overview
- 12.1.8.2. Products
- 12.1.8.3. Company Financials
- 12.1.8.4. SWOT Analysis
- 12.1.9 Monesta Markets
- 12.1.9.1. Company Overview
- 12.1.9.2. Products
- 12.1.9.3. Company Financials
- 12.1.9.4. SWOT Analysis
- 12.1.10 Stocktrade
- 12.1.10.1. Company Overview
- 12.1.10.2. Products
- 12.1.10.3. Company Financials
- 12.1.10.4. SWOT Analysis
- 12.1.1 eToro
- 12.2. Market Entropy
- 12.2.1 Company's Key Areas Served
- 12.2.2 Recent Developments
- 12.3. Company Market Share Analysis 2025
- 12.3.1 Top 5 Companies Market Share Analysis
- 12.3.2 Top 3 Companies Market Share Analysis
- 12.4. List of Potential Customers
- 13. Research Methodology
List of Figures
- Figure 1: Global E-Brokerage Market In The United Kingdom Revenue Breakdown (Million, %) by Region 2025 & 2033
- Figure 2: Global E-Brokerage Market In The United Kingdom Volume Breakdown (Million, %) by Region 2025 & 2033
- Figure 3: North America E-Brokerage Market In The United Kingdom Revenue (Million), by Investor 2025 & 2033
- Figure 4: North America E-Brokerage Market In The United Kingdom Volume (Million), by Investor 2025 & 2033
- Figure 5: North America E-Brokerage Market In The United Kingdom Revenue Share (%), by Investor 2025 & 2033
- Figure 6: North America E-Brokerage Market In The United Kingdom Volume Share (%), by Investor 2025 & 2033
- Figure 7: North America E-Brokerage Market In The United Kingdom Revenue (Million), by Operation 2025 & 2033
- Figure 8: North America E-Brokerage Market In The United Kingdom Volume (Million), by Operation 2025 & 2033
- Figure 9: North America E-Brokerage Market In The United Kingdom Revenue Share (%), by Operation 2025 & 2033
- Figure 10: North America E-Brokerage Market In The United Kingdom Volume Share (%), by Operation 2025 & 2033
- Figure 11: North America E-Brokerage Market In The United Kingdom Revenue (Million), by Country 2025 & 2033
- Figure 12: North America E-Brokerage Market In The United Kingdom Volume (Million), by Country 2025 & 2033
- Figure 13: North America E-Brokerage Market In The United Kingdom Revenue Share (%), by Country 2025 & 2033
- Figure 14: North America E-Brokerage Market In The United Kingdom Volume Share (%), by Country 2025 & 2033
- Figure 15: South America E-Brokerage Market In The United Kingdom Revenue (Million), by Investor 2025 & 2033
- Figure 16: South America E-Brokerage Market In The United Kingdom Volume (Million), by Investor 2025 & 2033
- Figure 17: South America E-Brokerage Market In The United Kingdom Revenue Share (%), by Investor 2025 & 2033
- Figure 18: South America E-Brokerage Market In The United Kingdom Volume Share (%), by Investor 2025 & 2033
- Figure 19: South America E-Brokerage Market In The United Kingdom Revenue (Million), by Operation 2025 & 2033
- Figure 20: South America E-Brokerage Market In The United Kingdom Volume (Million), by Operation 2025 & 2033
- Figure 21: South America E-Brokerage Market In The United Kingdom Revenue Share (%), by Operation 2025 & 2033
- Figure 22: South America E-Brokerage Market In The United Kingdom Volume Share (%), by Operation 2025 & 2033
- Figure 23: South America E-Brokerage Market In The United Kingdom Revenue (Million), by Country 2025 & 2033
- Figure 24: South America E-Brokerage Market In The United Kingdom Volume (Million), by Country 2025 & 2033
- Figure 25: South America E-Brokerage Market In The United Kingdom Revenue Share (%), by Country 2025 & 2033
- Figure 26: South America E-Brokerage Market In The United Kingdom Volume Share (%), by Country 2025 & 2033
- Figure 27: Europe E-Brokerage Market In The United Kingdom Revenue (Million), by Investor 2025 & 2033
- Figure 28: Europe E-Brokerage Market In The United Kingdom Volume (Million), by Investor 2025 & 2033
- Figure 29: Europe E-Brokerage Market In The United Kingdom Revenue Share (%), by Investor 2025 & 2033
- Figure 30: Europe E-Brokerage Market In The United Kingdom Volume Share (%), by Investor 2025 & 2033
- Figure 31: Europe E-Brokerage Market In The United Kingdom Revenue (Million), by Operation 2025 & 2033
- Figure 32: Europe E-Brokerage Market In The United Kingdom Volume (Million), by Operation 2025 & 2033
- Figure 33: Europe E-Brokerage Market In The United Kingdom Revenue Share (%), by Operation 2025 & 2033
- Figure 34: Europe E-Brokerage Market In The United Kingdom Volume Share (%), by Operation 2025 & 2033
- Figure 35: Europe E-Brokerage Market In The United Kingdom Revenue (Million), by Country 2025 & 2033
- Figure 36: Europe E-Brokerage Market In The United Kingdom Volume (Million), by Country 2025 & 2033
- Figure 37: Europe E-Brokerage Market In The United Kingdom Revenue Share (%), by Country 2025 & 2033
- Figure 38: Europe E-Brokerage Market In The United Kingdom Volume Share (%), by Country 2025 & 2033
- Figure 39: Middle East & Africa E-Brokerage Market In The United Kingdom Revenue (Million), by Investor 2025 & 2033
- Figure 40: Middle East & Africa E-Brokerage Market In The United Kingdom Volume (Million), by Investor 2025 & 2033
- Figure 41: Middle East & Africa E-Brokerage Market In The United Kingdom Revenue Share (%), by Investor 2025 & 2033
- Figure 42: Middle East & Africa E-Brokerage Market In The United Kingdom Volume Share (%), by Investor 2025 & 2033
- Figure 43: Middle East & Africa E-Brokerage Market In The United Kingdom Revenue (Million), by Operation 2025 & 2033
- Figure 44: Middle East & Africa E-Brokerage Market In The United Kingdom Volume (Million), by Operation 2025 & 2033
- Figure 45: Middle East & Africa E-Brokerage Market In The United Kingdom Revenue Share (%), by Operation 2025 & 2033
- Figure 46: Middle East & Africa E-Brokerage Market In The United Kingdom Volume Share (%), by Operation 2025 & 2033
- Figure 47: Middle East & Africa E-Brokerage Market In The United Kingdom Revenue (Million), by Country 2025 & 2033
- Figure 48: Middle East & Africa E-Brokerage Market In The United Kingdom Volume (Million), by Country 2025 & 2033
- Figure 49: Middle East & Africa E-Brokerage Market In The United Kingdom Revenue Share (%), by Country 2025 & 2033
- Figure 50: Middle East & Africa E-Brokerage Market In The United Kingdom Volume Share (%), by Country 2025 & 2033
- Figure 51: Asia Pacific E-Brokerage Market In The United Kingdom Revenue (Million), by Investor 2025 & 2033
- Figure 52: Asia Pacific E-Brokerage Market In The United Kingdom Volume (Million), by Investor 2025 & 2033
- Figure 53: Asia Pacific E-Brokerage Market In The United Kingdom Revenue Share (%), by Investor 2025 & 2033
- Figure 54: Asia Pacific E-Brokerage Market In The United Kingdom Volume Share (%), by Investor 2025 & 2033
- Figure 55: Asia Pacific E-Brokerage Market In The United Kingdom Revenue (Million), by Operation 2025 & 2033
- Figure 56: Asia Pacific E-Brokerage Market In The United Kingdom Volume (Million), by Operation 2025 & 2033
- Figure 57: Asia Pacific E-Brokerage Market In The United Kingdom Revenue Share (%), by Operation 2025 & 2033
- Figure 58: Asia Pacific E-Brokerage Market In The United Kingdom Volume Share (%), by Operation 2025 & 2033
- Figure 59: Asia Pacific E-Brokerage Market In The United Kingdom Revenue (Million), by Country 2025 & 2033
- Figure 60: Asia Pacific E-Brokerage Market In The United Kingdom Volume (Million), by Country 2025 & 2033
- Figure 61: Asia Pacific E-Brokerage Market In The United Kingdom Revenue Share (%), by Country 2025 & 2033
- Figure 62: Asia Pacific E-Brokerage Market In The United Kingdom Volume Share (%), by Country 2025 & 2033
List of Tables
- Table 1: Global E-Brokerage Market In The United Kingdom Revenue Million Forecast, by Investor 2020 & 2033
- Table 2: Global E-Brokerage Market In The United Kingdom Volume Million Forecast, by Investor 2020 & 2033
- Table 3: Global E-Brokerage Market In The United Kingdom Revenue Million Forecast, by Operation 2020 & 2033
- Table 4: Global E-Brokerage Market In The United Kingdom Volume Million Forecast, by Operation 2020 & 2033
- Table 5: Global E-Brokerage Market In The United Kingdom Revenue Million Forecast, by Region 2020 & 2033
- Table 6: Global E-Brokerage Market In The United Kingdom Volume Million Forecast, by Region 2020 & 2033
- Table 7: Global E-Brokerage Market In The United Kingdom Revenue Million Forecast, by Investor 2020 & 2033
- Table 8: Global E-Brokerage Market In The United Kingdom Volume Million Forecast, by Investor 2020 & 2033
- Table 9: Global E-Brokerage Market In The United Kingdom Revenue Million Forecast, by Operation 2020 & 2033
- Table 10: Global E-Brokerage Market In The United Kingdom Volume Million Forecast, by Operation 2020 & 2033
- Table 11: Global E-Brokerage Market In The United Kingdom Revenue Million Forecast, by Country 2020 & 2033
- Table 12: Global E-Brokerage Market In The United Kingdom Volume Million Forecast, by Country 2020 & 2033
- Table 13: United States E-Brokerage Market In The United Kingdom Revenue (Million) Forecast, by Application 2020 & 2033
- Table 14: United States E-Brokerage Market In The United Kingdom Volume (Million) Forecast, by Application 2020 & 2033
- Table 15: Canada E-Brokerage Market In The United Kingdom Revenue (Million) Forecast, by Application 2020 & 2033
- Table 16: Canada E-Brokerage Market In The United Kingdom Volume (Million) Forecast, by Application 2020 & 2033
- Table 17: Mexico E-Brokerage Market In The United Kingdom Revenue (Million) Forecast, by Application 2020 & 2033
- Table 18: Mexico E-Brokerage Market In The United Kingdom Volume (Million) Forecast, by Application 2020 & 2033
- Table 19: Global E-Brokerage Market In The United Kingdom Revenue Million Forecast, by Investor 2020 & 2033
- Table 20: Global E-Brokerage Market In The United Kingdom Volume Million Forecast, by Investor 2020 & 2033
- Table 21: Global E-Brokerage Market In The United Kingdom Revenue Million Forecast, by Operation 2020 & 2033
- Table 22: Global E-Brokerage Market In The United Kingdom Volume Million Forecast, by Operation 2020 & 2033
- Table 23: Global E-Brokerage Market In The United Kingdom Revenue Million Forecast, by Country 2020 & 2033
- Table 24: Global E-Brokerage Market In The United Kingdom Volume Million Forecast, by Country 2020 & 2033
- Table 25: Brazil E-Brokerage Market In The United Kingdom Revenue (Million) Forecast, by Application 2020 & 2033
- Table 26: Brazil E-Brokerage Market In The United Kingdom Volume (Million) Forecast, by Application 2020 & 2033
- Table 27: Argentina E-Brokerage Market In The United Kingdom Revenue (Million) Forecast, by Application 2020 & 2033
- Table 28: Argentina E-Brokerage Market In The United Kingdom Volume (Million) Forecast, by Application 2020 & 2033
- Table 29: Rest of South America E-Brokerage Market In The United Kingdom Revenue (Million) Forecast, by Application 2020 & 2033
- Table 30: Rest of South America E-Brokerage Market In The United Kingdom Volume (Million) Forecast, by Application 2020 & 2033
- Table 31: Global E-Brokerage Market In The United Kingdom Revenue Million Forecast, by Investor 2020 & 2033
- Table 32: Global E-Brokerage Market In The United Kingdom Volume Million Forecast, by Investor 2020 & 2033
- Table 33: Global E-Brokerage Market In The United Kingdom Revenue Million Forecast, by Operation 2020 & 2033
- Table 34: Global E-Brokerage Market In The United Kingdom Volume Million Forecast, by Operation 2020 & 2033
- Table 35: Global E-Brokerage Market In The United Kingdom Revenue Million Forecast, by Country 2020 & 2033
- Table 36: Global E-Brokerage Market In The United Kingdom Volume Million Forecast, by Country 2020 & 2033
- Table 37: United Kingdom E-Brokerage Market In The United Kingdom Revenue (Million) Forecast, by Application 2020 & 2033
- Table 38: United Kingdom E-Brokerage Market In The United Kingdom Volume (Million) Forecast, by Application 2020 & 2033
- Table 39: Germany E-Brokerage Market In The United Kingdom Revenue (Million) Forecast, by Application 2020 & 2033
- Table 40: Germany E-Brokerage Market In The United Kingdom Volume (Million) Forecast, by Application 2020 & 2033
- Table 41: France E-Brokerage Market In The United Kingdom Revenue (Million) Forecast, by Application 2020 & 2033
- Table 42: France E-Brokerage Market In The United Kingdom Volume (Million) Forecast, by Application 2020 & 2033
- Table 43: Italy E-Brokerage Market In The United Kingdom Revenue (Million) Forecast, by Application 2020 & 2033
- Table 44: Italy E-Brokerage Market In The United Kingdom Volume (Million) Forecast, by Application 2020 & 2033
- Table 45: Spain E-Brokerage Market In The United Kingdom Revenue (Million) Forecast, by Application 2020 & 2033
- Table 46: Spain E-Brokerage Market In The United Kingdom Volume (Million) Forecast, by Application 2020 & 2033
- Table 47: Russia E-Brokerage Market In The United Kingdom Revenue (Million) Forecast, by Application 2020 & 2033
- Table 48: Russia E-Brokerage Market In The United Kingdom Volume (Million) Forecast, by Application 2020 & 2033
- Table 49: Benelux E-Brokerage Market In The United Kingdom Revenue (Million) Forecast, by Application 2020 & 2033
- Table 50: Benelux E-Brokerage Market In The United Kingdom Volume (Million) Forecast, by Application 2020 & 2033
- Table 51: Nordics E-Brokerage Market In The United Kingdom Revenue (Million) Forecast, by Application 2020 & 2033
- Table 52: Nordics E-Brokerage Market In The United Kingdom Volume (Million) Forecast, by Application 2020 & 2033
- Table 53: Rest of Europe E-Brokerage Market In The United Kingdom Revenue (Million) Forecast, by Application 2020 & 2033
- Table 54: Rest of Europe E-Brokerage Market In The United Kingdom Volume (Million) Forecast, by Application 2020 & 2033
- Table 55: Global E-Brokerage Market In The United Kingdom Revenue Million Forecast, by Investor 2020 & 2033
- Table 56: Global E-Brokerage Market In The United Kingdom Volume Million Forecast, by Investor 2020 & 2033
- Table 57: Global E-Brokerage Market In The United Kingdom Revenue Million Forecast, by Operation 2020 & 2033
- Table 58: Global E-Brokerage Market In The United Kingdom Volume Million Forecast, by Operation 2020 & 2033
- Table 59: Global E-Brokerage Market In The United Kingdom Revenue Million Forecast, by Country 2020 & 2033
- Table 60: Global E-Brokerage Market In The United Kingdom Volume Million Forecast, by Country 2020 & 2033
- Table 61: Turkey E-Brokerage Market In The United Kingdom Revenue (Million) Forecast, by Application 2020 & 2033
- Table 62: Turkey E-Brokerage Market In The United Kingdom Volume (Million) Forecast, by Application 2020 & 2033
- Table 63: Israel E-Brokerage Market In The United Kingdom Revenue (Million) Forecast, by Application 2020 & 2033
- Table 64: Israel E-Brokerage Market In The United Kingdom Volume (Million) Forecast, by Application 2020 & 2033
- Table 65: GCC E-Brokerage Market In The United Kingdom Revenue (Million) Forecast, by Application 2020 & 2033
- Table 66: GCC E-Brokerage Market In The United Kingdom Volume (Million) Forecast, by Application 2020 & 2033
- Table 67: North Africa E-Brokerage Market In The United Kingdom Revenue (Million) Forecast, by Application 2020 & 2033
- Table 68: North Africa E-Brokerage Market In The United Kingdom Volume (Million) Forecast, by Application 2020 & 2033
- Table 69: South Africa E-Brokerage Market In The United Kingdom Revenue (Million) Forecast, by Application 2020 & 2033
- Table 70: South Africa E-Brokerage Market In The United Kingdom Volume (Million) Forecast, by Application 2020 & 2033
- Table 71: Rest of Middle East & Africa E-Brokerage Market In The United Kingdom Revenue (Million) Forecast, by Application 2020 & 2033
- Table 72: Rest of Middle East & Africa E-Brokerage Market In The United Kingdom Volume (Million) Forecast, by Application 2020 & 2033
- Table 73: Global E-Brokerage Market In The United Kingdom Revenue Million Forecast, by Investor 2020 & 2033
- Table 74: Global E-Brokerage Market In The United Kingdom Volume Million Forecast, by Investor 2020 & 2033
- Table 75: Global E-Brokerage Market In The United Kingdom Revenue Million Forecast, by Operation 2020 & 2033
- Table 76: Global E-Brokerage Market In The United Kingdom Volume Million Forecast, by Operation 2020 & 2033
- Table 77: Global E-Brokerage Market In The United Kingdom Revenue Million Forecast, by Country 2020 & 2033
- Table 78: Global E-Brokerage Market In The United Kingdom Volume Million Forecast, by Country 2020 & 2033
- Table 79: China E-Brokerage Market In The United Kingdom Revenue (Million) Forecast, by Application 2020 & 2033
- Table 80: China E-Brokerage Market In The United Kingdom Volume (Million) Forecast, by Application 2020 & 2033
- Table 81: India E-Brokerage Market In The United Kingdom Revenue (Million) Forecast, by Application 2020 & 2033
- Table 82: India E-Brokerage Market In The United Kingdom Volume (Million) Forecast, by Application 2020 & 2033
- Table 83: Japan E-Brokerage Market In The United Kingdom Revenue (Million) Forecast, by Application 2020 & 2033
- Table 84: Japan E-Brokerage Market In The United Kingdom Volume (Million) Forecast, by Application 2020 & 2033
- Table 85: South Korea E-Brokerage Market In The United Kingdom Revenue (Million) Forecast, by Application 2020 & 2033
- Table 86: South Korea E-Brokerage Market In The United Kingdom Volume (Million) Forecast, by Application 2020 & 2033
- Table 87: ASEAN E-Brokerage Market In The United Kingdom Revenue (Million) Forecast, by Application 2020 & 2033
- Table 88: ASEAN E-Brokerage Market In The United Kingdom Volume (Million) Forecast, by Application 2020 & 2033
- Table 89: Oceania E-Brokerage Market In The United Kingdom Revenue (Million) Forecast, by Application 2020 & 2033
- Table 90: Oceania E-Brokerage Market In The United Kingdom Volume (Million) Forecast, by Application 2020 & 2033
- Table 91: Rest of Asia Pacific E-Brokerage Market In The United Kingdom Revenue (Million) Forecast, by Application 2020 & 2033
- Table 92: Rest of Asia Pacific E-Brokerage Market In The United Kingdom Volume (Million) Forecast, by Application 2020 & 2033
Frequently Asked Questions
1. What is the projected Compound Annual Growth Rate (CAGR) of the E-Brokerage Market In The United Kingdom?
The projected CAGR is approximately 2.83%.
2. Which companies are prominent players in the E-Brokerage Market In The United Kingdom?
Key companies in the market include eToro, Peperstone, Plus, Capital com, IG Group, City Index, Robinhood, AvaTrade, Monesta Markets, Stocktrade.
3. What are the main segments of the E-Brokerage Market In The United Kingdom?
The market segments include Investor, Operation.
4. Can you provide details about the market size?
The market size is estimated to be USD 693.77 Million as of 2022.
5. What are some drivers contributing to market growth?
Convenience and Cost-Effectiveness; Real Time Analysis of Market Available In E-Brokerage Platforms.
6. What are the notable trends driving market growth?
Rising Digital Innovation & Adoption of Artificial Intelligence (AI) and Machine Learning (ML).
7. Are there any restraints impacting market growth?
Convenience and Cost-Effectiveness; Real Time Analysis of Market Available In E-Brokerage Platforms.
8. Can you provide examples of recent developments in the market?
In March 2023, the United Kingdom broking firm Cenkos merged with FinnCap. Post merger both companies own a 50% share of the new firm with the company being named FinnCap. The merger will strengthen the position of both firms with an increase in clients and new customers.
9. What pricing options are available for accessing the report?
Pricing options include single-user, multi-user, and enterprise licenses priced at USD 3800, USD 4500, and USD 5800 respectively.
10. Is the market size provided in terms of value or volume?
The market size is provided in terms of value, measured in Million and volume, measured in Million.
11. Are there any specific market keywords associated with the report?
Yes, the market keyword associated with the report is "E-Brokerage Market In The United Kingdom," which aids in identifying and referencing the specific market segment covered.
12. How do I determine which pricing option suits my needs best?
The pricing options vary based on user requirements and access needs. Individual users may opt for single-user licenses, while businesses requiring broader access may choose multi-user or enterprise licenses for cost-effective access to the report.
13. Are there any additional resources or data provided in the E-Brokerage Market In The United Kingdom report?
While the report offers comprehensive insights, it's advisable to review the specific contents or supplementary materials provided to ascertain if additional resources or data are available.
14. How can I stay updated on further developments or reports in the E-Brokerage Market In The United Kingdom?
To stay informed about further developments, trends, and reports in the E-Brokerage Market In The United Kingdom, consider subscribing to industry newsletters, following relevant companies and organizations, or regularly checking reputable industry news sources and publications.
Methodology
Step 1 - Identification of Relevant Samples Size from Population Database


Step 2 - Approaches for Defining Global Market Size (Value, Volume* & Price*)

Note*: In applicable scenarios
Step 3 - Data Sources
Primary Research
- Web Analytics
- Survey Reports
- Research Institute
- Latest Research Reports
- Opinion Leaders
Secondary Research
- Annual Reports
- White Paper
- Latest Press Release
- Industry Association
- Paid Database
- Investor Presentations

Step 4 - Data Triangulation
Involves using different sources of information in order to increase the validity of a study
These sources are likely to be stakeholders in a program - participants, other researchers, program staff, other community members, and so on.
Then we put all data in single framework & apply various statistical tools to find out the dynamic on the market.
During the analysis stage, feedback from the stakeholder groups would be compared to determine areas of agreement as well as areas of divergence